Mountain Lakes, NH Map & Demographics
Mountain Lakes Map
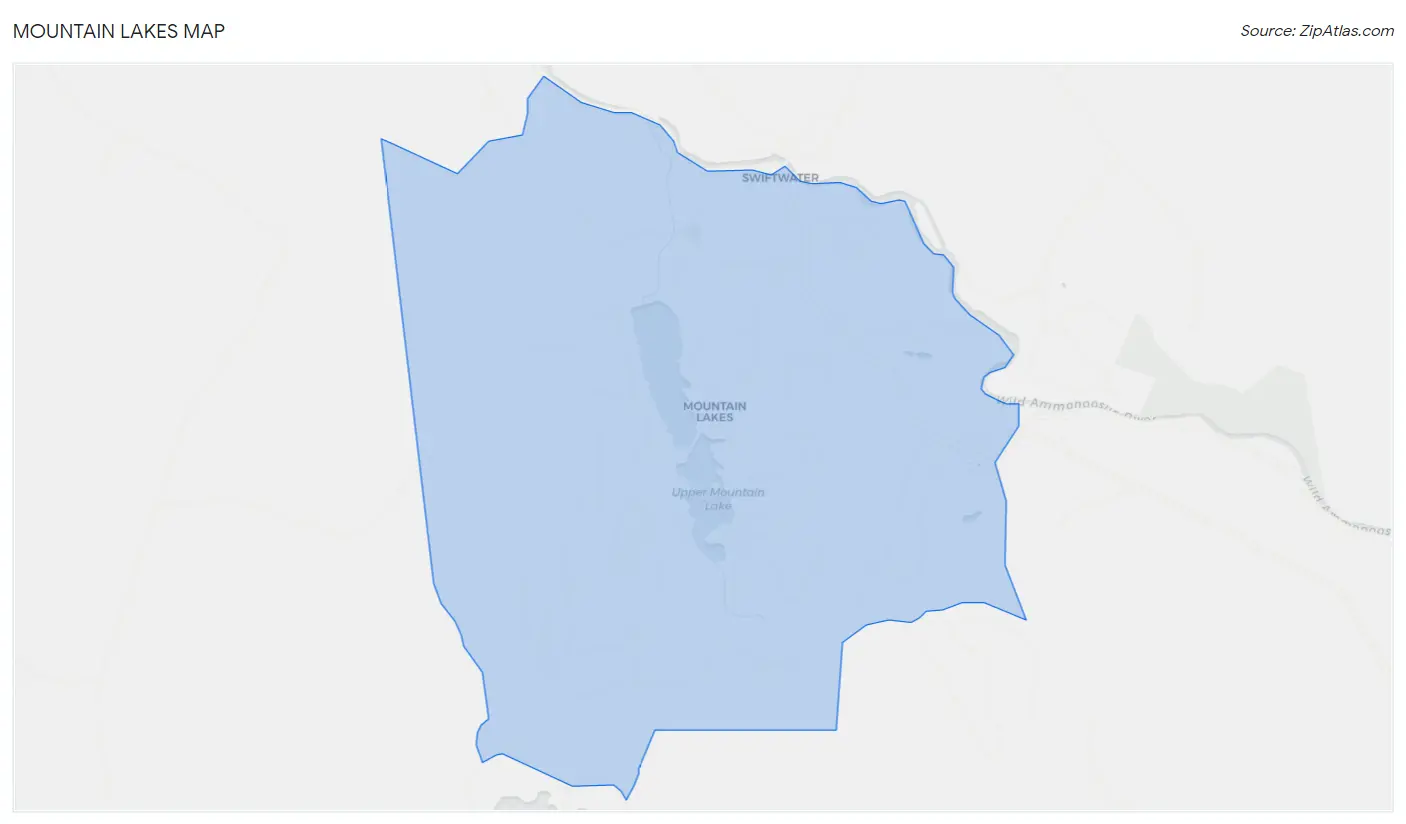
Mountain Lakes Overview
$36,885
PER CAPITA INCOME
$58,393
AVG FAMILY INCOME
$59,107
AVG HOUSEHOLD INCOME
0.32
INEQUALITY / GINI INDEX
597
TOTAL POPULATION
185
MALE POPULATION
412
FEMALE POPULATION
44.90
MALES / 100 FEMALES
222.70
FEMALES / 100 MALES
50.8
MEDIAN AGE
2.5
AVG FAMILY SIZE
2.5
AVG HOUSEHOLD SIZE
300
LABOR FORCE [ PEOPLE ]
56.7%
PERCENT IN LABOR FORCE
1.3%
UNEMPLOYMENT RATE
Income in Mountain Lakes
Income Overview in Mountain Lakes
Per Capita Income in Mountain Lakes is $36,885, while median incomes of families and households are $58,393 and $59,107 respectively.
| Characteristic | Number | Measure |
| Per Capita Income | 597 | $36,885 |
| Median Family Income | 211 | $58,393 |
| Mean Family Income | 211 | $67,345 |
| Median Household Income | 239 | $59,107 |
| Mean Household Income | 239 | $68,920 |
| Income Deficit | 211 | $0 |
| Wage / Income Gap (%) | 597 | 0.00% |
| Wage / Income Gap ($) | 597 | 100.00¢ per $1 |
| Gini / Inequality Index | 597 | 0.32 |
Earnings by Sex in Mountain Lakes
| Sex | Number | Average Earnings |
| Male | 114 (38.0%) | $0 |
| Female | 186 (62.0%) | $0 |
| Total | 300 (100.0%) | $0 |
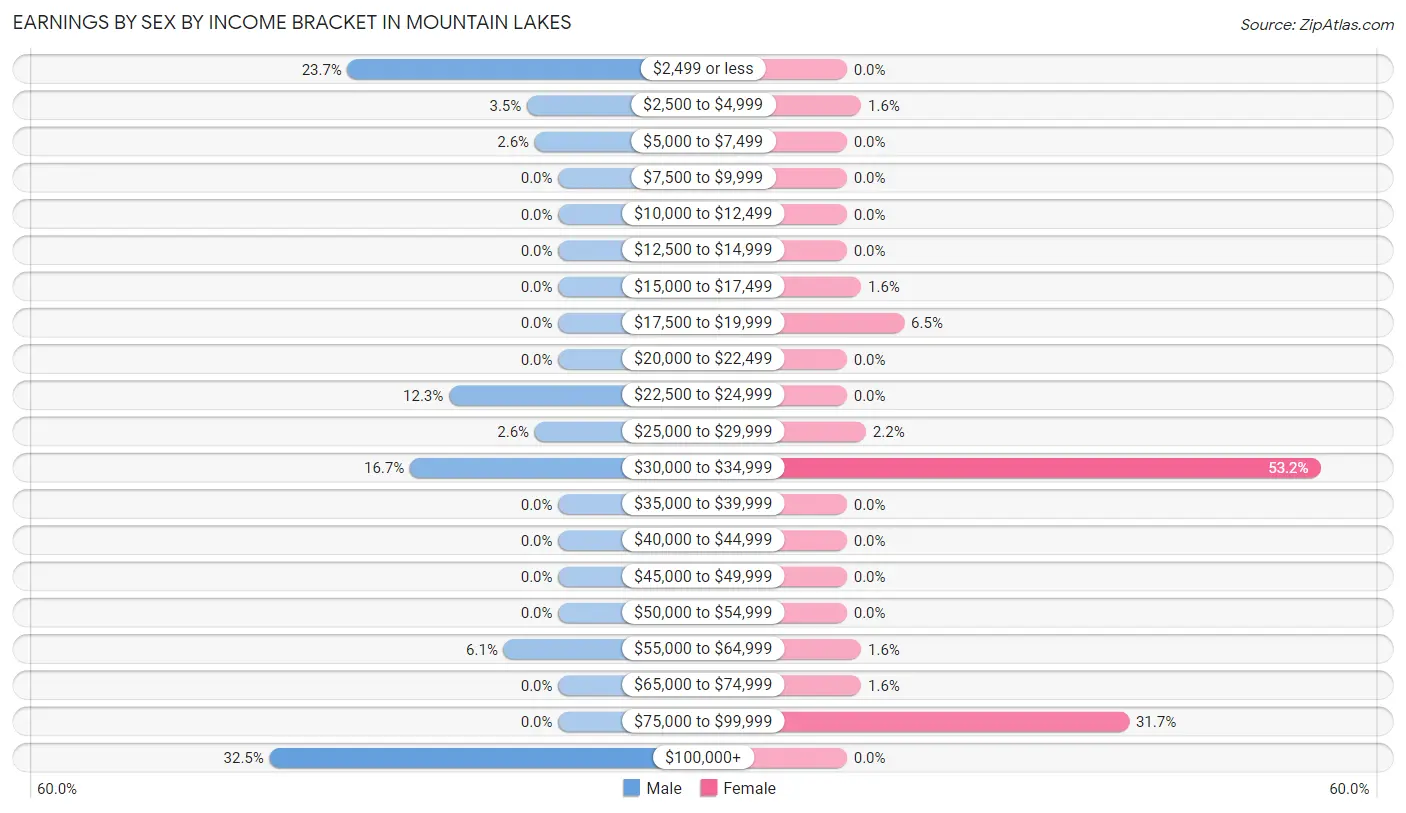
Earnings by Sex by Income Bracket in Mountain Lakes
The most common earnings brackets in Mountain Lakes are $100,000+ for men (37 | 32.5%) and $30,000 to $34,999 for women (99 | 53.2%).
| Income | Male | Female |
| $2,499 or less | 27 (23.7%) | 0 (0.0%) |
| $2,500 to $4,999 | 4 (3.5%) | 3 (1.6%) |
| $5,000 to $7,499 | 3 (2.6%) | 0 (0.0%) |
| $7,500 to $9,999 | 0 (0.0%) | 0 (0.0%) |
| $10,000 to $12,499 | 0 (0.0%) | 0 (0.0%) |
| $12,500 to $14,999 | 0 (0.0%) | 0 (0.0%) |
| $15,000 to $17,499 | 0 (0.0%) | 3 (1.6%) |
| $17,500 to $19,999 | 0 (0.0%) | 12 (6.5%) |
| $20,000 to $22,499 | 0 (0.0%) | 0 (0.0%) |
| $22,500 to $24,999 | 14 (12.3%) | 0 (0.0%) |
| $25,000 to $29,999 | 3 (2.6%) | 4 (2.1%) |
| $30,000 to $34,999 | 19 (16.7%) | 99 (53.2%) |
| $35,000 to $39,999 | 0 (0.0%) | 0 (0.0%) |
| $40,000 to $44,999 | 0 (0.0%) | 0 (0.0%) |
| $45,000 to $49,999 | 0 (0.0%) | 0 (0.0%) |
| $50,000 to $54,999 | 0 (0.0%) | 0 (0.0%) |
| $55,000 to $64,999 | 7 (6.1%) | 3 (1.6%) |
| $65,000 to $74,999 | 0 (0.0%) | 3 (1.6%) |
| $75,000 to $99,999 | 0 (0.0%) | 59 (31.7%) |
| $100,000+ | 37 (32.5%) | 0 (0.0%) |
| Total | 114 (100.0%) | 186 (100.0%) |
Earnings by Sex by Educational Attainment in Mountain Lakes
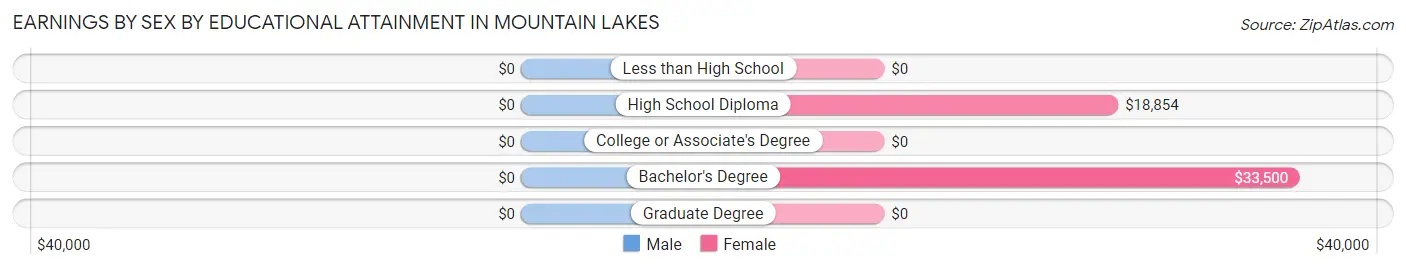
| Educational Attainment | Male Income | Female Income |
| Less than High School | - | - |
| High School Diploma | - | - |
| College or Associate's Degree | - | - |
| Bachelor's Degree | - | - |
| Graduate Degree | - | - |
| Total | - | - |
Family Income in Mountain Lakes
Family Income Brackets in Mountain Lakes
According to the Mountain Lakes family income data, there are 57 families falling into the $75,000 to $99,999 income range, which is the most common income bracket and makes up 27.0% of all families.
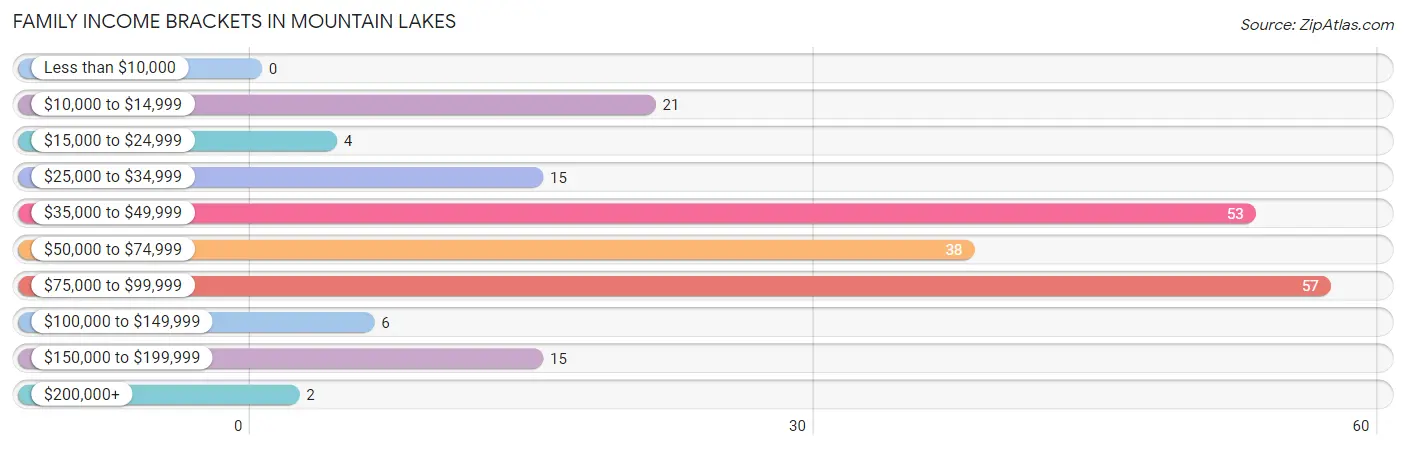
| Income Bracket | # Families | % Families |
| Less than $10,000 | 0 | 0.0% |
| $10,000 to $14,999 | 21 | 10.0% |
| $15,000 to $24,999 | 4 | 1.9% |
| $25,000 to $34,999 | 15 | 7.1% |
| $35,000 to $49,999 | 53 | 25.1% |
| $50,000 to $74,999 | 38 | 18.0% |
| $75,000 to $99,999 | 57 | 27.0% |
| $100,000 to $149,999 | 6 | 2.8% |
| $150,000 to $199,999 | 15 | 7.1% |
| $200,000+ | 2 | 0.9% |
Family Income by Famaliy Size in Mountain Lakes
2-person families (156 | 73.9%) account for the highest median family income in Mountain Lakes with $73,750 per family, while 2-person families (156 | 73.9%) have the highest median income of $36,875 per family member.
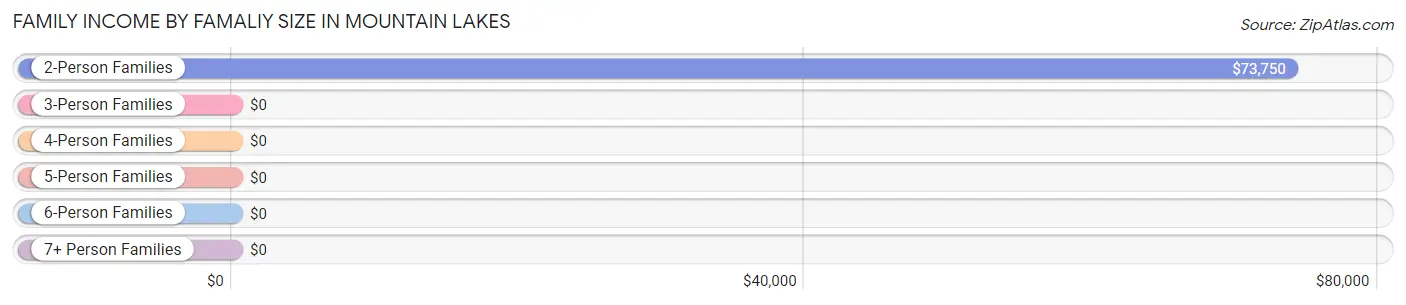
| Income Bracket | # Families | Median Income |
| 2-Person Families | 156 (73.9%) | $73,750 |
| 3-Person Families | 53 (25.1%) | $0 |
| 4-Person Families | 2 (0.9%) | $0 |
| 5-Person Families | 0 (0.0%) | $0 |
| 6-Person Families | 0 (0.0%) | $0 |
| 7+ Person Families | 0 (0.0%) | $0 |
| Total | 211 (100.0%) | $58,393 |
Family Income by Number of Earners in Mountain Lakes
| Number of Earners | # Families | Median Income |
| No Earners | 74 (35.1%) | $0 |
| 1 Earner | 78 (37.0%) | $0 |
| 2 Earners | 57 (27.0%) | $0 |
| 3+ Earners | 2 (0.9%) | $0 |
| Total | 211 (100.0%) | $58,393 |
Household Income in Mountain Lakes
Household Income Brackets in Mountain Lakes
With 73 households falling in the category, the $75,000 to $99,999 income range is the most frequent in Mountain Lakes, accounting for 30.5% of all households.
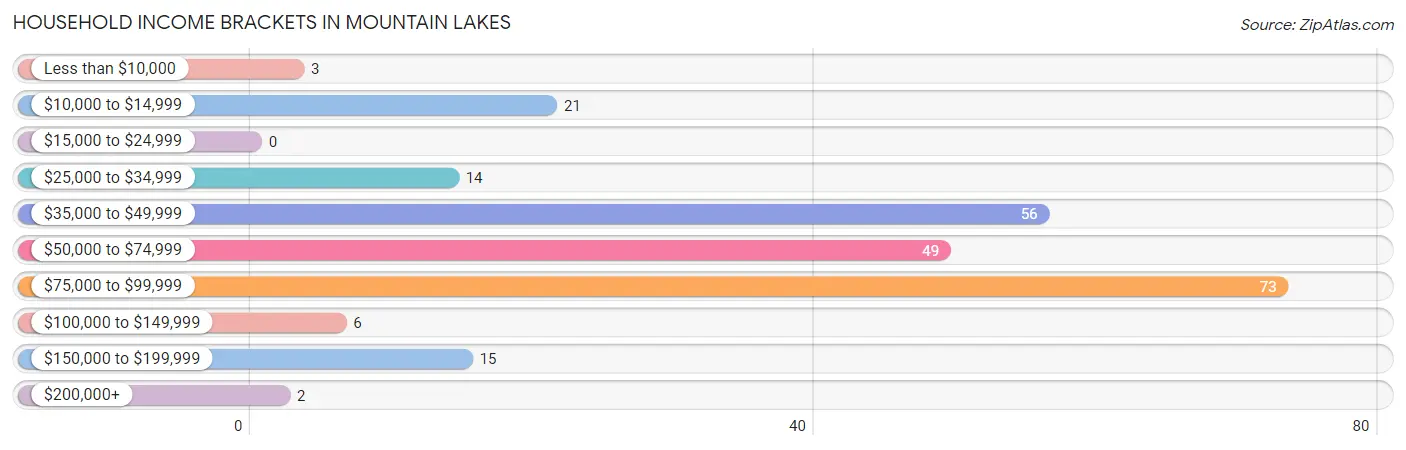
| Income Bracket | # Households | % Households |
| Less than $10,000 | 3 | 1.3% |
| $10,000 to $14,999 | 21 | 8.8% |
| $15,000 to $24,999 | 0 | 0.0% |
| $25,000 to $34,999 | 14 | 5.9% |
| $35,000 to $49,999 | 56 | 23.4% |
| $50,000 to $74,999 | 49 | 20.5% |
| $75,000 to $99,999 | 73 | 30.5% |
| $100,000 to $149,999 | 6 | 2.5% |
| $150,000 to $199,999 | 15 | 6.3% |
| $200,000+ | 2 | 0.8% |
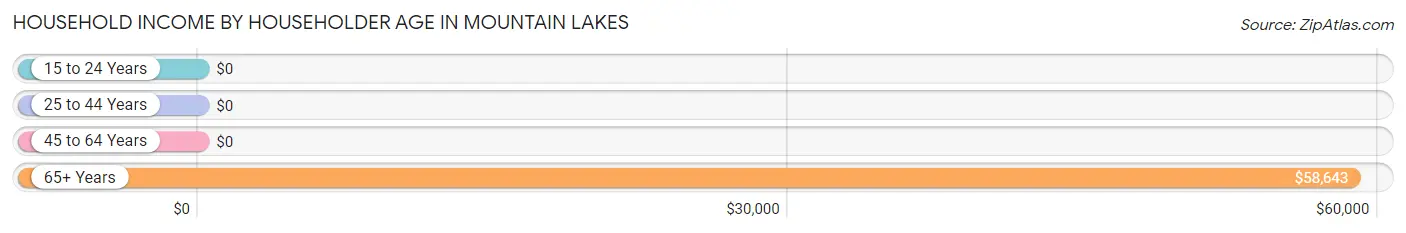
Household Income by Householder Age in Mountain Lakes
The median household income in Mountain Lakes is $59,107, with the highest median household income of $58,643 found in the 65+ years age bracket for the primary householder. A total of 60 households (25.1%) fall into this category.
| Income Bracket | # Households | Median Income |
| 15 to 24 Years | 0 (0.0%) | $0 |
| 25 to 44 Years | 7 (2.9%) | $0 |
| 45 to 64 Years | 172 (72.0%) | $0 |
| 65+ Years | 60 (25.1%) | $58,643 |
| Total | 239 (100.0%) | $59,107 |
Poverty in Mountain Lakes
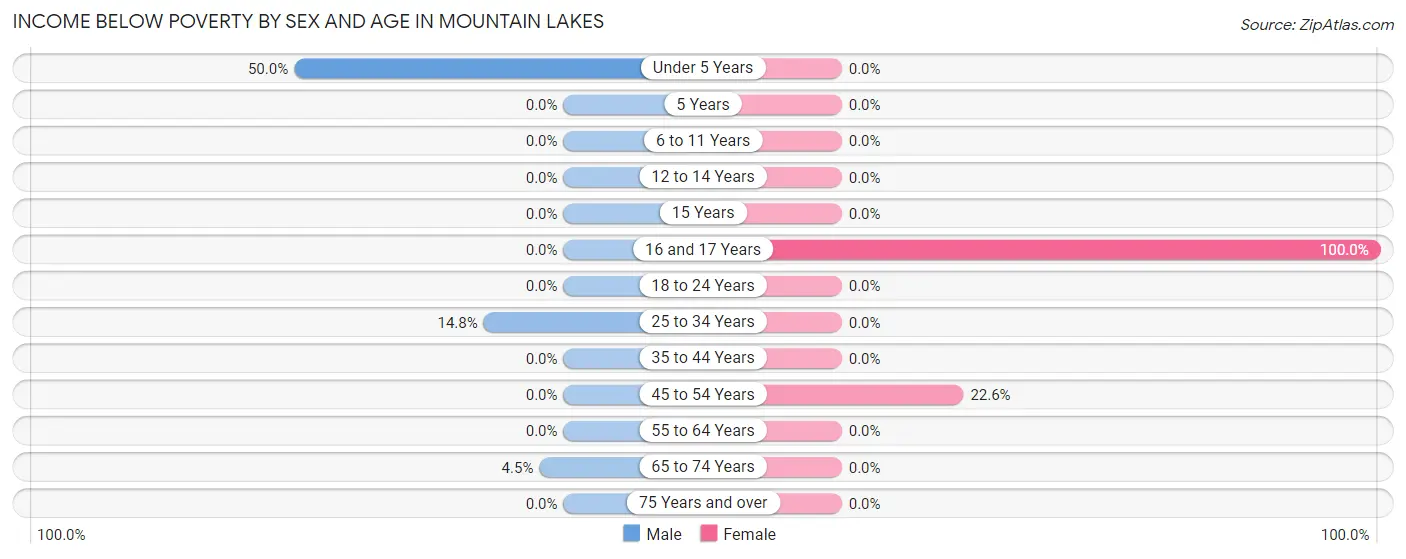
Income Below Poverty by Sex and Age in Mountain Lakes
With 5.9% poverty level for males and 12.4% for females among the residents of Mountain Lakes, under 5 year old males and 16 and 17 year old females are the most vulnerable to poverty, with 4 males (50.0%) and 30 females (100.0%) in their respective age groups living below the poverty level.
| Age Bracket | Male | Female |
| Under 5 Years | 4 (50.0%) | 0 (0.0%) |
| 5 Years | 0 (0.0%) | 0 (0.0%) |
| 6 to 11 Years | 0 (0.0%) | 0 (0.0%) |
| 12 to 14 Years | 0 (0.0%) | 0 (0.0%) |
| 15 Years | 0 (0.0%) | 0 (0.0%) |
| 16 and 17 Years | 0 (0.0%) | 30 (100.0%) |
| 18 to 24 Years | 0 (0.0%) | 0 (0.0%) |
| 25 to 34 Years | 4 (14.8%) | 0 (0.0%) |
| 35 to 44 Years | 0 (0.0%) | 0 (0.0%) |
| 45 to 54 Years | 0 (0.0%) | 21 (22.6%) |
| 55 to 64 Years | 0 (0.0%) | 0 (0.0%) |
| 65 to 74 Years | 3 (4.5%) | 0 (0.0%) |
| 75 Years and over | 0 (0.0%) | 0 (0.0%) |
| Total | 11 (5.9%) | 51 (12.4%) |
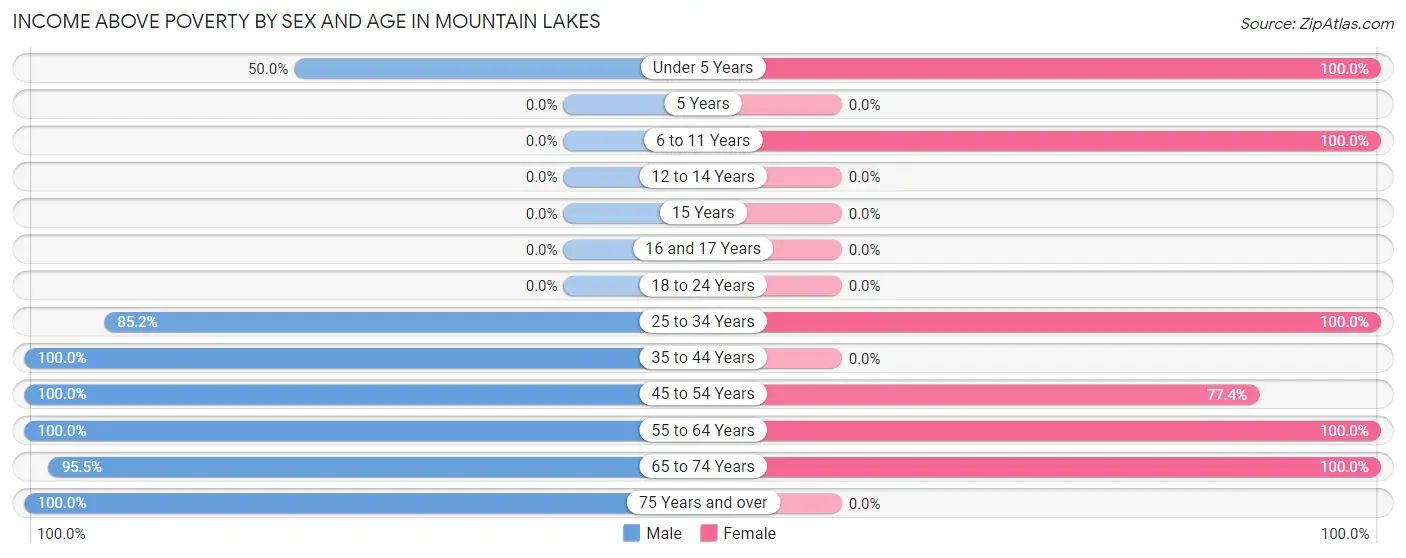
Income Above Poverty by Sex and Age in Mountain Lakes
According to the poverty statistics in Mountain Lakes, males aged 35 to 44 years and females aged under 5 years are the age groups that are most secure financially, with 100.0% of males and 100.0% of females in these age groups living above the poverty line.
| Age Bracket | Male | Female |
| Under 5 Years | 4 (50.0%) | 56 (100.0%) |
| 5 Years | 0 (0.0%) | 0 (0.0%) |
| 6 to 11 Years | 0 (0.0%) | 4 (100.0%) |
| 12 to 14 Years | 0 (0.0%) | 0 (0.0%) |
| 15 Years | 0 (0.0%) | 0 (0.0%) |
| 16 and 17 Years | 0 (0.0%) | 0 (0.0%) |
| 18 to 24 Years | 0 (0.0%) | 0 (0.0%) |
| 25 to 34 Years | 23 (85.2%) | 103 (100.0%) |
| 35 to 44 Years | 3 (100.0%) | 0 (0.0%) |
| 45 to 54 Years | 64 (100.0%) | 72 (77.4%) |
| 55 to 64 Years | 9 (100.0%) | 79 (100.0%) |
| 65 to 74 Years | 64 (95.5%) | 47 (100.0%) |
| 75 Years and over | 7 (100.0%) | 0 (0.0%) |
| Total | 174 (94.1%) | 361 (87.6%) |
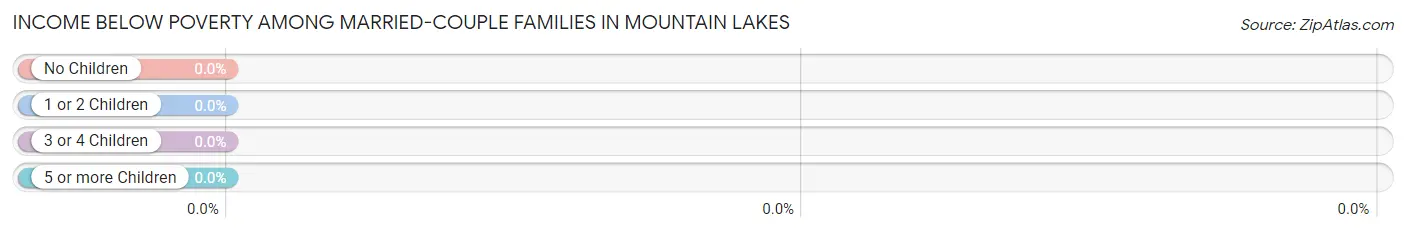
Income Below Poverty Among Married-Couple Families in Mountain Lakes
| Children | Above Poverty | Below Poverty |
| No Children | 133 (100.0%) | 0 (0.0%) |
| 1 or 2 Children | 0 (0.0%) | 0 (0.0%) |
| 3 or 4 Children | 0 (0.0%) | 0 (0.0%) |
| 5 or more Children | 0 (0.0%) | 0 (0.0%) |
| Total | 133 (100.0%) | 0 (0.0%) |
Income Below Poverty Among Single-Parent Households in Mountain Lakes
According to the poverty data in Mountain Lakes, 57.1% or 4 single-father households and 29.6% or 21 single-mother households are living below the poverty line. Among single-father households, those with 1 or 2 children have the highest poverty rate, with 4 households (57.1%) experiencing poverty. Likewise, among single-mother households, those with 1 or 2 children have the highest poverty rate, with 21 households (29.6%) falling below the poverty line.
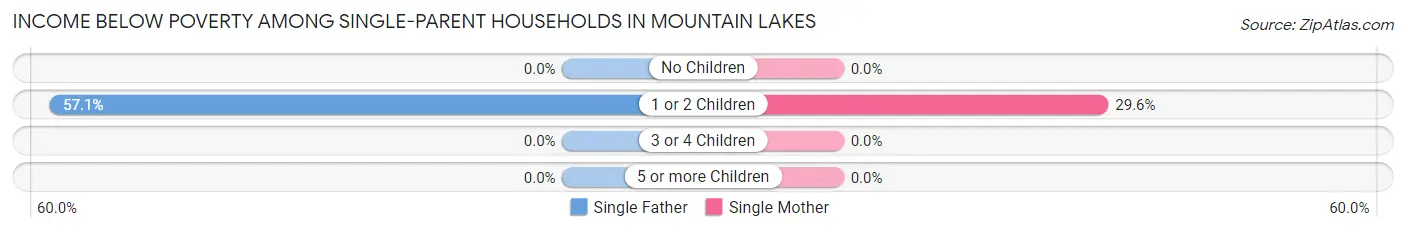
| Children | Single Father | Single Mother |
| No Children | 0 (0.0%) | 0 (0.0%) |
| 1 or 2 Children | 4 (57.1%) | 21 (29.6%) |
| 3 or 4 Children | 0 (0.0%) | 0 (0.0%) |
| 5 or more Children | 0 (0.0%) | 0 (0.0%) |
| Total | 4 (57.1%) | 21 (29.6%) |
Income Below Poverty Among Married-Couple vs Single-Parent Households in Mountain Lakes
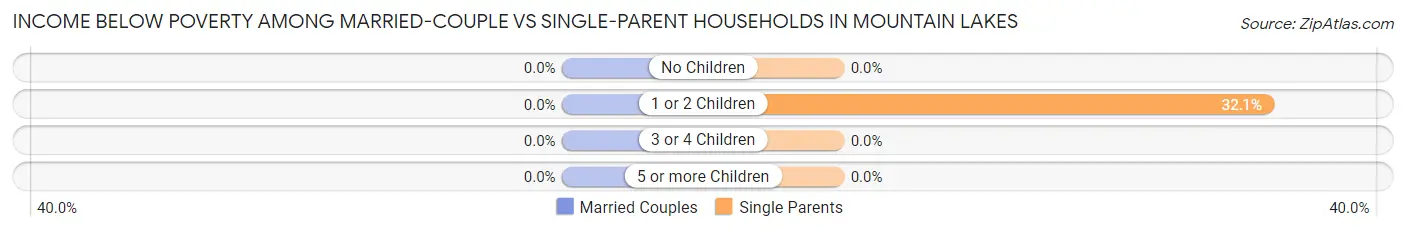
| Children | Married-Couple Families | Single-Parent Households |
| No Children | 0 (0.0%) | 0 (0.0%) |
| 1 or 2 Children | 0 (0.0%) | 25 (32.1%) |
| 3 or 4 Children | 0 (0.0%) | 0 (0.0%) |
| 5 or more Children | 0 (0.0%) | 0 (0.0%) |
| Total | 0 (0.0%) | 25 (32.1%) |
Race in Mountain Lakes
The most populous races in Mountain Lakes are White / Caucasian (536 | 89.8%), Two or more Races (34 | 5.7%), and Native / Alaskan (27 | 4.5%).
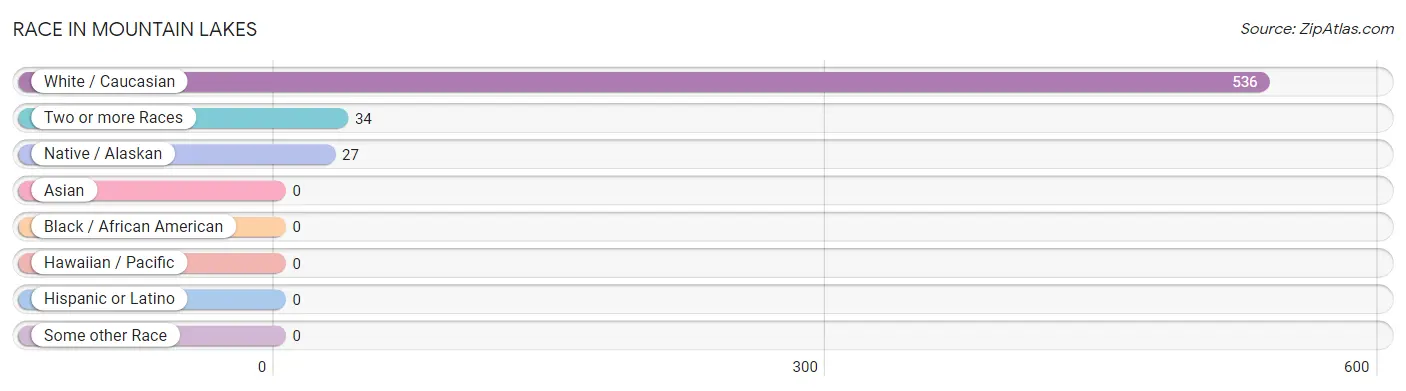
| Race | # Population | % Population |
| Asian | 0 | 0.0% |
| Black / African American | 0 | 0.0% |
| Hawaiian / Pacific | 0 | 0.0% |
| Hispanic or Latino | 0 | 0.0% |
| Native / Alaskan | 27 | 4.5% |
| White / Caucasian | 536 | 89.8% |
| Two or more Races | 34 | 5.7% |
| Some other Race | 0 | 0.0% |
| Total | 597 | 100.0% |
Ancestry in Mountain Lakes
The most populous ancestries reported in Mountain Lakes are French Canadian (218 | 36.5%), Irish (121 | 20.3%), English (100 | 16.8%), French (92 | 15.4%), and Portuguese (31 | 5.2%), together accounting for 94.1% of all Mountain Lakes residents.
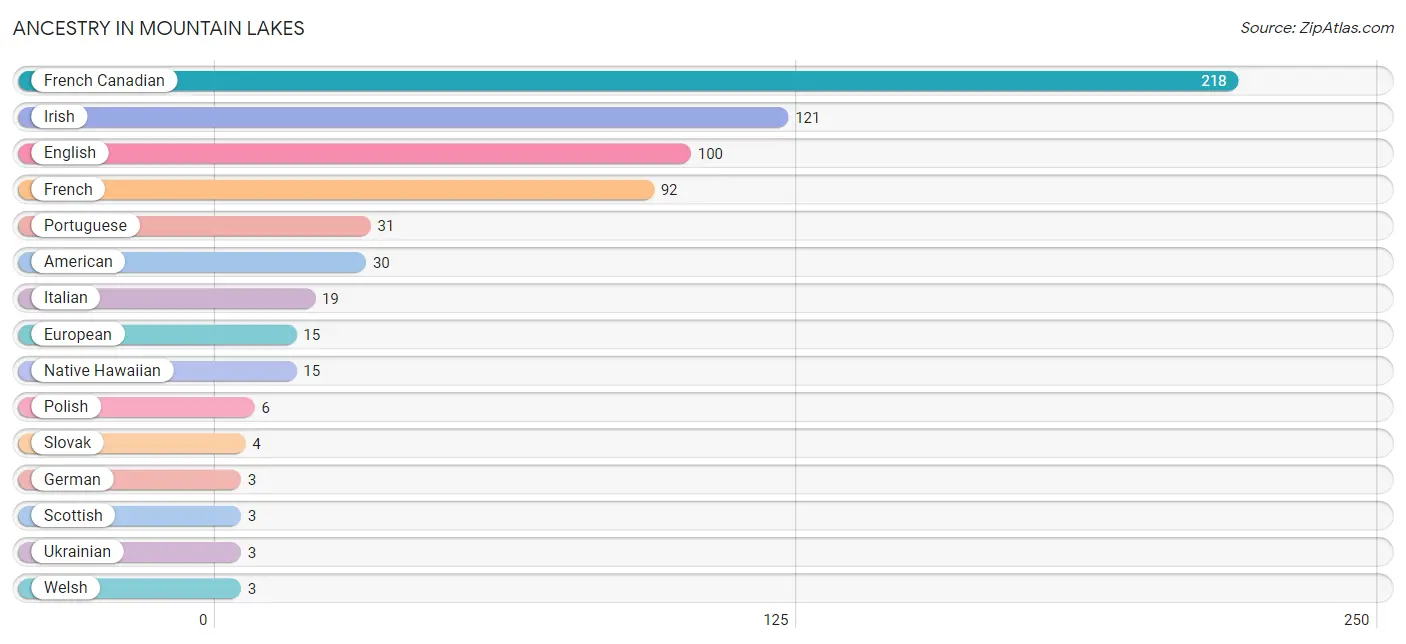
| Ancestry | # Population | % Population |
| American | 30 | 5.0% |
| English | 100 | 16.8% |
| European | 15 | 2.5% |
| French | 92 | 15.4% |
| French Canadian | 218 | 36.5% |
| German | 3 | 0.5% |
| Irish | 121 | 20.3% |
| Italian | 19 | 3.2% |
| Native Hawaiian | 15 | 2.5% |
| Polish | 6 | 1.0% |
| Portuguese | 31 | 5.2% |
| Scottish | 3 | 0.5% |
| Slovak | 4 | 0.7% |
| Ukrainian | 3 | 0.5% |
| Welsh | 3 | 0.5% | View All 15 Rows |
Immigrants in Mountain Lakes

| Immigration Origin | # Population | % Population | View All 0 Rows |
Sex and Age in Mountain Lakes
Sex and Age in Mountain Lakes
The most populous age groups in Mountain Lakes are 50 to 54 Years (64 | 34.6%) for men and 25 to 29 Years (99 | 24.0%) for women.
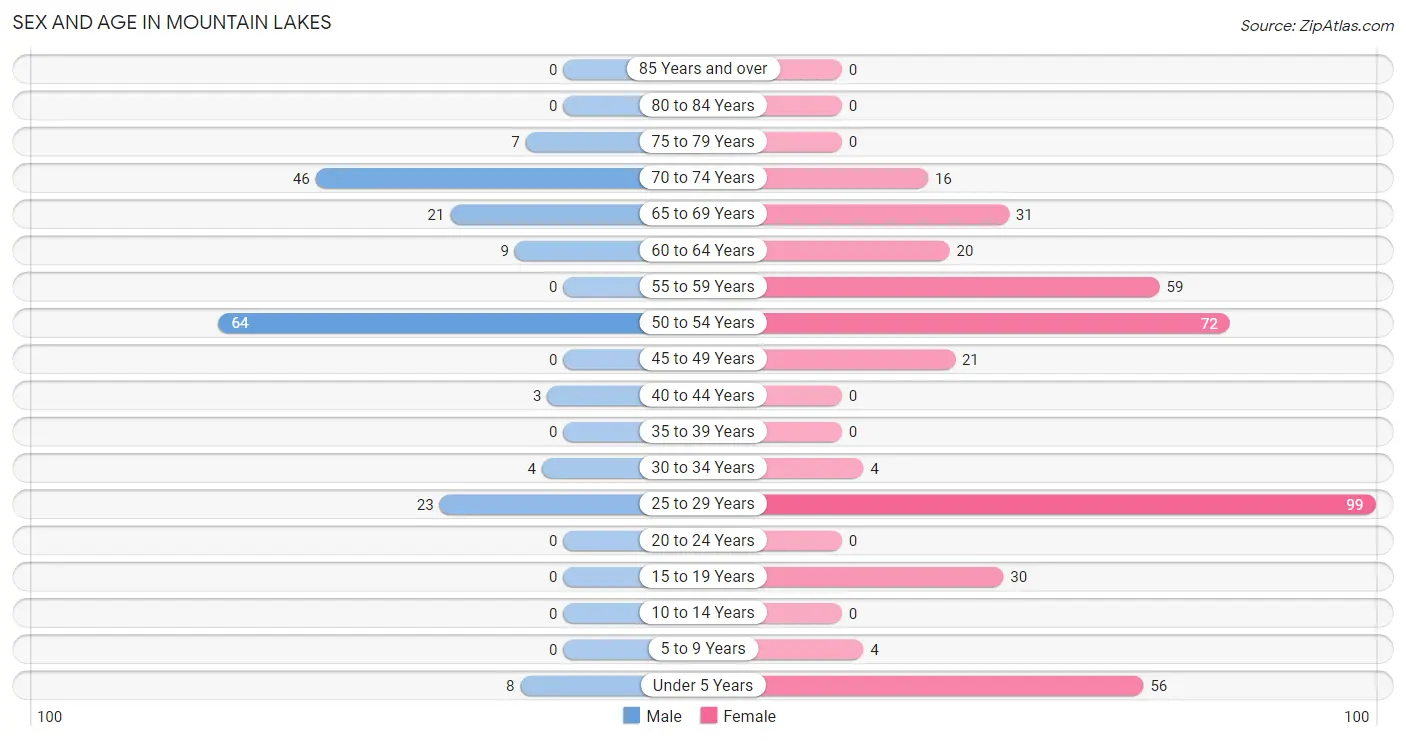
| Age Bracket | Male | Female |
| Under 5 Years | 8 (4.3%) | 56 (13.6%) |
| 5 to 9 Years | 0 (0.0%) | 4 (1.0%) |
| 10 to 14 Years | 0 (0.0%) | 0 (0.0%) |
| 15 to 19 Years | 0 (0.0%) | 30 (7.3%) |
| 20 to 24 Years | 0 (0.0%) | 0 (0.0%) |
| 25 to 29 Years | 23 (12.4%) | 99 (24.0%) |
| 30 to 34 Years | 4 (2.2%) | 4 (1.0%) |
| 35 to 39 Years | 0 (0.0%) | 0 (0.0%) |
| 40 to 44 Years | 3 (1.6%) | 0 (0.0%) |
| 45 to 49 Years | 0 (0.0%) | 21 (5.1%) |
| 50 to 54 Years | 64 (34.6%) | 72 (17.5%) |
| 55 to 59 Years | 0 (0.0%) | 59 (14.3%) |
| 60 to 64 Years | 9 (4.9%) | 20 (4.9%) |
| 65 to 69 Years | 21 (11.4%) | 31 (7.5%) |
| 70 to 74 Years | 46 (24.9%) | 16 (3.9%) |
| 75 to 79 Years | 7 (3.8%) | 0 (0.0%) |
| 80 to 84 Years | 0 (0.0%) | 0 (0.0%) |
| 85 Years and over | 0 (0.0%) | 0 (0.0%) |
| Total | 185 (100.0%) | 412 (100.0%) |
Families and Households in Mountain Lakes
Median Family Size in Mountain Lakes
The median family size in Mountain Lakes is 2.51 persons per family, with single female/mother families (71 | 33.7%) accounting for the largest median family size of 3.49 persons per family. On the other hand, married-couple families (133 | 63.0%) represent the smallest median family size with 1.97 persons per family.
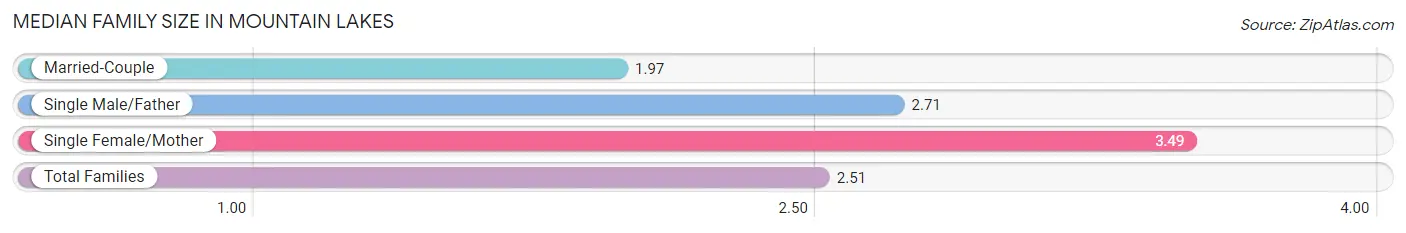
| Family Type | # Families | Family Size |
| Married-Couple | 133 (63.0%) | 1.97 |
| Single Male/Father | 7 (3.3%) | 2.71 |
| Single Female/Mother | 71 (33.7%) | 3.49 |
| Total Families | 211 (100.0%) | 2.51 |
Median Household Size in Mountain Lakes
The median household size in Mountain Lakes is 2.50 persons per household, with single male/father households (7 | 2.9%) accounting for the largest median household size of 3.71 persons per household. non-family households (28 | 11.7%) represent the smallest median household size with 1.50 persons per household.
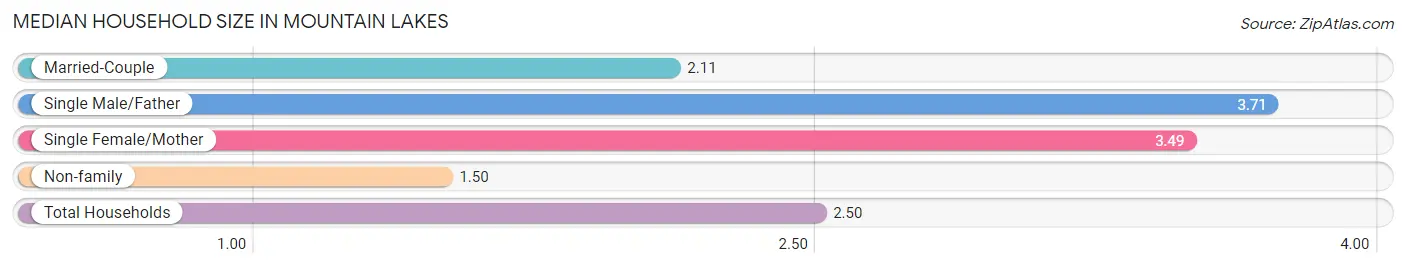
| Household Type | # Households | Household Size |
| Married-Couple | 133 (55.6%) | 2.11 |
| Single Male/Father | 7 (2.9%) | 3.71 |
| Single Female/Mother | 71 (29.7%) | 3.49 |
| Non-family | 28 (11.7%) | 1.50 |
| Total Households | 239 (100.0%) | 2.50 |
Household Size by Marriage Status in Mountain Lakes
Out of a total of 239 households in Mountain Lakes, 211 (88.3%) are family households, while 28 (11.7%) are nonfamily households. The most numerous type of family households are 2-person households, comprising 144, and the most common type of nonfamily households are 1-person households, comprising 16.
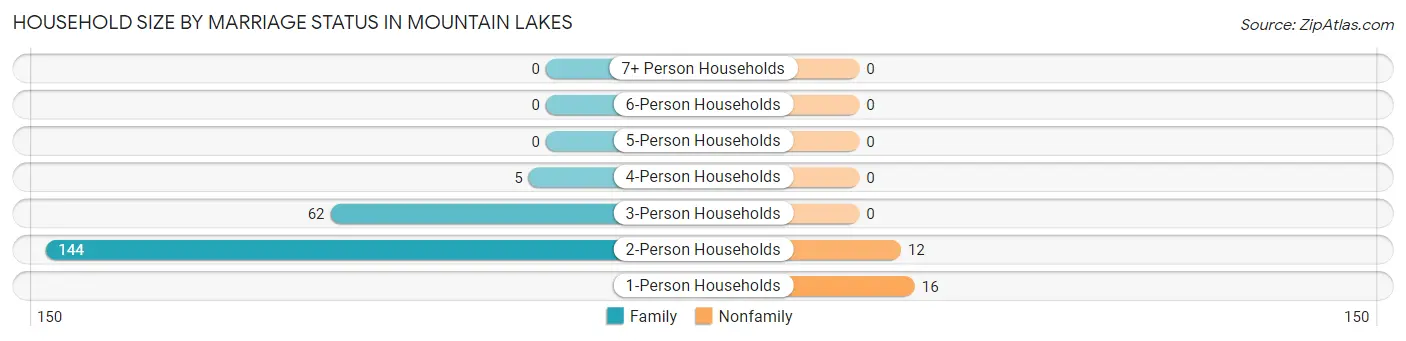
| Household Size | Family Households | Nonfamily Households |
| 1-Person Households | - | 16 (6.7%) |
| 2-Person Households | 144 (60.3%) | 12 (5.0%) |
| 3-Person Households | 62 (25.9%) | 0 (0.0%) |
| 4-Person Households | 5 (2.1%) | 0 (0.0%) |
| 5-Person Households | 0 (0.0%) | 0 (0.0%) |
| 6-Person Households | 0 (0.0%) | 0 (0.0%) |
| 7+ Person Households | 0 (0.0%) | 0 (0.0%) |
| Total | 211 (88.3%) | 28 (11.7%) |
Female Fertility in Mountain Lakes
Fertility by Age in Mountain Lakes
| Age Bracket | Women with Births | Births / 1,000 Women |
| 15 to 19 years | 0 (0.0%) | 0.0 |
| 20 to 34 years | 0 (0.0%) | 0.0 |
| 35 to 50 years | 0 (0.0%) | 0.0 |
| Total | 0 (0.0%) | 0.0 |
Fertility by Age by Marriage Status in Mountain Lakes
| Age Bracket | Married | Unmarried |
| 15 to 19 years | 0 (0.0%) | 0 (0.0%) |
| 20 to 34 years | 0 (0.0%) | 0 (0.0%) |
| 35 to 50 years | 0 (0.0%) | 0 (0.0%) |
| Total | 0 (0.0%) | 0 (0.0%) |
Fertility by Education in Mountain Lakes
| Educational Attainment | Women with Births | Births / 1,000 Women |
| Less than High School | 0 (0.0%) | 0.0 |
| High School Diploma | 0 (0.0%) | 0.0 |
| College or Associate's Degree | 0 (0.0%) | 0.0 |
| Bachelor's Degree | 0 (0.0%) | 0.0 |
| Graduate Degree | 0 (0.0%) | 0.0 |
| Total | 0 (0.0%) | 0.0 |
Fertility by Education by Marriage Status in Mountain Lakes
| Educational Attainment | Married | Unmarried |
| Less than High School | 0 (0.0%) | 0 (0.0%) |
| High School Diploma | 0 (0.0%) | 0 (0.0%) |
| College or Associate's Degree | 0 (0.0%) | 0 (0.0%) |
| Bachelor's Degree | 0 (0.0%) | 0 (0.0%) |
| Graduate Degree | 0 (0.0%) | 0 (0.0%) |
| Total | 0 (0.0%) | 0 (0.0%) |
Employment Characteristics in Mountain Lakes
Employment by Class of Employer in Mountain Lakes
Among the 296 employed individuals in Mountain Lakes, private company employees (190 | 64.2%), state government employees (57 | 19.3%), and self-employed (not incorporated) (41 | 13.9%) make up the most common classes of employment.
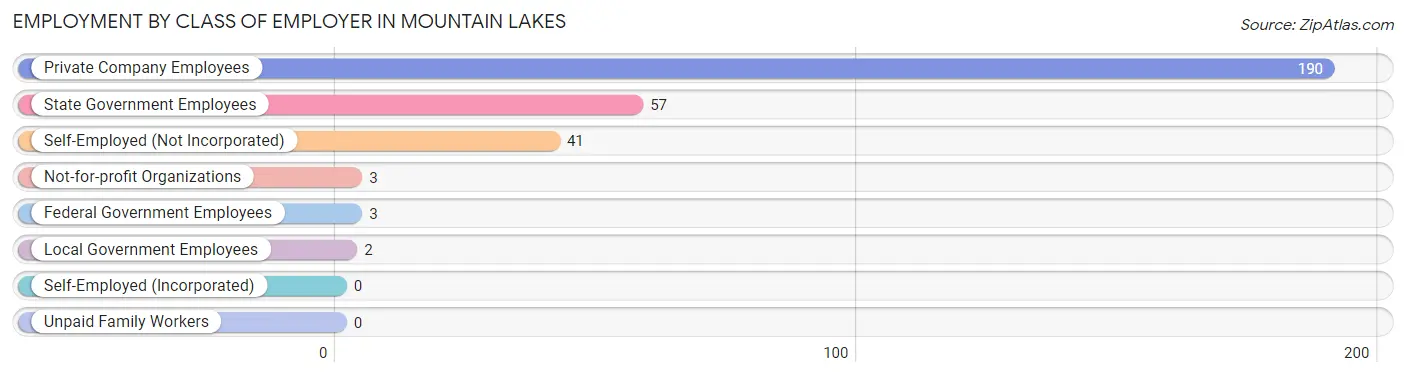
| Employer Class | # Employees | % Employees |
| Private Company Employees | 190 | 64.2% |
| Self-Employed (Incorporated) | 0 | 0.0% |
| Self-Employed (Not Incorporated) | 41 | 13.9% |
| Not-for-profit Organizations | 3 | 1.0% |
| Local Government Employees | 2 | 0.7% |
| State Government Employees | 57 | 19.3% |
| Federal Government Employees | 3 | 1.0% |
| Unpaid Family Workers | 0 | 0.0% |
| Total | 296 | 100.0% |
Employment Status by Age in Mountain Lakes
According to the labor force statistics for Mountain Lakes, out of the total population over 16 years of age (529), 56.7% or 300 individuals are in the labor force, with 1.3% or 4 of them unemployed. The age group with the highest labor force participation rate is 25 to 29 years, with 100.0% or 122 individuals in the labor force. Within the labor force, the 30 to 34 years age range has the highest percentage of unemployed individuals, with 50.0% or 4 of them being unemployed.
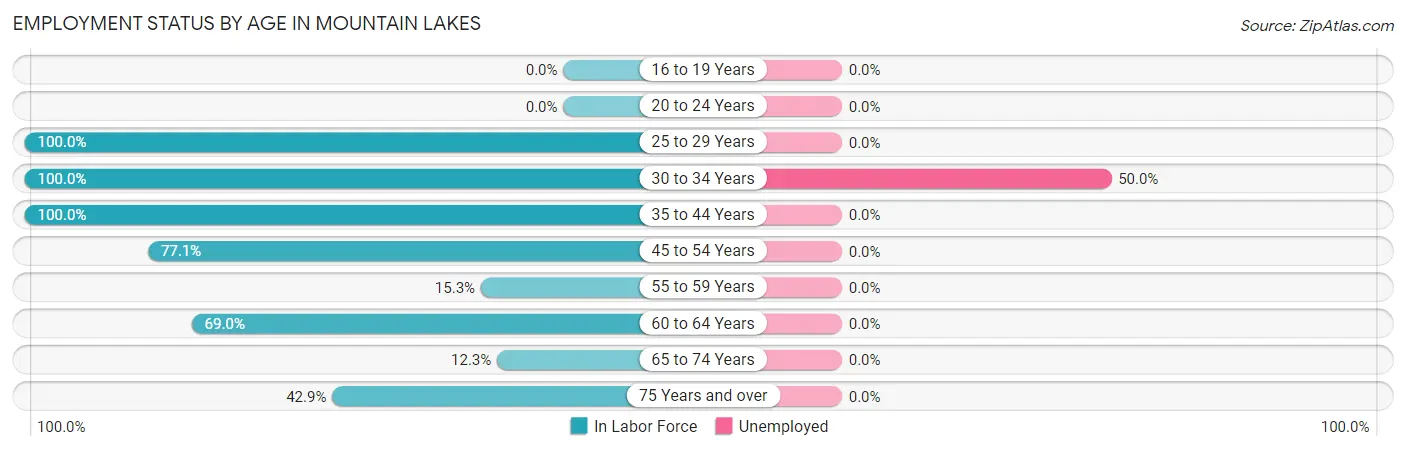
| Age Bracket | In Labor Force | Unemployed |
| 16 to 19 Years | 0 (0.0%) | 0 (0.0%) |
| 20 to 24 Years | 0 (0.0%) | 0 (0.0%) |
| 25 to 29 Years | 122 (100.0%) | 0 (0.0%) |
| 30 to 34 Years | 8 (100.0%) | 4 (50.0%) |
| 35 to 44 Years | 3 (100.0%) | 0 (0.0%) |
| 45 to 54 Years | 121 (77.1%) | 0 (0.0%) |
| 55 to 59 Years | 9 (15.3%) | 0 (0.0%) |
| 60 to 64 Years | 20 (69.0%) | 0 (0.0%) |
| 65 to 74 Years | 14 (12.3%) | 0 (0.0%) |
| 75 Years and over | 3 (42.9%) | 0 (0.0%) |
| Total | 300 (56.7%) | 4 (1.3%) |
Employment Status by Educational Attainment in Mountain Lakes
According to labor force statistics for Mountain Lakes, 74.9% of individuals (283) out of the total population between 25 and 64 years of age (378) are in the labor force, with 1.4% or 4 of them being unemployed. The group with the highest labor force participation rate are those with the educational attainment of less than high school, with 100.0% or 19 individuals in the labor force. Within the labor force, individuals with high school diploma education have the highest percentage of unemployment, with 4.4% or 4 of them being unemployed.
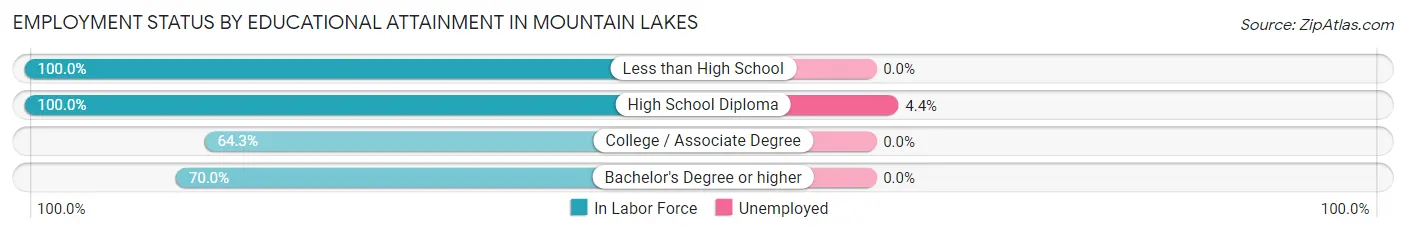
| Educational Attainment | In Labor Force | Unemployed |
| Less than High School | 19 (100.0%) | 0 (0.0%) |
| High School Diploma | 90 (100.0%) | 4 (4.4%) |
| College / Associate Degree | 160 (64.3%) | 0 (0.0%) |
| Bachelor's Degree or higher | 14 (70.0%) | 0 (0.0%) |
| Total | 283 (74.9%) | 5 (1.4%) |
Employment Occupations by Sex in Mountain Lakes
Management, Business, Science and Arts Occupations
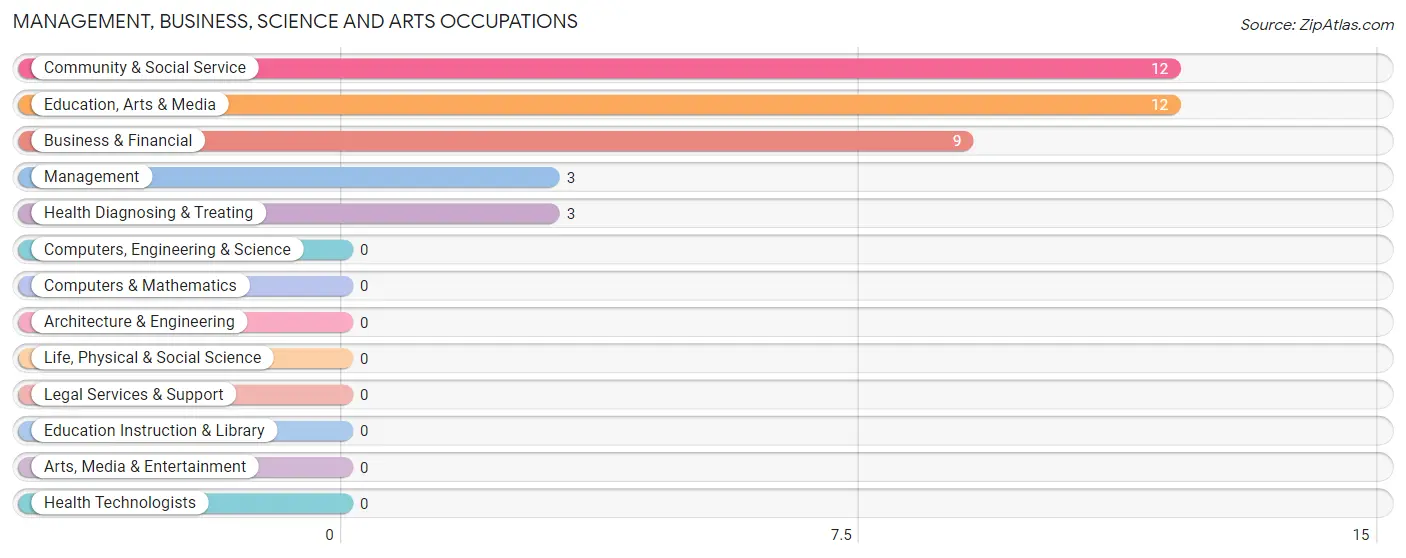
The most common Management, Business, Science and Arts occupations in Mountain Lakes are Community & Social Service (12 | 4.1%), Education, Arts & Media (12 | 4.1%), Business & Financial (9 | 3.0%), Management (3 | 1.0%), and Health Diagnosing & Treating (3 | 1.0%).
Management, Business, Science and Arts Occupations by Sex
Within the Management, Business, Science and Arts occupations in Mountain Lakes, the most male-oriented occupations are Business & Financial (77.8%), Community & Social Service (25.0%), and Education, Arts & Media (25.0%), while the most female-oriented occupations are Management (100.0%), Health Diagnosing & Treating (100.0%), and Community & Social Service (75.0%).
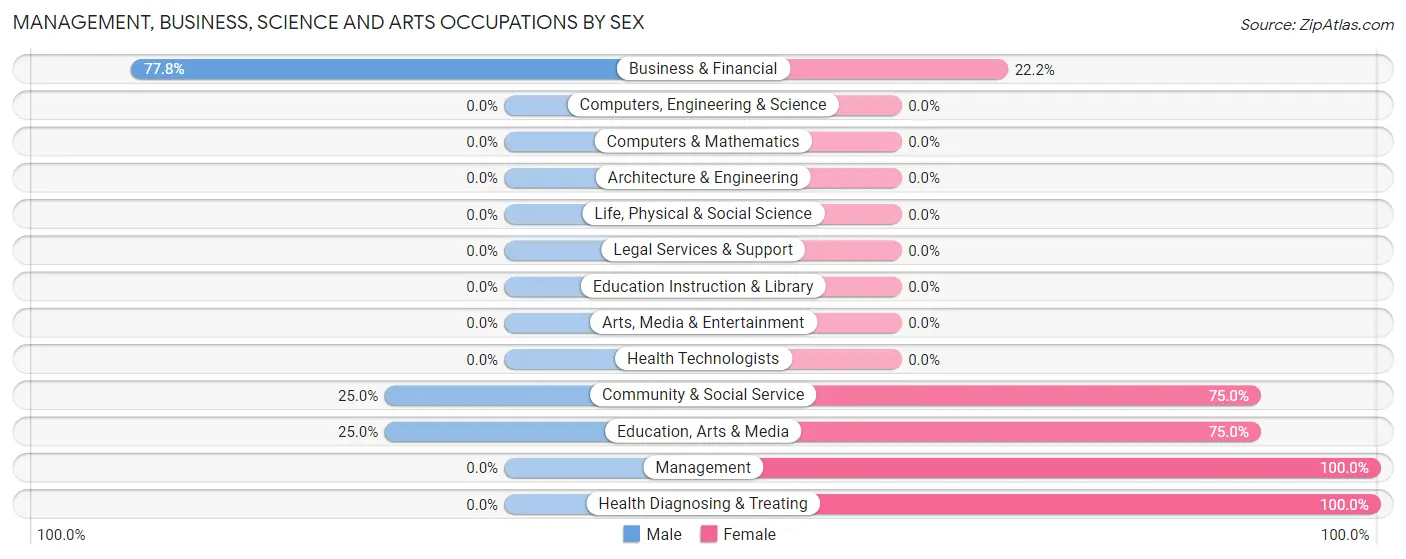
| Occupation | Male | Female |
| Management | 0 (0.0%) | 3 (100.0%) |
| Business & Financial | 7 (77.8%) | 2 (22.2%) |
| Computers, Engineering & Science | 0 (0.0%) | 0 (0.0%) |
| Computers & Mathematics | 0 (0.0%) | 0 (0.0%) |
| Architecture & Engineering | 0 (0.0%) | 0 (0.0%) |
| Life, Physical & Social Science | 0 (0.0%) | 0 (0.0%) |
| Community & Social Service | 3 (25.0%) | 9 (75.0%) |
| Education, Arts & Media | 3 (25.0%) | 9 (75.0%) |
| Legal Services & Support | 0 (0.0%) | 0 (0.0%) |
| Education Instruction & Library | 0 (0.0%) | 0 (0.0%) |
| Arts, Media & Entertainment | 0 (0.0%) | 0 (0.0%) |
| Health Diagnosing & Treating | 0 (0.0%) | 3 (100.0%) |
| Health Technologists | 0 (0.0%) | 0 (0.0%) |
| Total (Category) | 10 (37.0%) | 17 (63.0%) |
| Total (Overall) | 110 (37.2%) | 186 (62.8%) |
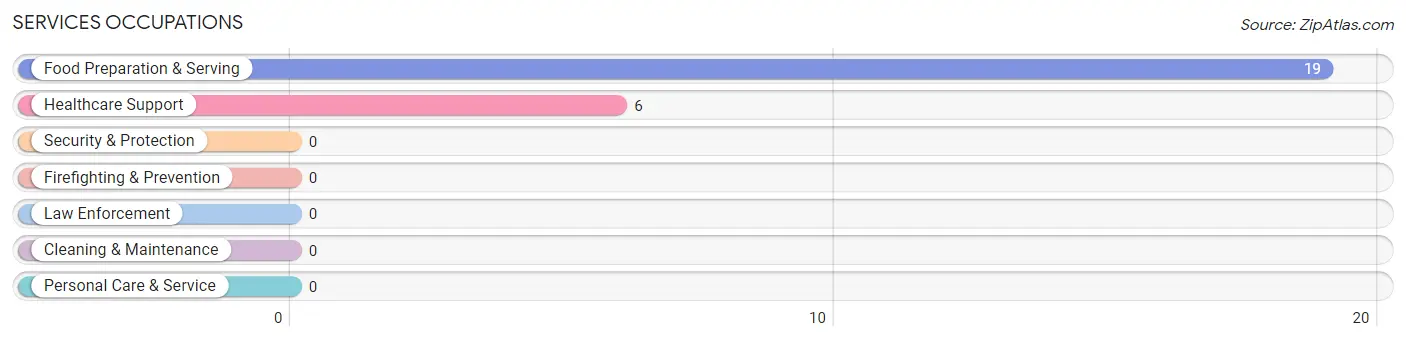
Services Occupations
The most common Services occupations in Mountain Lakes are Food Preparation & Serving (19 | 6.4%), and Healthcare Support (6 | 2.0%).
Services Occupations by Sex
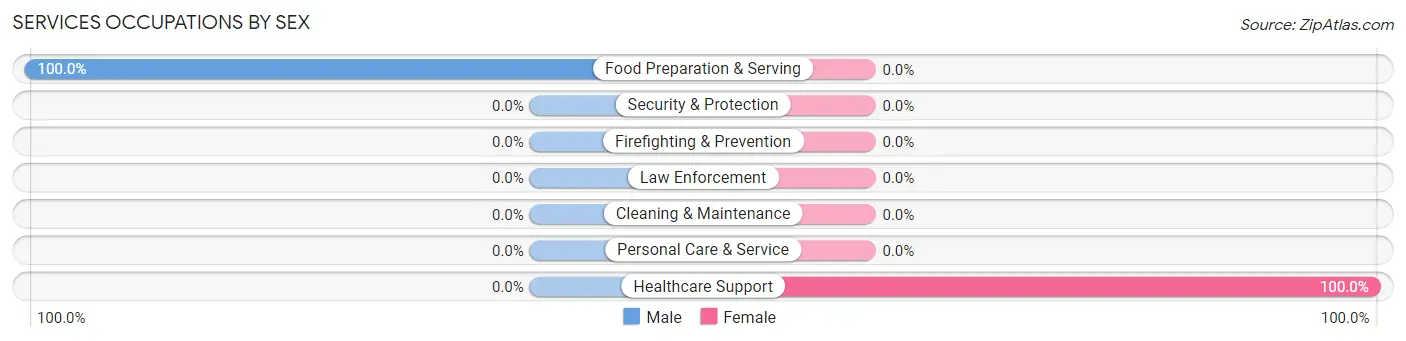
| Occupation | Male | Female |
| Healthcare Support | 0 (0.0%) | 6 (100.0%) |
| Security & Protection | 0 (0.0%) | 0 (0.0%) |
| Firefighting & Prevention | 0 (0.0%) | 0 (0.0%) |
| Law Enforcement | 0 (0.0%) | 0 (0.0%) |
| Food Preparation & Serving | 19 (100.0%) | 0 (0.0%) |
| Cleaning & Maintenance | 0 (0.0%) | 0 (0.0%) |
| Personal Care & Service | 0 (0.0%) | 0 (0.0%) |
| Total (Category) | 19 (76.0%) | 6 (24.0%) |
| Total (Overall) | 110 (37.2%) | 186 (62.8%) |
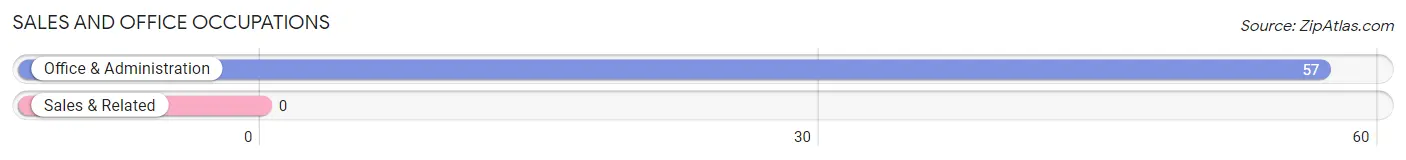
Sales and Office Occupations
The most common Sales and Office occupations in Mountain Lakes are , and Office & Administration (57 | 19.3%).
Sales and Office Occupations by Sex
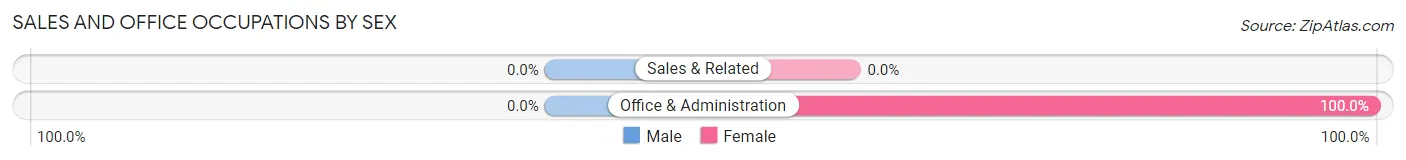
| Occupation | Male | Female |
| Sales & Related | 0 (0.0%) | 0 (0.0%) |
| Office & Administration | 0 (0.0%) | 57 (100.0%) |
| Total (Category) | 0 (0.0%) | 57 (100.0%) |
| Total (Overall) | 110 (37.2%) | 186 (62.8%) |
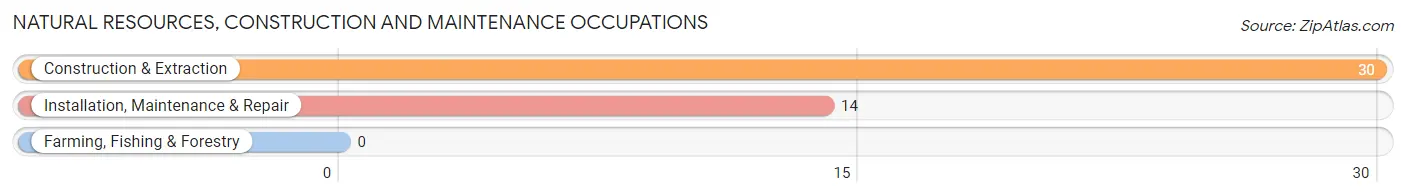
Natural Resources, Construction and Maintenance Occupations
The most common Natural Resources, Construction and Maintenance occupations in Mountain Lakes are Construction & Extraction (30 | 10.1%), and Installation, Maintenance & Repair (14 | 4.7%).
Natural Resources, Construction and Maintenance Occupations by Sex
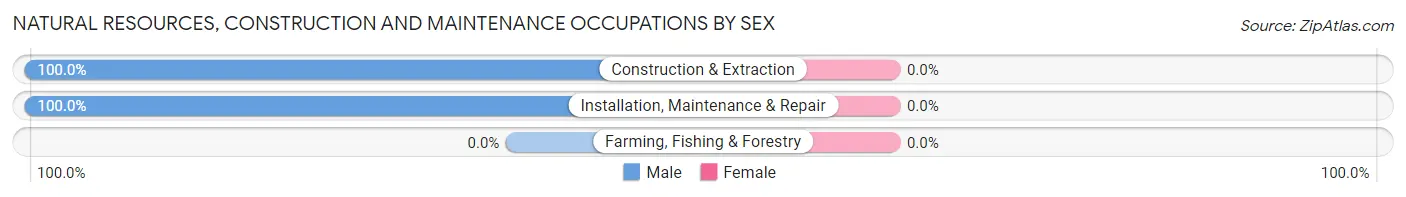
| Occupation | Male | Female |
| Farming, Fishing & Forestry | 0 (0.0%) | 0 (0.0%) |
| Construction & Extraction | 30 (100.0%) | 0 (0.0%) |
| Installation, Maintenance & Repair | 14 (100.0%) | 0 (0.0%) |
| Total (Category) | 44 (100.0%) | 0 (0.0%) |
| Total (Overall) | 110 (37.2%) | 186 (62.8%) |
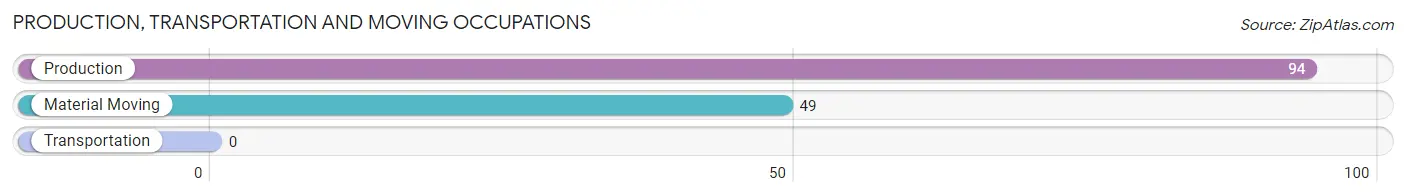
Production, Transportation and Moving Occupations
The most common Production, Transportation and Moving occupations in Mountain Lakes are Production (94 | 31.8%), and Material Moving (49 | 16.6%).
Production, Transportation and Moving Occupations by Sex
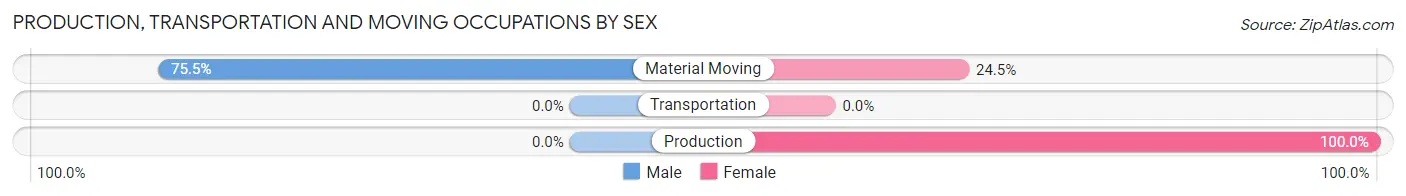
| Occupation | Male | Female |
| Production | 0 (0.0%) | 94 (100.0%) |
| Transportation | 0 (0.0%) | 0 (0.0%) |
| Material Moving | 37 (75.5%) | 12 (24.5%) |
| Total (Category) | 37 (25.9%) | 106 (74.1%) |
| Total (Overall) | 110 (37.2%) | 186 (62.8%) |
Employment Industries by Sex in Mountain Lakes
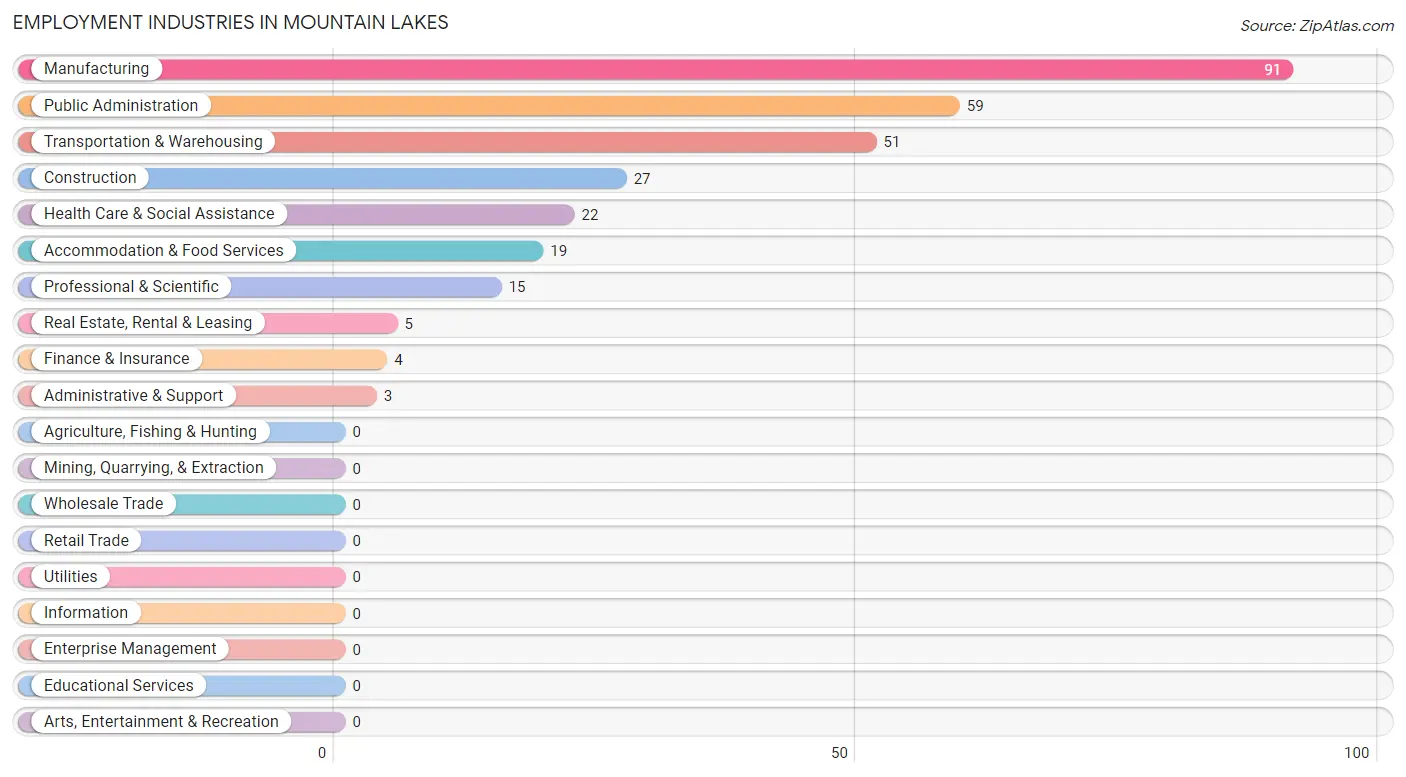
Employment Industries in Mountain Lakes
The major employment industries in Mountain Lakes include Manufacturing (91 | 30.7%), Public Administration (59 | 19.9%), Transportation & Warehousing (51 | 17.2%), Construction (27 | 9.1%), and Health Care & Social Assistance (22 | 7.4%).
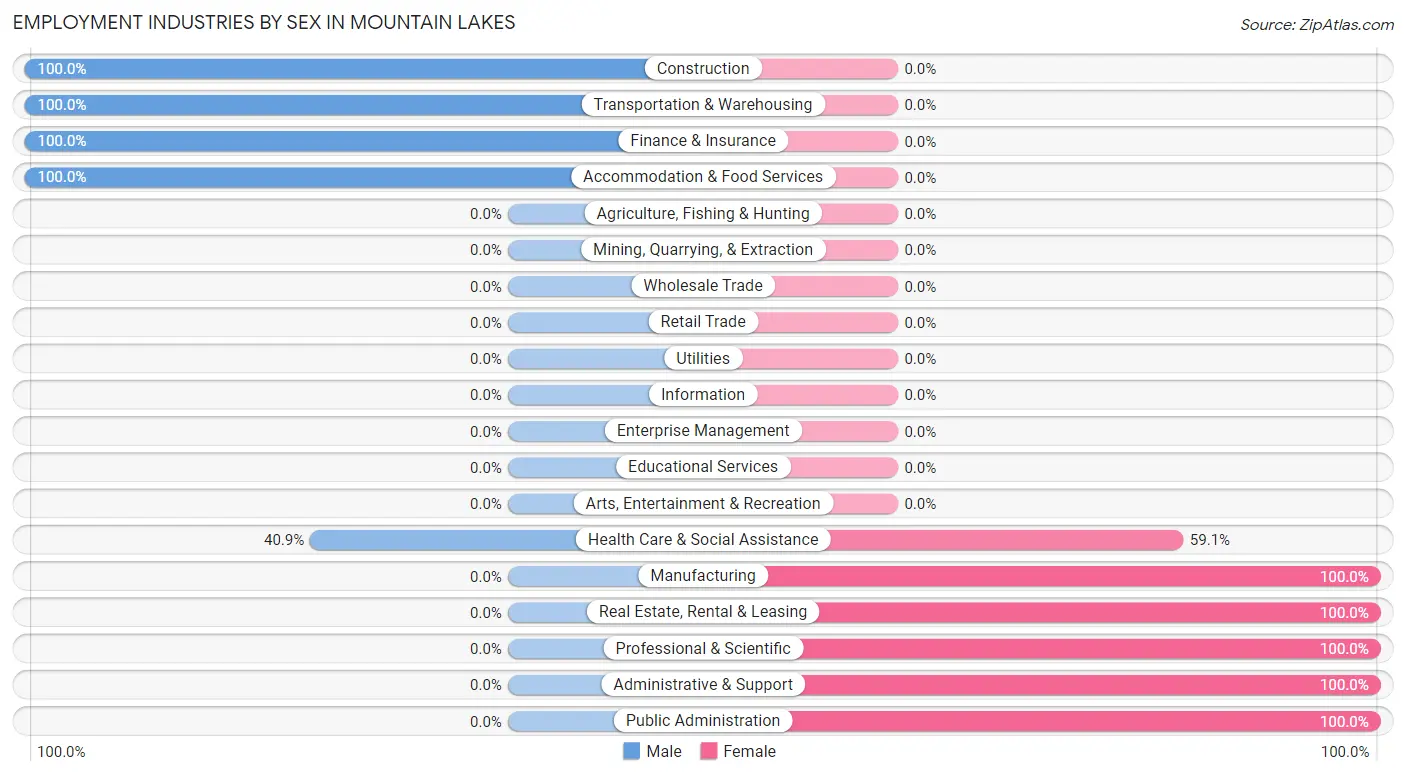
Employment Industries by Sex in Mountain Lakes
The Mountain Lakes industries that see more men than women are Construction (100.0%), Transportation & Warehousing (100.0%), and Finance & Insurance (100.0%), whereas the industries that tend to have a higher number of women are Manufacturing (100.0%), Real Estate, Rental & Leasing (100.0%), and Professional & Scientific (100.0%).
| Industry | Male | Female |
| Agriculture, Fishing & Hunting | 0 (0.0%) | 0 (0.0%) |
| Mining, Quarrying, & Extraction | 0 (0.0%) | 0 (0.0%) |
| Construction | 27 (100.0%) | 0 (0.0%) |
| Manufacturing | 0 (0.0%) | 91 (100.0%) |
| Wholesale Trade | 0 (0.0%) | 0 (0.0%) |
| Retail Trade | 0 (0.0%) | 0 (0.0%) |
| Transportation & Warehousing | 51 (100.0%) | 0 (0.0%) |
| Utilities | 0 (0.0%) | 0 (0.0%) |
| Information | 0 (0.0%) | 0 (0.0%) |
| Finance & Insurance | 4 (100.0%) | 0 (0.0%) |
| Real Estate, Rental & Leasing | 0 (0.0%) | 5 (100.0%) |
| Professional & Scientific | 0 (0.0%) | 15 (100.0%) |
| Enterprise Management | 0 (0.0%) | 0 (0.0%) |
| Administrative & Support | 0 (0.0%) | 3 (100.0%) |
| Educational Services | 0 (0.0%) | 0 (0.0%) |
| Health Care & Social Assistance | 9 (40.9%) | 13 (59.1%) |
| Arts, Entertainment & Recreation | 0 (0.0%) | 0 (0.0%) |
| Accommodation & Food Services | 19 (100.0%) | 0 (0.0%) |
| Public Administration | 0 (0.0%) | 59 (100.0%) |
| Total | 110 (37.2%) | 186 (62.8%) |
Education in Mountain Lakes
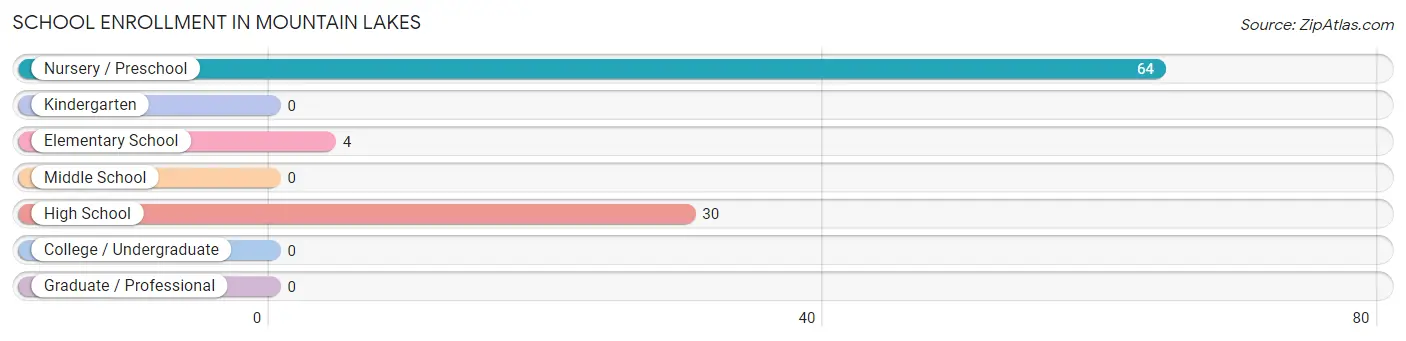
School Enrollment in Mountain Lakes
The most common levels of schooling among the 98 students in Mountain Lakes are nursery / preschool (64 | 65.3%), high school (30 | 30.6%), and elementary school (4 | 4.1%).
| School Level | # Students | % Students |
| Nursery / Preschool | 64 | 65.3% |
| Kindergarten | 0 | 0.0% |
| Elementary School | 4 | 4.1% |
| Middle School | 0 | 0.0% |
| High School | 30 | 30.6% |
| College / Undergraduate | 0 | 0.0% |
| Graduate / Professional | 0 | 0.0% |
| Total | 98 | 100.0% |
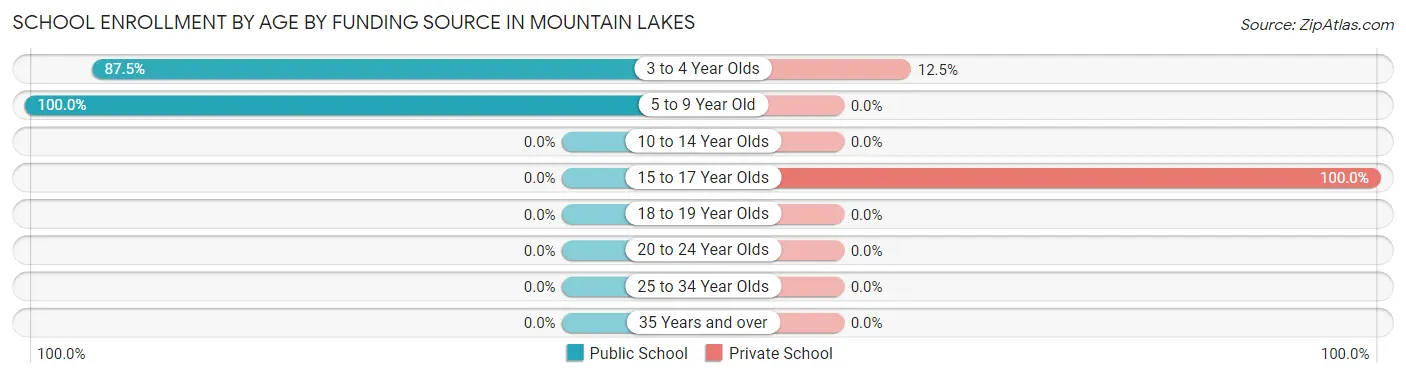
School Enrollment by Age by Funding Source in Mountain Lakes
Out of a total of 98 students who are enrolled in schools in Mountain Lakes, 38 (38.8%) attend a private institution, while the remaining 60 (61.2%) are enrolled in public schools. The age group of 15 to 17 year olds has the highest likelihood of being enrolled in private schools, with 30 (100.0% in the age bracket) enrolled. Conversely, the age group of 5 to 9 year old has the lowest likelihood of being enrolled in a private school, with 4 (100.0% in the age bracket) attending a public institution.
| Age Bracket | Public School | Private School |
| 3 to 4 Year Olds | 56 (87.5%) | 8 (12.5%) |
| 5 to 9 Year Old | 4 (100.0%) | 0 (0.0%) |
| 10 to 14 Year Olds | 0 (0.0%) | 0 (0.0%) |
| 15 to 17 Year Olds | 0 (0.0%) | 30 (100.0%) |
| 18 to 19 Year Olds | 0 (0.0%) | 0 (0.0%) |
| 20 to 24 Year Olds | 0 (0.0%) | 0 (0.0%) |
| 25 to 34 Year Olds | 0 (0.0%) | 0 (0.0%) |
| 35 Years and over | 0 (0.0%) | 0 (0.0%) |
| Total | 60 (61.2%) | 38 (38.8%) |
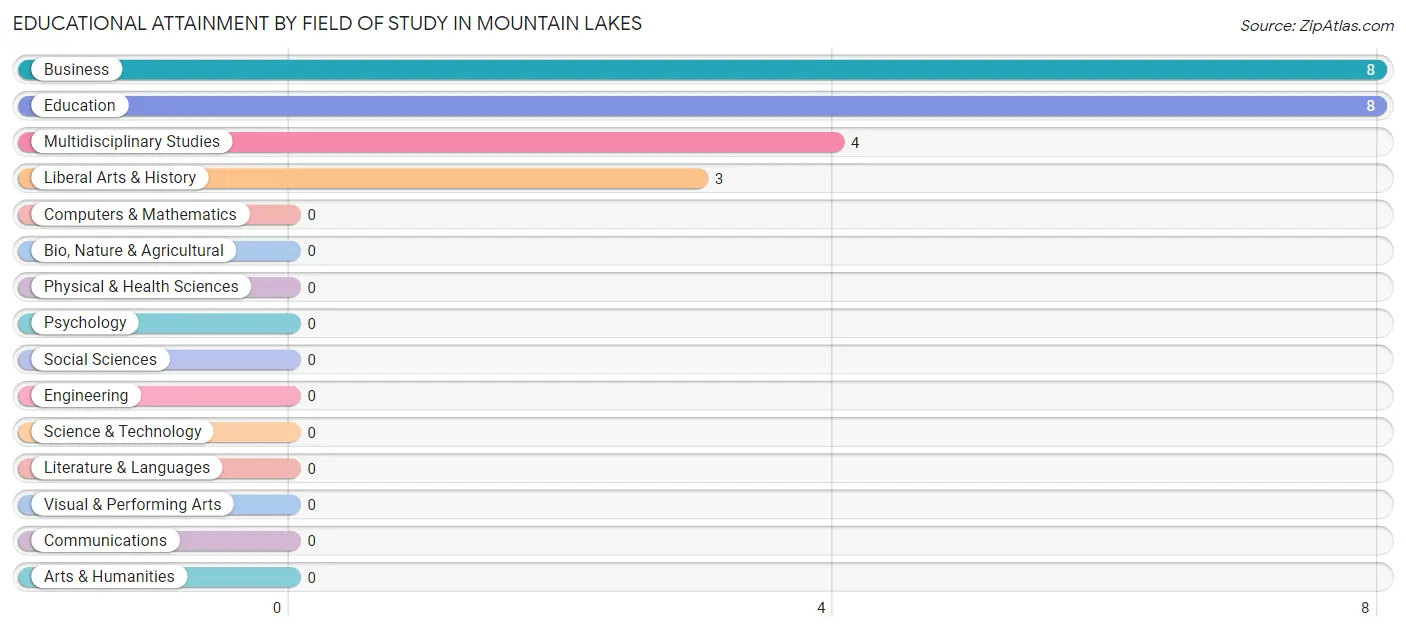
Educational Attainment by Field of Study in Mountain Lakes
Business (8 | 34.8%), education (8 | 34.8%), multidisciplinary studies (4 | 17.4%), and liberal arts & history (3 | 13.0%) are the most common fields of study among 23 individuals in Mountain Lakes who have obtained a bachelor's degree or higher.
| Field of Study | # Graduates | % Graduates |
| Computers & Mathematics | 0 | 0.0% |
| Bio, Nature & Agricultural | 0 | 0.0% |
| Physical & Health Sciences | 0 | 0.0% |
| Psychology | 0 | 0.0% |
| Social Sciences | 0 | 0.0% |
| Engineering | 0 | 0.0% |
| Multidisciplinary Studies | 4 | 17.4% |
| Science & Technology | 0 | 0.0% |
| Business | 8 | 34.8% |
| Education | 8 | 34.8% |
| Literature & Languages | 0 | 0.0% |
| Liberal Arts & History | 3 | 13.0% |
| Visual & Performing Arts | 0 | 0.0% |
| Communications | 0 | 0.0% |
| Arts & Humanities | 0 | 0.0% |
| Total | 23 | 100.0% |
Transportation & Commute in Mountain Lakes
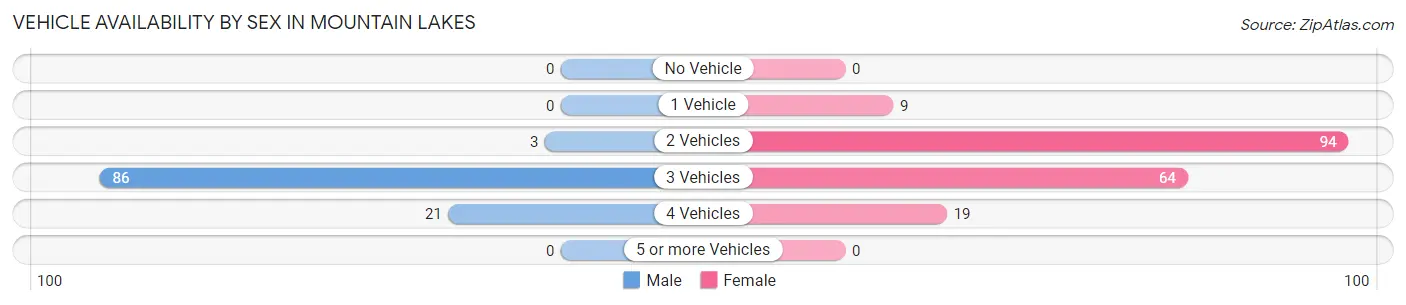
Vehicle Availability by Sex in Mountain Lakes
The most prevalent vehicle ownership categories in Mountain Lakes are males with 3 vehicles (86, accounting for 78.2%) and females with 3 vehicles (64, making up 46.2%).
| Vehicles Available | Male | Female |
| No Vehicle | 0 (0.0%) | 0 (0.0%) |
| 1 Vehicle | 0 (0.0%) | 9 (4.8%) |
| 2 Vehicles | 3 (2.7%) | 94 (50.5%) |
| 3 Vehicles | 86 (78.2%) | 64 (34.4%) |
| 4 Vehicles | 21 (19.1%) | 19 (10.2%) |
| 5 or more Vehicles | 0 (0.0%) | 0 (0.0%) |
| Total | 110 (100.0%) | 186 (100.0%) |
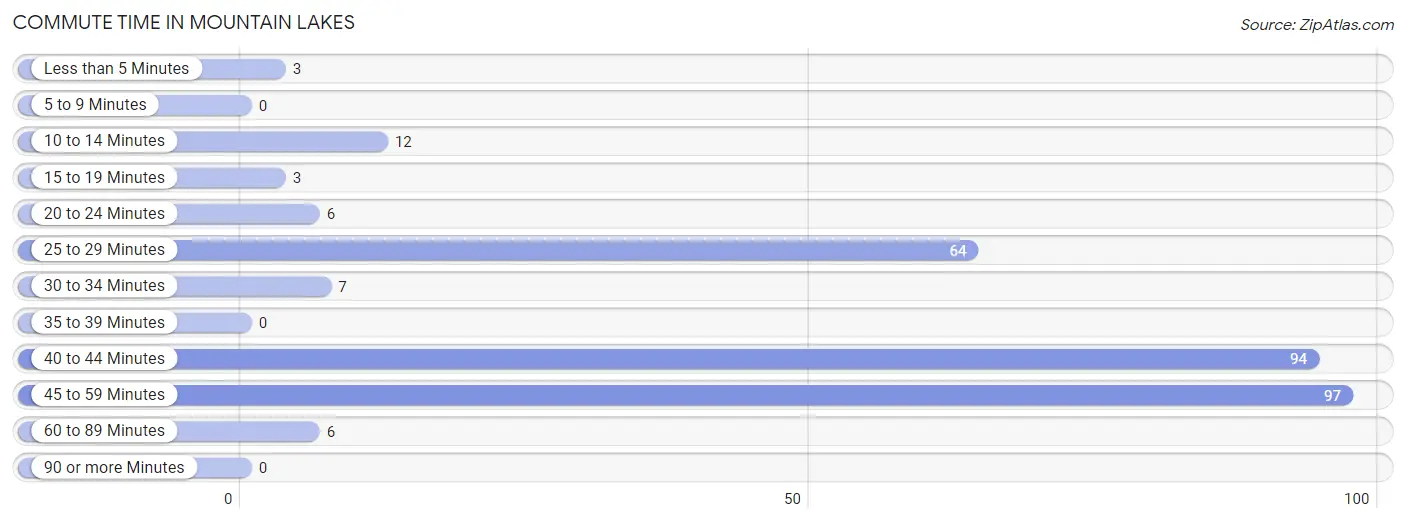
Commute Time in Mountain Lakes
The most frequently occuring commute durations in Mountain Lakes are 45 to 59 minutes (97 commuters, 33.2%), 40 to 44 minutes (94 commuters, 32.2%), and 25 to 29 minutes (64 commuters, 21.9%).
| Commute Time | # Commuters | % Commuters |
| Less than 5 Minutes | 3 | 1.0% |
| 5 to 9 Minutes | 0 | 0.0% |
| 10 to 14 Minutes | 12 | 4.1% |
| 15 to 19 Minutes | 3 | 1.0% |
| 20 to 24 Minutes | 6 | 2.1% |
| 25 to 29 Minutes | 64 | 21.9% |
| 30 to 34 Minutes | 7 | 2.4% |
| 35 to 39 Minutes | 0 | 0.0% |
| 40 to 44 Minutes | 94 | 32.2% |
| 45 to 59 Minutes | 97 | 33.2% |
| 60 to 89 Minutes | 6 | 2.1% |
| 90 or more Minutes | 0 | 0.0% |
Commute Time by Sex in Mountain Lakes
The most common commute times in Mountain Lakes are 45 to 59 minutes (97 commuters, 91.5%) for males and 40 to 44 minutes (94 commuters, 50.5%) for females.
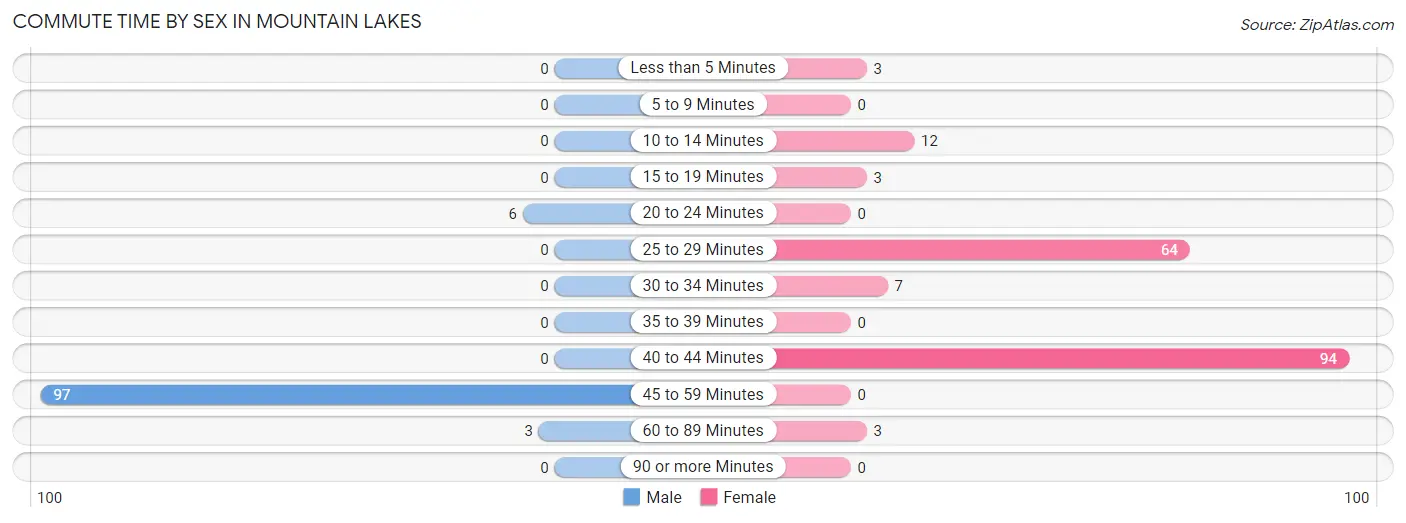
| Commute Time | Male | Female |
| Less than 5 Minutes | 0 (0.0%) | 3 (1.6%) |
| 5 to 9 Minutes | 0 (0.0%) | 0 (0.0%) |
| 10 to 14 Minutes | 0 (0.0%) | 12 (6.5%) |
| 15 to 19 Minutes | 0 (0.0%) | 3 (1.6%) |
| 20 to 24 Minutes | 6 (5.7%) | 0 (0.0%) |
| 25 to 29 Minutes | 0 (0.0%) | 64 (34.4%) |
| 30 to 34 Minutes | 0 (0.0%) | 7 (3.8%) |
| 35 to 39 Minutes | 0 (0.0%) | 0 (0.0%) |
| 40 to 44 Minutes | 0 (0.0%) | 94 (50.5%) |
| 45 to 59 Minutes | 97 (91.5%) | 0 (0.0%) |
| 60 to 89 Minutes | 3 (2.8%) | 3 (1.6%) |
| 90 or more Minutes | 0 (0.0%) | 0 (0.0%) |
Time of Departure to Work by Sex in Mountain Lakes
The most frequent times of departure to work in Mountain Lakes are 6:00 AM to 6:29 AM (44, 41.5%) for males and 5:00 AM to 5:29 AM (91, 48.9%) for females.
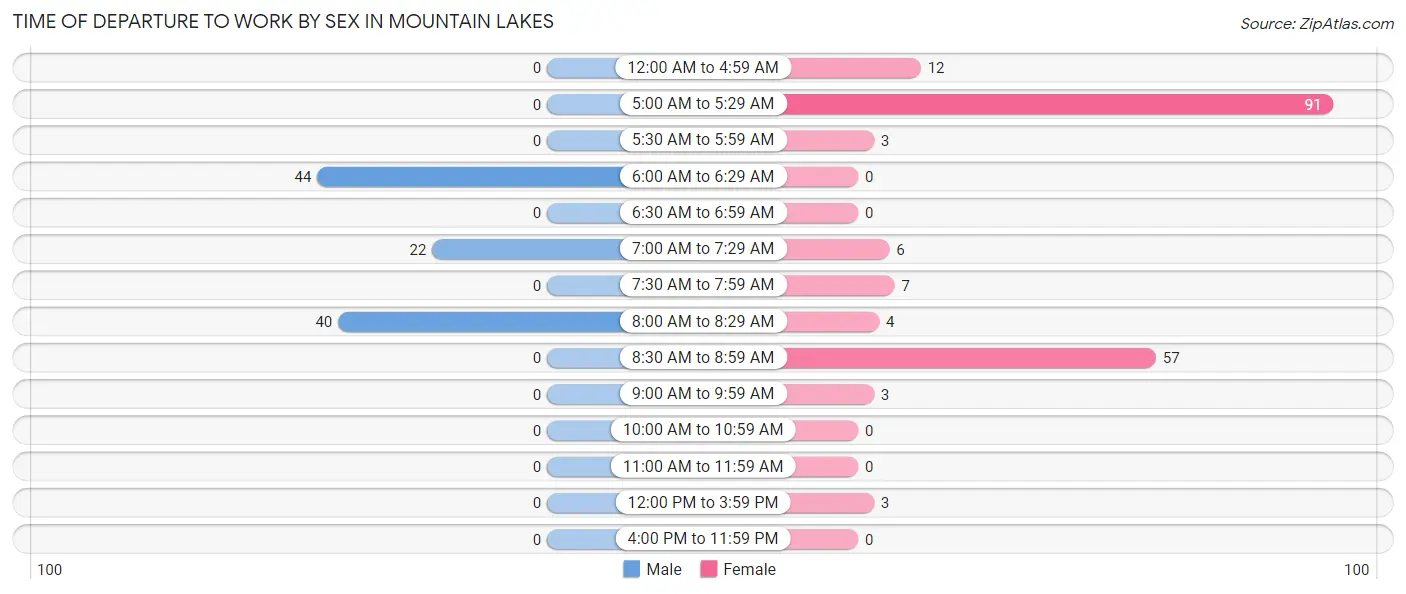
| Time of Departure | Male | Female |
| 12:00 AM to 4:59 AM | 0 (0.0%) | 12 (6.5%) |
| 5:00 AM to 5:29 AM | 0 (0.0%) | 91 (48.9%) |
| 5:30 AM to 5:59 AM | 0 (0.0%) | 3 (1.6%) |
| 6:00 AM to 6:29 AM | 44 (41.5%) | 0 (0.0%) |
| 6:30 AM to 6:59 AM | 0 (0.0%) | 0 (0.0%) |
| 7:00 AM to 7:29 AM | 22 (20.7%) | 6 (3.2%) |
| 7:30 AM to 7:59 AM | 0 (0.0%) | 7 (3.8%) |
| 8:00 AM to 8:29 AM | 40 (37.7%) | 4 (2.1%) |
| 8:30 AM to 8:59 AM | 0 (0.0%) | 57 (30.6%) |
| 9:00 AM to 9:59 AM | 0 (0.0%) | 3 (1.6%) |
| 10:00 AM to 10:59 AM | 0 (0.0%) | 0 (0.0%) |
| 11:00 AM to 11:59 AM | 0 (0.0%) | 0 (0.0%) |
| 12:00 PM to 3:59 PM | 0 (0.0%) | 3 (1.6%) |
| 4:00 PM to 11:59 PM | 0 (0.0%) | 0 (0.0%) |
| Total | 106 (100.0%) | 186 (100.0%) |
Housing Occupancy in Mountain Lakes
Occupancy by Ownership in Mountain Lakes
Of the total 239 dwellings in Mountain Lakes, owner-occupied units account for 232 (97.1%), while renter-occupied units make up 7 (2.9%).
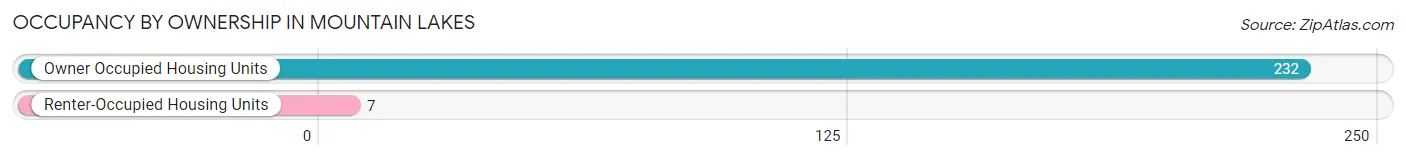
| Occupancy | # Housing Units | % Housing Units |
| Owner Occupied Housing Units | 232 | 97.1% |
| Renter-Occupied Housing Units | 7 | 2.9% |
| Total Occupied Housing Units | 239 | 100.0% |
Occupancy by Household Size in Mountain Lakes
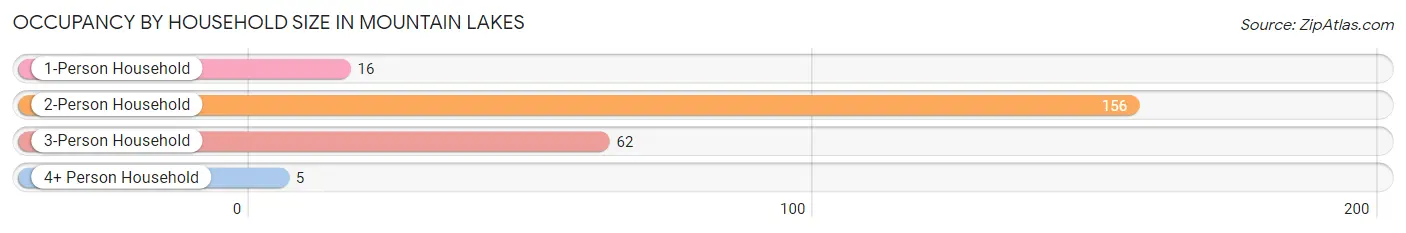
| Household Size | # Housing Units | % Housing Units |
| 1-Person Household | 16 | 6.7% |
| 2-Person Household | 156 | 65.3% |
| 3-Person Household | 62 | 25.9% |
| 4+ Person Household | 5 | 2.1% |
| Total Housing Units | 239 | 100.0% |
Occupancy by Ownership by Household Size in Mountain Lakes
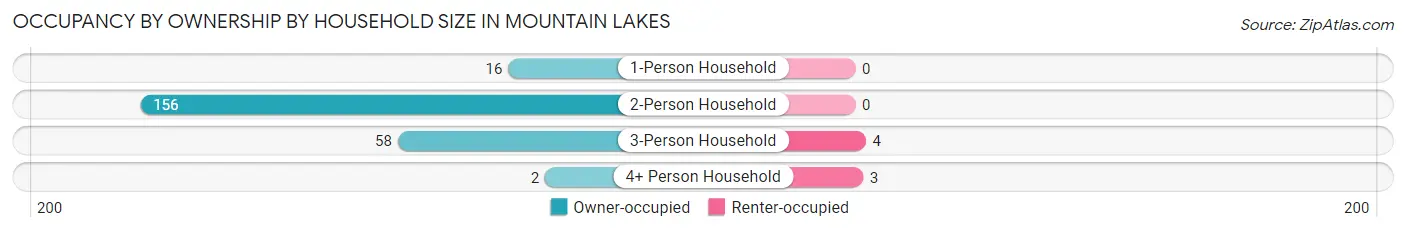
| Household Size | Owner-occupied | Renter-occupied |
| 1-Person Household | 16 (100.0%) | 0 (0.0%) |
| 2-Person Household | 156 (100.0%) | 0 (0.0%) |
| 3-Person Household | 58 (93.5%) | 4 (6.5%) |
| 4+ Person Household | 2 (40.0%) | 3 (60.0%) |
| Total Housing Units | 232 (97.1%) | 7 (2.9%) |
Occupancy by Educational Attainment in Mountain Lakes
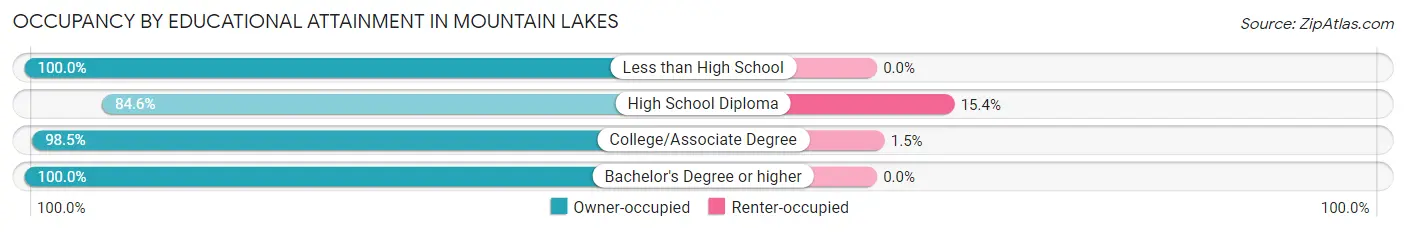
| Household Size | Owner-occupied | Renter-occupied |
| Less than High School | 8 (100.0%) | 0 (0.0%) |
| High School Diploma | 22 (84.6%) | 4 (15.4%) |
| College/Associate Degree | 194 (98.5%) | 3 (1.5%) |
| Bachelor's Degree or higher | 8 (100.0%) | 0 (0.0%) |
Occupancy by Age of Householder in Mountain Lakes
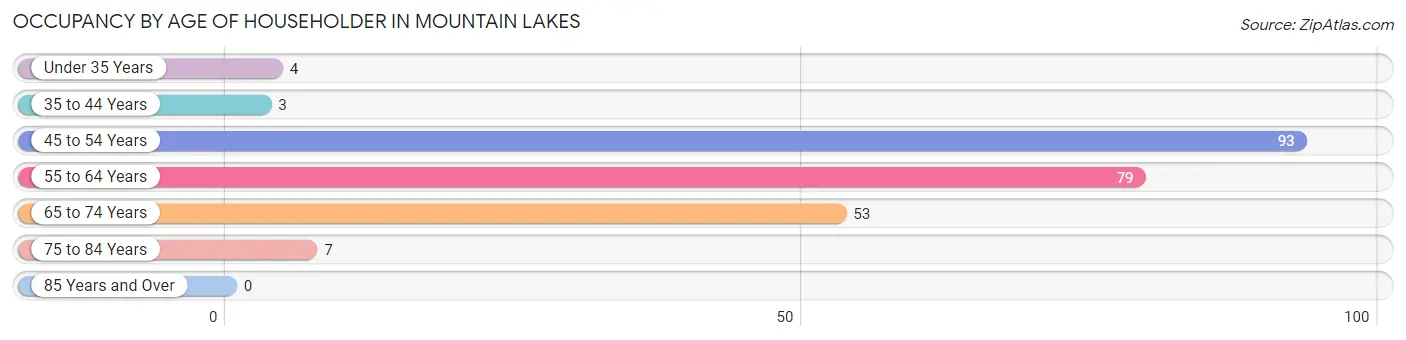
| Age Bracket | # Households | % Households |
| Under 35 Years | 4 | 1.7% |
| 35 to 44 Years | 3 | 1.3% |
| 45 to 54 Years | 93 | 38.9% |
| 55 to 64 Years | 79 | 33.1% |
| 65 to 74 Years | 53 | 22.2% |
| 75 to 84 Years | 7 | 2.9% |
| 85 Years and Over | 0 | 0.0% |
| Total | 239 | 100.0% |
Housing Finances in Mountain Lakes
Median Income by Occupancy in Mountain Lakes
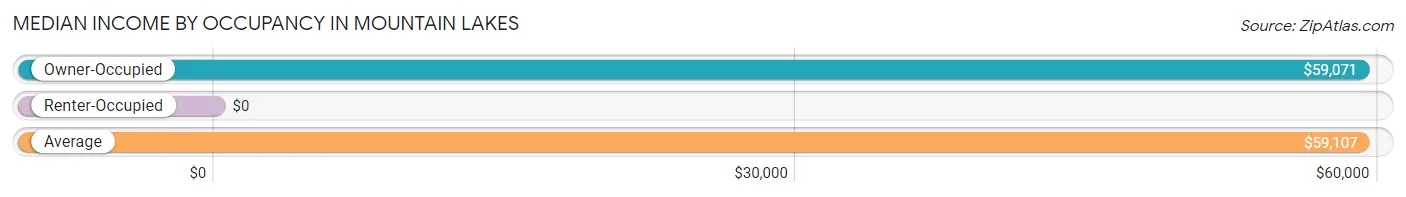
| Occupancy Type | # Households | Median Income |
| Owner-Occupied | 232 (97.1%) | $59,071 |
| Renter-Occupied | 7 (2.9%) | $0 |
| Average | 239 (100.0%) | $59,107 |
Occupancy by Householder Income Bracket in Mountain Lakes
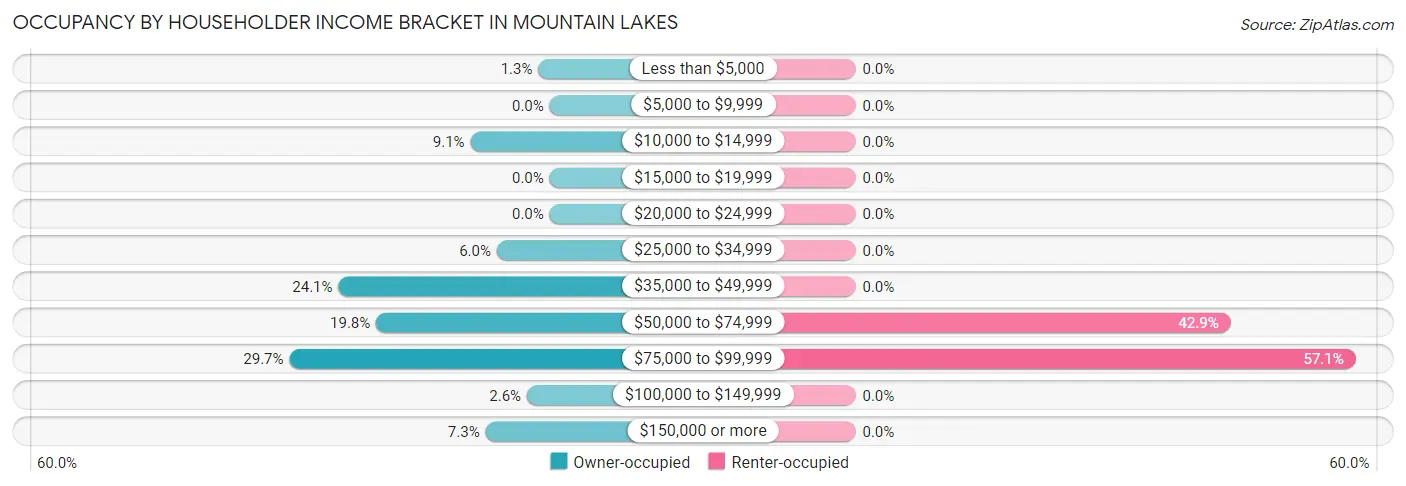
| Income Bracket | Owner-occupied | Renter-occupied |
| Less than $5,000 | 3 (1.3%) | 0 (0.0%) |
| $5,000 to $9,999 | 0 (0.0%) | 0 (0.0%) |
| $10,000 to $14,999 | 21 (9.0%) | 0 (0.0%) |
| $15,000 to $19,999 | 0 (0.0%) | 0 (0.0%) |
| $20,000 to $24,999 | 0 (0.0%) | 0 (0.0%) |
| $25,000 to $34,999 | 14 (6.0%) | 0 (0.0%) |
| $35,000 to $49,999 | 56 (24.1%) | 0 (0.0%) |
| $50,000 to $74,999 | 46 (19.8%) | 3 (42.9%) |
| $75,000 to $99,999 | 69 (29.7%) | 4 (57.1%) |
| $100,000 to $149,999 | 6 (2.6%) | 0 (0.0%) |
| $150,000 or more | 17 (7.3%) | 0 (0.0%) |
| Total | 232 (100.0%) | 7 (100.0%) |
Monthly Housing Cost Tiers in Mountain Lakes
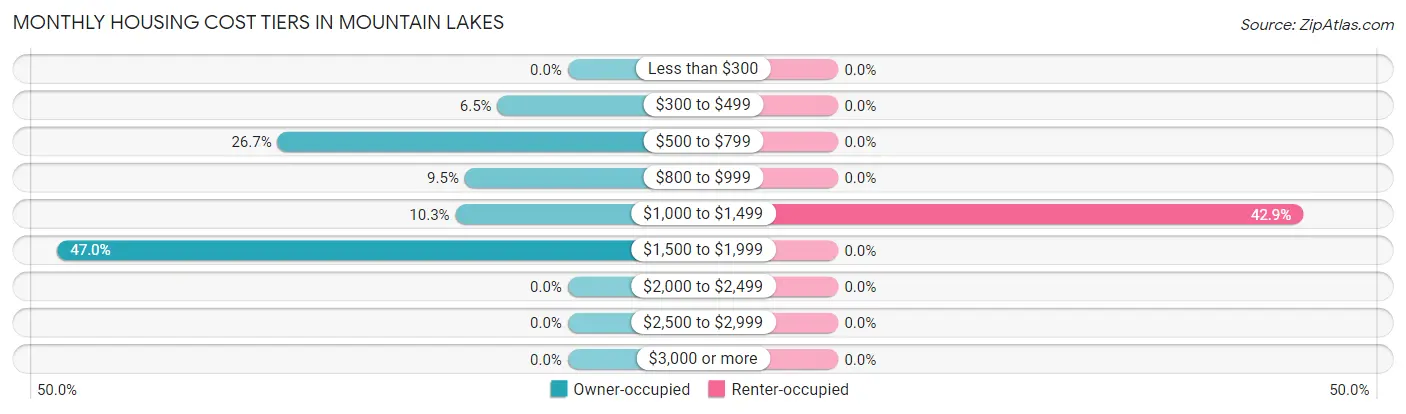
| Monthly Cost | Owner-occupied | Renter-occupied |
| Less than $300 | 0 (0.0%) | 0 (0.0%) |
| $300 to $499 | 15 (6.5%) | 0 (0.0%) |
| $500 to $799 | 62 (26.7%) | 0 (0.0%) |
| $800 to $999 | 22 (9.5%) | 0 (0.0%) |
| $1,000 to $1,499 | 24 (10.3%) | 3 (42.9%) |
| $1,500 to $1,999 | 109 (47.0%) | 0 (0.0%) |
| $2,000 to $2,499 | 0 (0.0%) | 0 (0.0%) |
| $2,500 to $2,999 | 0 (0.0%) | 0 (0.0%) |
| $3,000 or more | 0 (0.0%) | 0 (0.0%) |
| Total | 232 (100.0%) | 7 (100.0%) |
Physical Housing Characteristics in Mountain Lakes
Housing Structures in Mountain Lakes
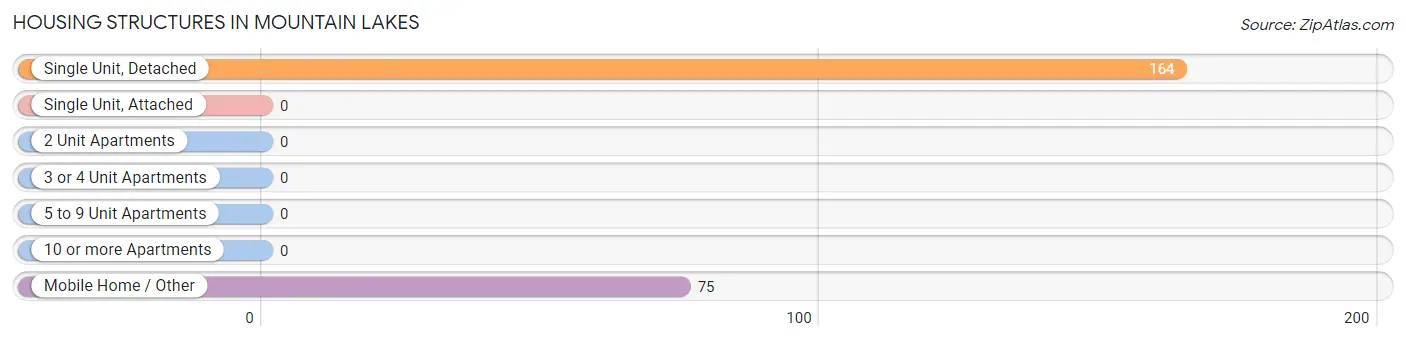
| Structure Type | # Housing Units | % Housing Units |
| Single Unit, Detached | 164 | 68.6% |
| Single Unit, Attached | 0 | 0.0% |
| 2 Unit Apartments | 0 | 0.0% |
| 3 or 4 Unit Apartments | 0 | 0.0% |
| 5 to 9 Unit Apartments | 0 | 0.0% |
| 10 or more Apartments | 0 | 0.0% |
| Mobile Home / Other | 75 | 31.4% |
| Total | 239 | 100.0% |
Housing Structures by Occupancy in Mountain Lakes
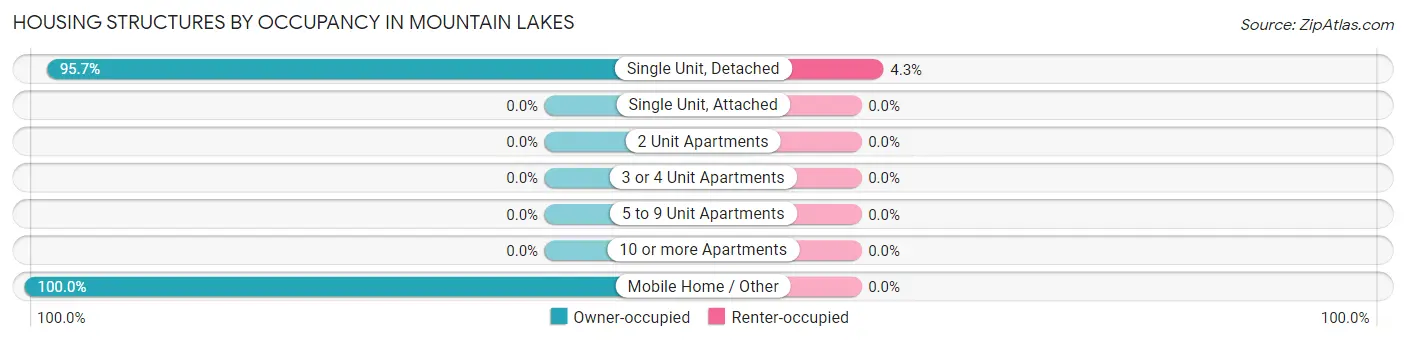
| Structure Type | Owner-occupied | Renter-occupied |
| Single Unit, Detached | 157 (95.7%) | 7 (4.3%) |
| Single Unit, Attached | 0 (0.0%) | 0 (0.0%) |
| 2 Unit Apartments | 0 (0.0%) | 0 (0.0%) |
| 3 or 4 Unit Apartments | 0 (0.0%) | 0 (0.0%) |
| 5 to 9 Unit Apartments | 0 (0.0%) | 0 (0.0%) |
| 10 or more Apartments | 0 (0.0%) | 0 (0.0%) |
| Mobile Home / Other | 75 (100.0%) | 0 (0.0%) |
| Total | 232 (97.1%) | 7 (2.9%) |
Housing Structures by Number of Rooms in Mountain Lakes
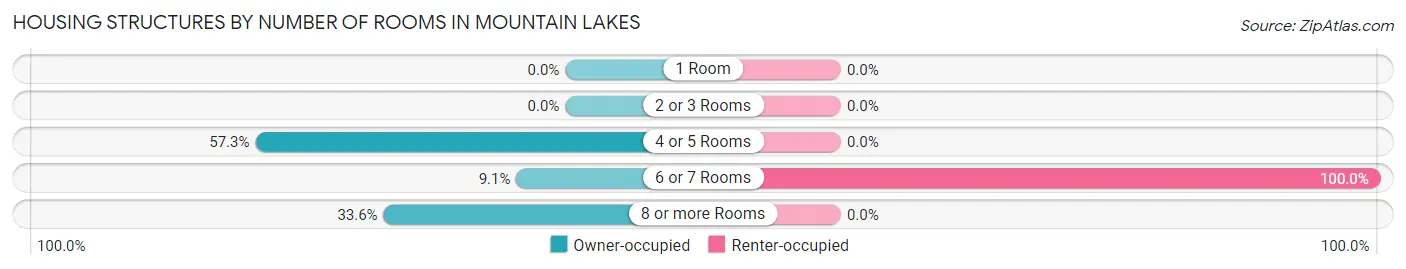
| Number of Rooms | Owner-occupied | Renter-occupied |
| 1 Room | 0 (0.0%) | 0 (0.0%) |
| 2 or 3 Rooms | 0 (0.0%) | 0 (0.0%) |
| 4 or 5 Rooms | 133 (57.3%) | 0 (0.0%) |
| 6 or 7 Rooms | 21 (9.0%) | 7 (100.0%) |
| 8 or more Rooms | 78 (33.6%) | 0 (0.0%) |
| Total | 232 (100.0%) | 7 (100.0%) |
Housing Structure by Heating Type in Mountain Lakes
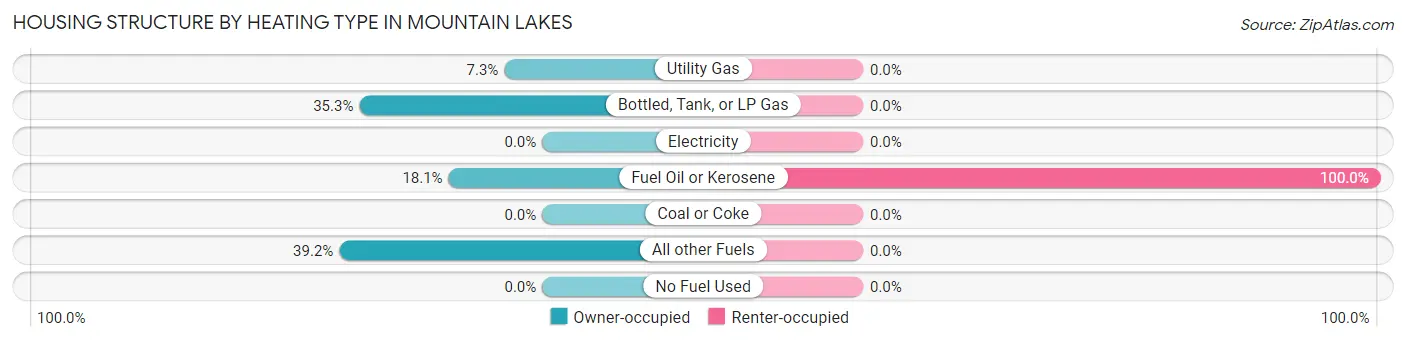
| Heating Type | Owner-occupied | Renter-occupied |
| Utility Gas | 17 (7.3%) | 0 (0.0%) |
| Bottled, Tank, or LP Gas | 82 (35.3%) | 0 (0.0%) |
| Electricity | 0 (0.0%) | 0 (0.0%) |
| Fuel Oil or Kerosene | 42 (18.1%) | 7 (100.0%) |
| Coal or Coke | 0 (0.0%) | 0 (0.0%) |
| All other Fuels | 91 (39.2%) | 0 (0.0%) |
| No Fuel Used | 0 (0.0%) | 0 (0.0%) |
| Total | 232 (100.0%) | 7 (100.0%) |
Household Vehicle Usage in Mountain Lakes
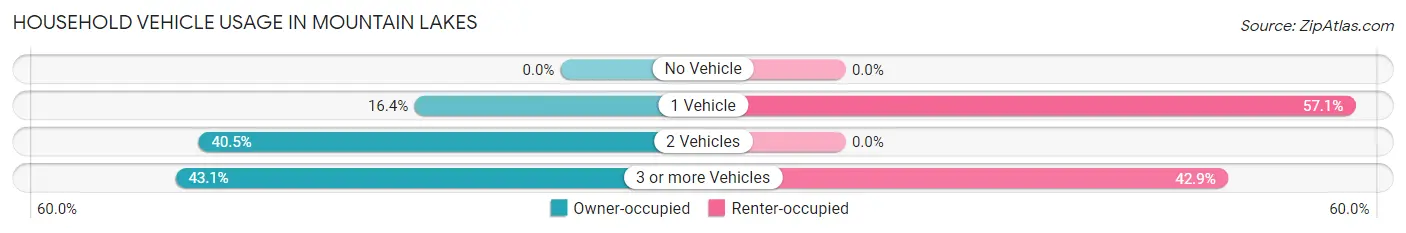
| Vehicles per Household | Owner-occupied | Renter-occupied |
| No Vehicle | 0 (0.0%) | 0 (0.0%) |
| 1 Vehicle | 38 (16.4%) | 4 (57.1%) |
| 2 Vehicles | 94 (40.5%) | 0 (0.0%) |
| 3 or more Vehicles | 100 (43.1%) | 3 (42.9%) |
| Total | 232 (100.0%) | 7 (100.0%) |
Real Estate & Mortgages in Mountain Lakes
Real Estate and Mortgage Overview in Mountain Lakes
| Characteristic | Without Mortgage | With Mortgage |
| Housing Units | 27 | 205 |
| Median Property Value | - | - |
| Median Household Income | $65,156 | $17 |
| Monthly Housing Costs | $481 | $0 |
| Real Estate Taxes | - | - |
Property Value by Mortgage Status in Mountain Lakes
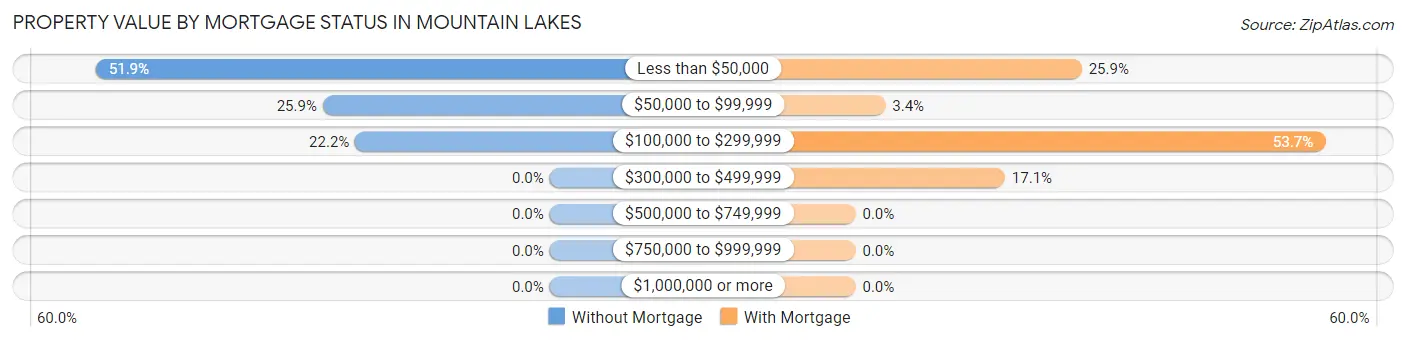
| Property Value | Without Mortgage | With Mortgage |
| Less than $50,000 | 14 (51.8%) | 53 (25.9%) |
| $50,000 to $99,999 | 7 (25.9%) | 7 (3.4%) |
| $100,000 to $299,999 | 6 (22.2%) | 110 (53.7%) |
| $300,000 to $499,999 | 0 (0.0%) | 35 (17.1%) |
| $500,000 to $749,999 | 0 (0.0%) | 0 (0.0%) |
| $750,000 to $999,999 | 0 (0.0%) | 0 (0.0%) |
| $1,000,000 or more | 0 (0.0%) | 0 (0.0%) |
| Total | 27 (100.0%) | 205 (100.0%) |
Household Income by Mortgage Status in Mountain Lakes
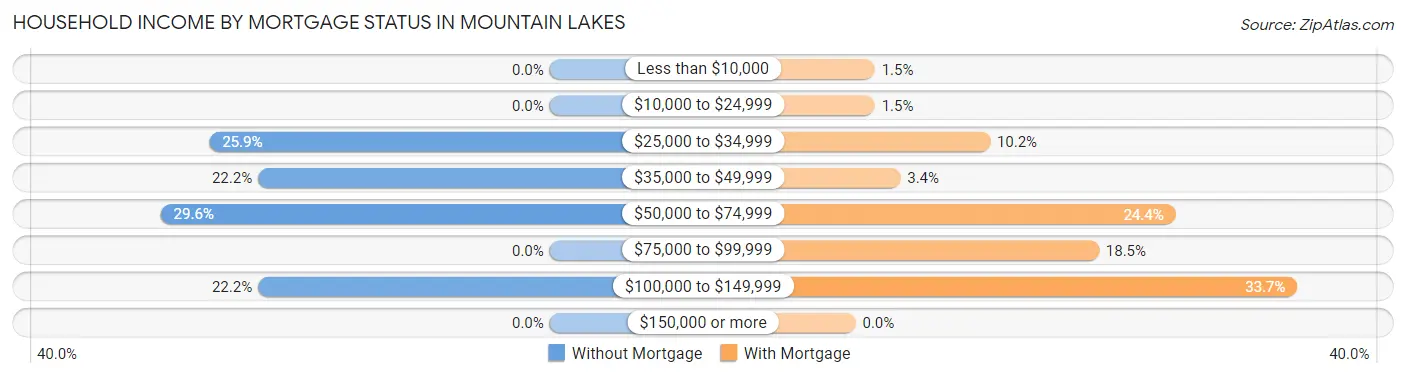
| Household Income | Without Mortgage | With Mortgage |
| Less than $10,000 | 0 (0.0%) | 3 (1.5%) |
| $10,000 to $24,999 | 0 (0.0%) | 3 (1.5%) |
| $25,000 to $34,999 | 7 (25.9%) | 21 (10.2%) |
| $35,000 to $49,999 | 6 (22.2%) | 7 (3.4%) |
| $50,000 to $74,999 | 8 (29.6%) | 50 (24.4%) |
| $75,000 to $99,999 | 0 (0.0%) | 38 (18.5%) |
| $100,000 to $149,999 | 6 (22.2%) | 69 (33.7%) |
| $150,000 or more | 0 (0.0%) | 0 (0.0%) |
| Total | 27 (100.0%) | 205 (100.0%) |
Property Value to Household Income Ratio in Mountain Lakes
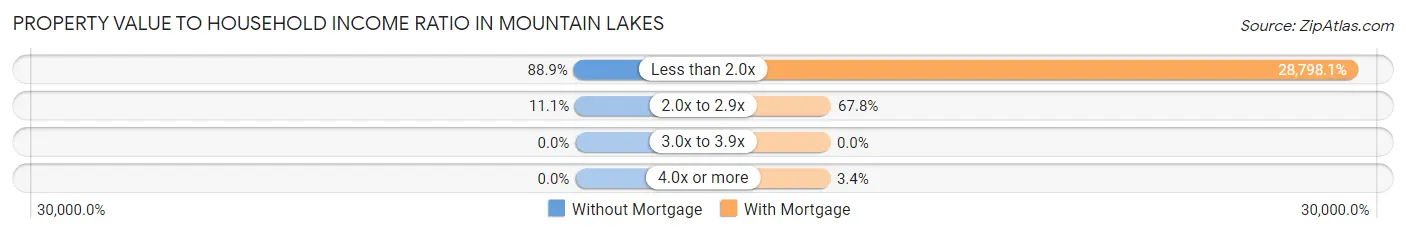
| Value-to-Income Ratio | Without Mortgage | With Mortgage |
| Less than 2.0x | 24 (88.9%) | 59,036 (28,798.1%) |
| 2.0x to 2.9x | 3 (11.1%) | 139 (67.8%) |
| 3.0x to 3.9x | 0 (0.0%) | 0 (0.0%) |
| 4.0x or more | 0 (0.0%) | 7 (3.4%) |
| Total | 27 (100.0%) | 205 (100.0%) |
Real Estate Taxes by Mortgage Status in Mountain Lakes
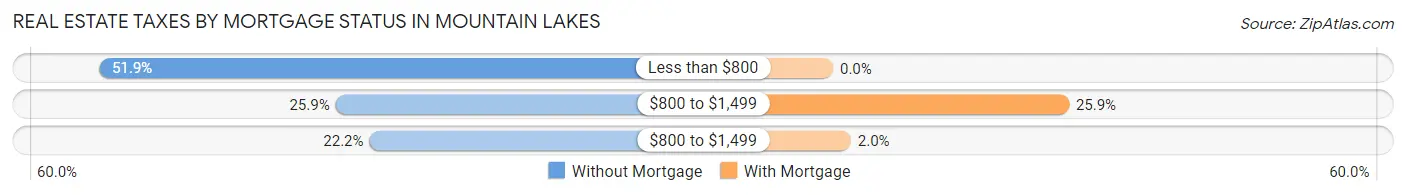
| Property Taxes | Without Mortgage | With Mortgage |
| Less than $800 | 14 (51.8%) | 0 (0.0%) |
| $800 to $1,499 | 7 (25.9%) | 53 (25.9%) |
| $800 to $1,499 | 6 (22.2%) | 4 (1.9%) |
| Total | 27 (100.0%) | 205 (100.0%) |
Health & Disability in Mountain Lakes
Health Insurance Coverage by Age in Mountain Lakes
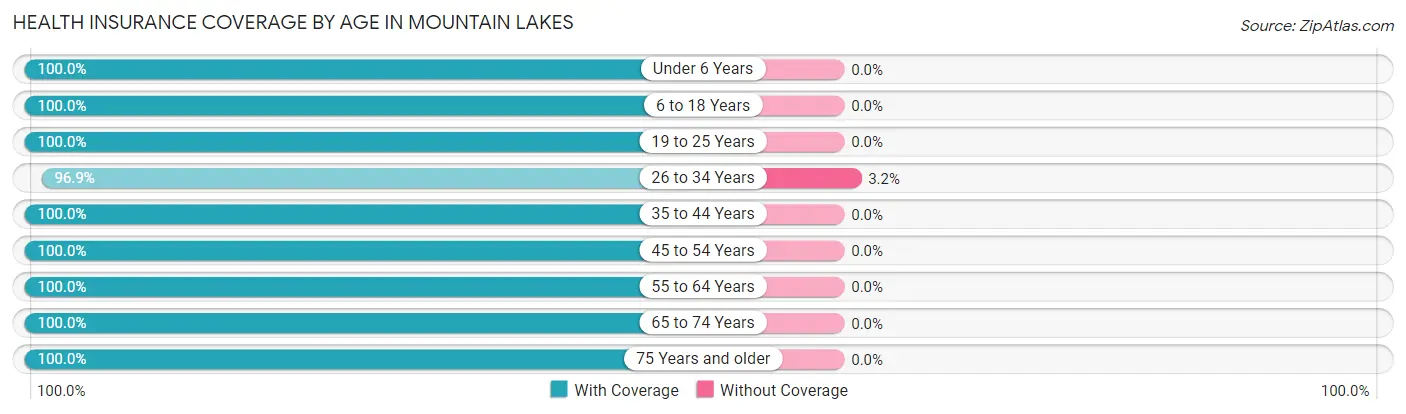
| Age Bracket | With Coverage | Without Coverage |
| Under 6 Years | 64 (100.0%) | 0 (0.0%) |
| 6 to 18 Years | 34 (100.0%) | 0 (0.0%) |
| 19 to 25 Years | 3 (100.0%) | 0 (0.0%) |
| 26 to 34 Years | 123 (96.9%) | 4 (3.2%) |
| 35 to 44 Years | 3 (100.0%) | 0 (0.0%) |
| 45 to 54 Years | 157 (100.0%) | 0 (0.0%) |
| 55 to 64 Years | 88 (100.0%) | 0 (0.0%) |
| 65 to 74 Years | 114 (100.0%) | 0 (0.0%) |
| 75 Years and older | 7 (100.0%) | 0 (0.0%) |
| Total | 593 (99.3%) | 4 (0.7%) |
Health Insurance Coverage by Citizenship Status in Mountain Lakes
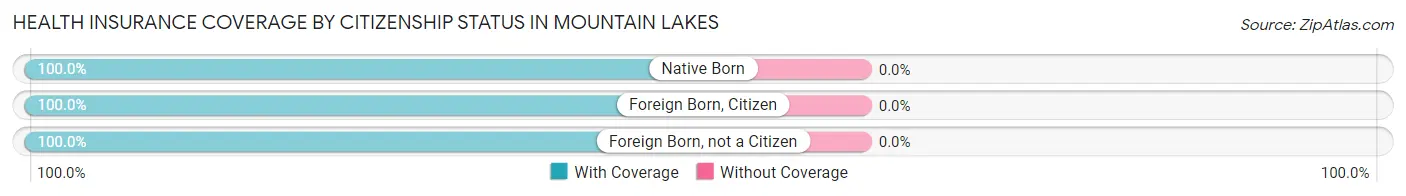
| Citizenship Status | With Coverage | Without Coverage |
| Native Born | 64 (100.0%) | 0 (0.0%) |
| Foreign Born, Citizen | 34 (100.0%) | 0 (0.0%) |
| Foreign Born, not a Citizen | 3 (100.0%) | 0 (0.0%) |
Health Insurance Coverage by Household Income in Mountain Lakes
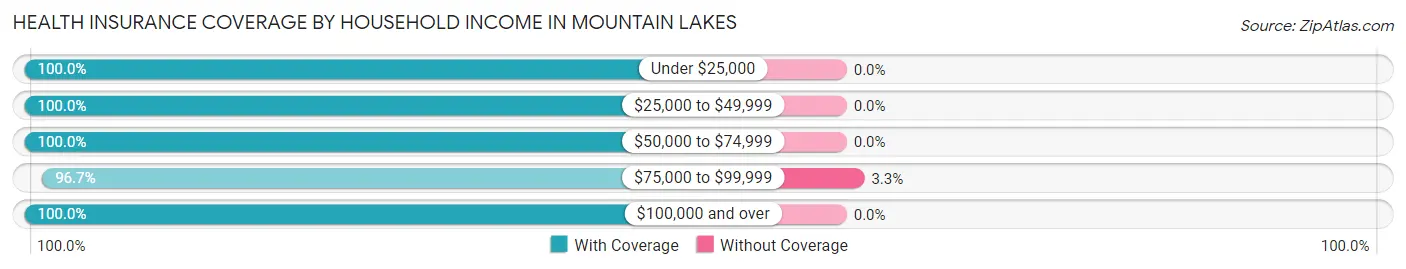
| Household Income | With Coverage | Without Coverage |
| Under $25,000 | 54 (100.0%) | 0 (0.0%) |
| $25,000 to $49,999 | 223 (100.0%) | 0 (0.0%) |
| $50,000 to $74,999 | 121 (100.0%) | 0 (0.0%) |
| $75,000 to $99,999 | 117 (96.7%) | 4 (3.3%) |
| $100,000 and over | 78 (100.0%) | 0 (0.0%) |
Public vs Private Health Insurance Coverage by Age in Mountain Lakes
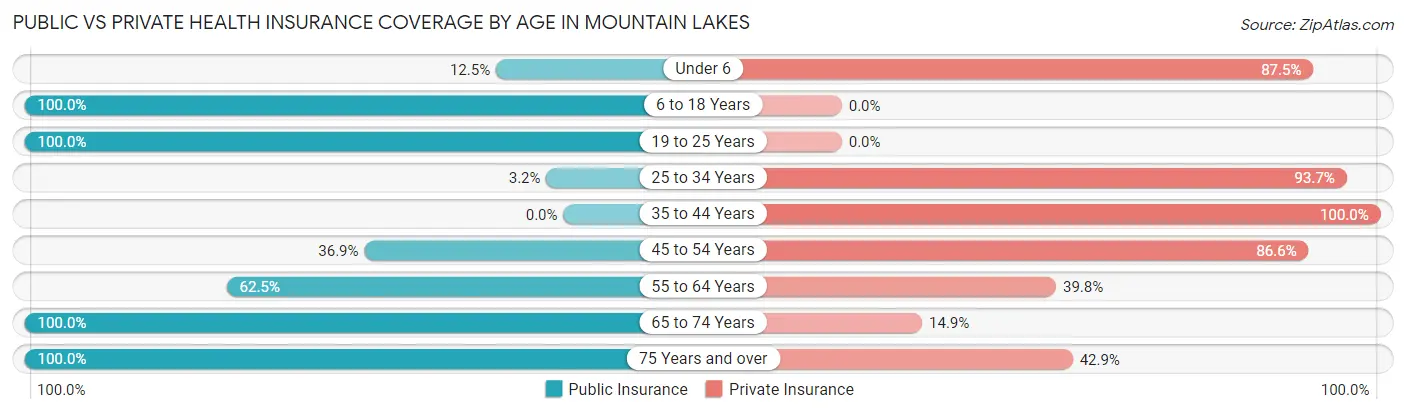
| Age Bracket | Public Insurance | Private Insurance |
| Under 6 | 8 (12.5%) | 56 (87.5%) |
| 6 to 18 Years | 34 (100.0%) | 0 (0.0%) |
| 19 to 25 Years | 3 (100.0%) | 0 (0.0%) |
| 25 to 34 Years | 4 (3.2%) | 119 (93.7%) |
| 35 to 44 Years | 0 (0.0%) | 3 (100.0%) |
| 45 to 54 Years | 58 (36.9%) | 136 (86.6%) |
| 55 to 64 Years | 55 (62.5%) | 35 (39.8%) |
| 65 to 74 Years | 114 (100.0%) | 17 (14.9%) |
| 75 Years and over | 7 (100.0%) | 3 (42.9%) |
| Total | 283 (47.4%) | 369 (61.8%) |
Disability Status by Sex by Age in Mountain Lakes
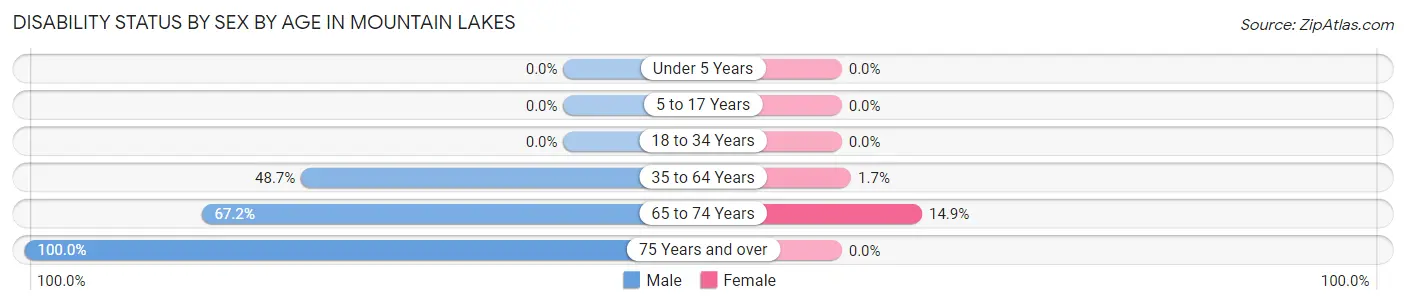
| Age Bracket | Male | Female |
| Under 5 Years | 0 (0.0%) | 0 (0.0%) |
| 5 to 17 Years | 0 (0.0%) | 0 (0.0%) |
| 18 to 34 Years | 0 (0.0%) | 0 (0.0%) |
| 35 to 64 Years | 37 (48.7%) | 3 (1.7%) |
| 65 to 74 Years | 45 (67.2%) | 7 (14.9%) |
| 75 Years and over | 7 (100.0%) | 0 (0.0%) |
Disability Class by Sex by Age in Mountain Lakes
Disability Class: Hearing Difficulty
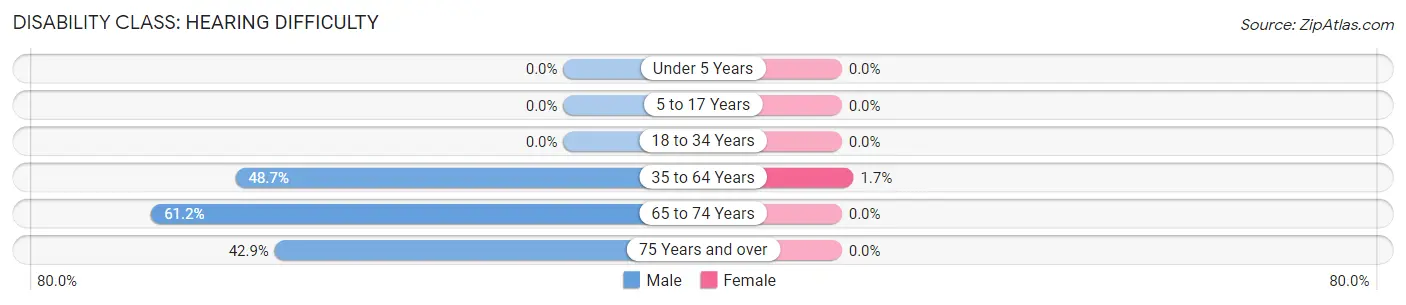
| Age Bracket | Male | Female |
| Under 5 Years | 0 (0.0%) | 0 (0.0%) |
| 5 to 17 Years | 0 (0.0%) | 0 (0.0%) |
| 18 to 34 Years | 0 (0.0%) | 0 (0.0%) |
| 35 to 64 Years | 37 (48.7%) | 3 (1.7%) |
| 65 to 74 Years | 41 (61.2%) | 0 (0.0%) |
| 75 Years and over | 3 (42.9%) | 0 (0.0%) |
Disability Class: Vision Difficulty
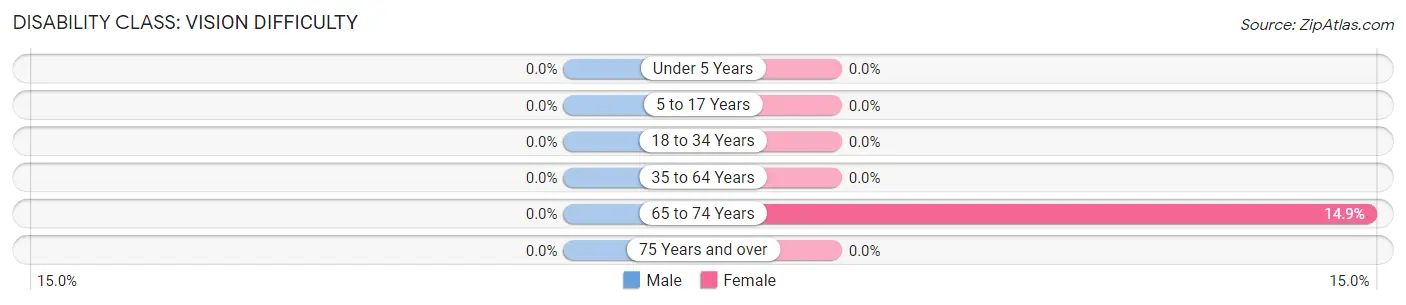
| Age Bracket | Male | Female |
| Under 5 Years | 0 (0.0%) | 0 (0.0%) |
| 5 to 17 Years | 0 (0.0%) | 0 (0.0%) |
| 18 to 34 Years | 0 (0.0%) | 0 (0.0%) |
| 35 to 64 Years | 0 (0.0%) | 0 (0.0%) |
| 65 to 74 Years | 0 (0.0%) | 7 (14.9%) |
| 75 Years and over | 0 (0.0%) | 0 (0.0%) |
Disability Class: Cognitive Difficulty
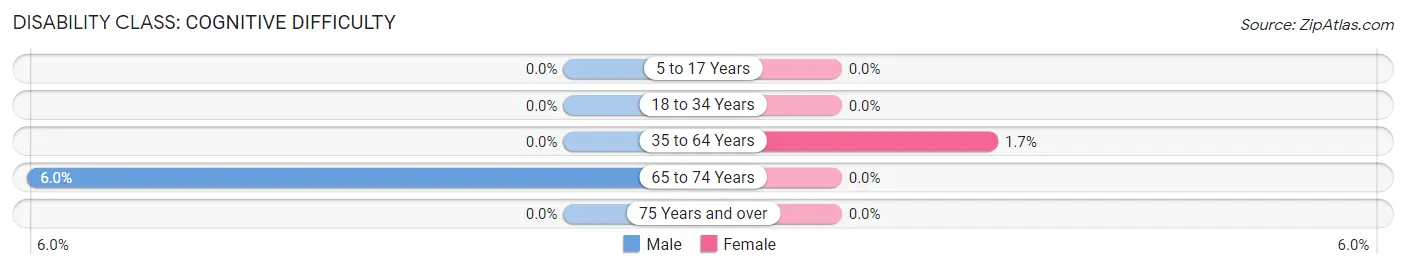
| Age Bracket | Male | Female |
| 5 to 17 Years | 0 (0.0%) | 0 (0.0%) |
| 18 to 34 Years | 0 (0.0%) | 0 (0.0%) |
| 35 to 64 Years | 0 (0.0%) | 3 (1.7%) |
| 65 to 74 Years | 4 (6.0%) | 0 (0.0%) |
| 75 Years and over | 0 (0.0%) | 0 (0.0%) |
Disability Class: Ambulatory Difficulty
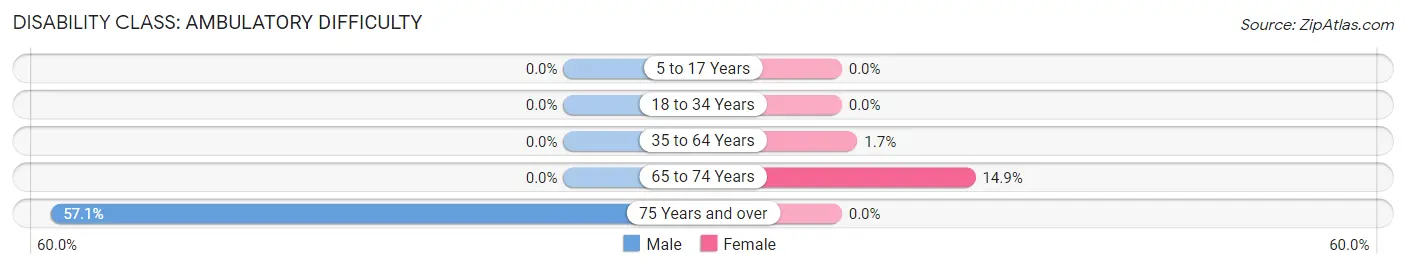
| Age Bracket | Male | Female |
| 5 to 17 Years | 0 (0.0%) | 0 (0.0%) |
| 18 to 34 Years | 0 (0.0%) | 0 (0.0%) |
| 35 to 64 Years | 0 (0.0%) | 3 (1.7%) |
| 65 to 74 Years | 0 (0.0%) | 7 (14.9%) |
| 75 Years and over | 4 (57.1%) | 0 (0.0%) |
Disability Class: Self-Care Difficulty
| Age Bracket | Male | Female |
| 5 to 17 Years | 0 (0.0%) | 0 (0.0%) |
| 18 to 34 Years | 0 (0.0%) | 0 (0.0%) |
| 35 to 64 Years | 0 (0.0%) | 0 (0.0%) |
| 65 to 74 Years | 0 (0.0%) | 0 (0.0%) |
| 75 Years and over | 0 (0.0%) | 0 (0.0%) |
Technology Access in Mountain Lakes
Computing Device Access in Mountain Lakes
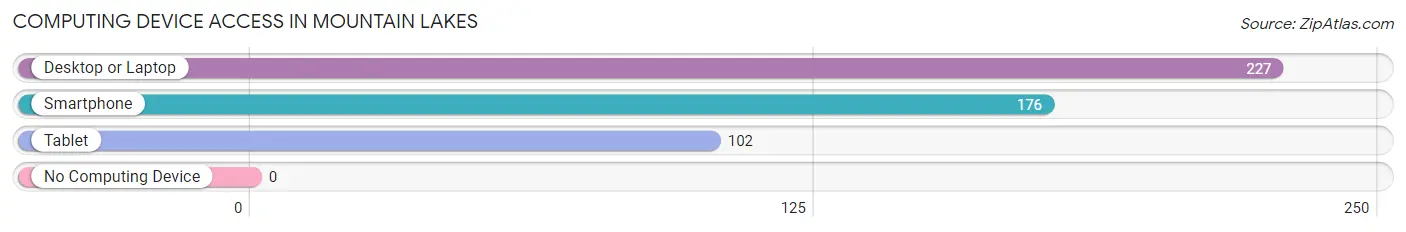
| Device Type | # Households | % Households |
| Desktop or Laptop | 227 | 95.0% |
| Smartphone | 176 | 73.6% |
| Tablet | 102 | 42.7% |
| No Computing Device | 0 | 0.0% |
| Total | 239 | 100.0% |
Internet Access in Mountain Lakes
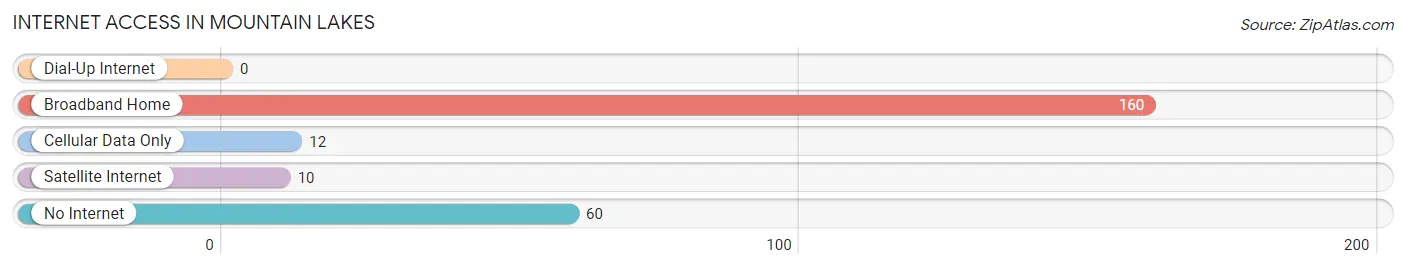
| Internet Type | # Households | % Households |
| Dial-Up Internet | 0 | 0.0% |
| Broadband Home | 160 | 66.9% |
| Cellular Data Only | 12 | 5.0% |
| Satellite Internet | 10 | 4.2% |
| No Internet | 60 | 25.1% |
| Total | 239 | 100.0% |
Mountain Lakes Summary
Mountain Lakes, New Hampshire is a small town located in the White Mountains region of the state. It is situated in the foothills of the White Mountains, and is surrounded by the towns of Franconia, Bethlehem, and Littleton. The town was originally settled in 1772, and was incorporated in 1796.
Geography
Mountain Lakes is located in the White Mountains region of New Hampshire, in the foothills of the White Mountains. The town is situated in the northern part of Grafton County, and is bordered by the towns of Franconia, Bethlehem, and Littleton. The town is located at an elevation of 1,400 feet, and has a total area of 11.2 square miles. The town is home to several small lakes, including Mountain Lake, Little Lake, and Big Lake. The town is also home to several small streams, including the Ammonoosuc River, which flows through the town.
Climate
Mountain Lakes has a humid continental climate, with cold winters and warm summers. The average annual temperature is around 40 degrees Fahrenheit, with an average high of around 70 degrees in the summer and an average low of around 20 degrees in the winter. The town receives an average of around 40 inches of precipitation per year, with most of it falling in the form of snow in the winter months.
Demographics
As of the 2010 census, the town of Mountain Lakes had a population of 1,845 people. The population density was 164.3 people per square mile. The racial makeup of the town was 97.3% White, 0.3% African American, 0.2% Native American, 0.5% Asian, 0.1% Pacific Islander, 0.3% from other races, and 1.3% from two or more races. Hispanic or Latino of any race were 1.2% of the population.
Economy
Mountain Lakes is a small, rural town, and the economy is largely based on tourism and recreation. The town is home to several ski resorts, including Cannon Mountain, Loon Mountain, and Bretton Woods. The town is also home to several small businesses, including restaurants, shops, and lodging. The town is also home to several small farms, which produce a variety of fruits and vegetables.
History
Mountain Lakes was originally settled in 1772, and was incorporated in 1796. The town was originally a farming community, and the town's economy was largely based on agriculture. In the late 19th century, the town began to develop as a tourist destination, and several ski resorts were built in the area. The town has remained a popular tourist destination, and continues to attract visitors from all over the world.
Common Questions
What is Per Capita Income in Mountain Lakes?
Per Capita income in Mountain Lakes is $36,885.
What is the Median Family Income in Mountain Lakes?
Median Family Income in Mountain Lakes is $58,393.
What is the Median Household income in Mountain Lakes?
Median Household Income in Mountain Lakes is $59,107.
What is Inequality or Gini Index in Mountain Lakes?
Inequality or Gini Index in Mountain Lakes is 0.32.
What is the Total Population of Mountain Lakes?
Total Population of Mountain Lakes is 597.
What is the Total Male Population of Mountain Lakes?
Total Male Population of Mountain Lakes is 185.
What is the Total Female Population of Mountain Lakes?
Total Female Population of Mountain Lakes is 412.
What is the Ratio of Males per 100 Females in Mountain Lakes?
There are 44.90 Males per 100 Females in Mountain Lakes.
What is the Ratio of Females per 100 Males in Mountain Lakes?
There are 222.70 Females per 100 Males in Mountain Lakes.
What is the Median Population Age in Mountain Lakes?
Median Population Age in Mountain Lakes is 50.8 Years.
What is the Average Family Size in Mountain Lakes
Average Family Size in Mountain Lakes is 2.5 People.
What is the Average Household Size in Mountain Lakes
Average Household Size in Mountain Lakes is 2.5 People.
How Large is the Labor Force in Mountain Lakes?
There are 300 People in the Labor Forcein in Mountain Lakes.
What is the Percentage of People in the Labor Force in Mountain Lakes?
56.7% of People are in the Labor Force in Mountain Lakes.
What is the Unemployment Rate in Mountain Lakes?
Unemployment Rate in Mountain Lakes is 1.3%.