Lincoln, NH Map & Demographics
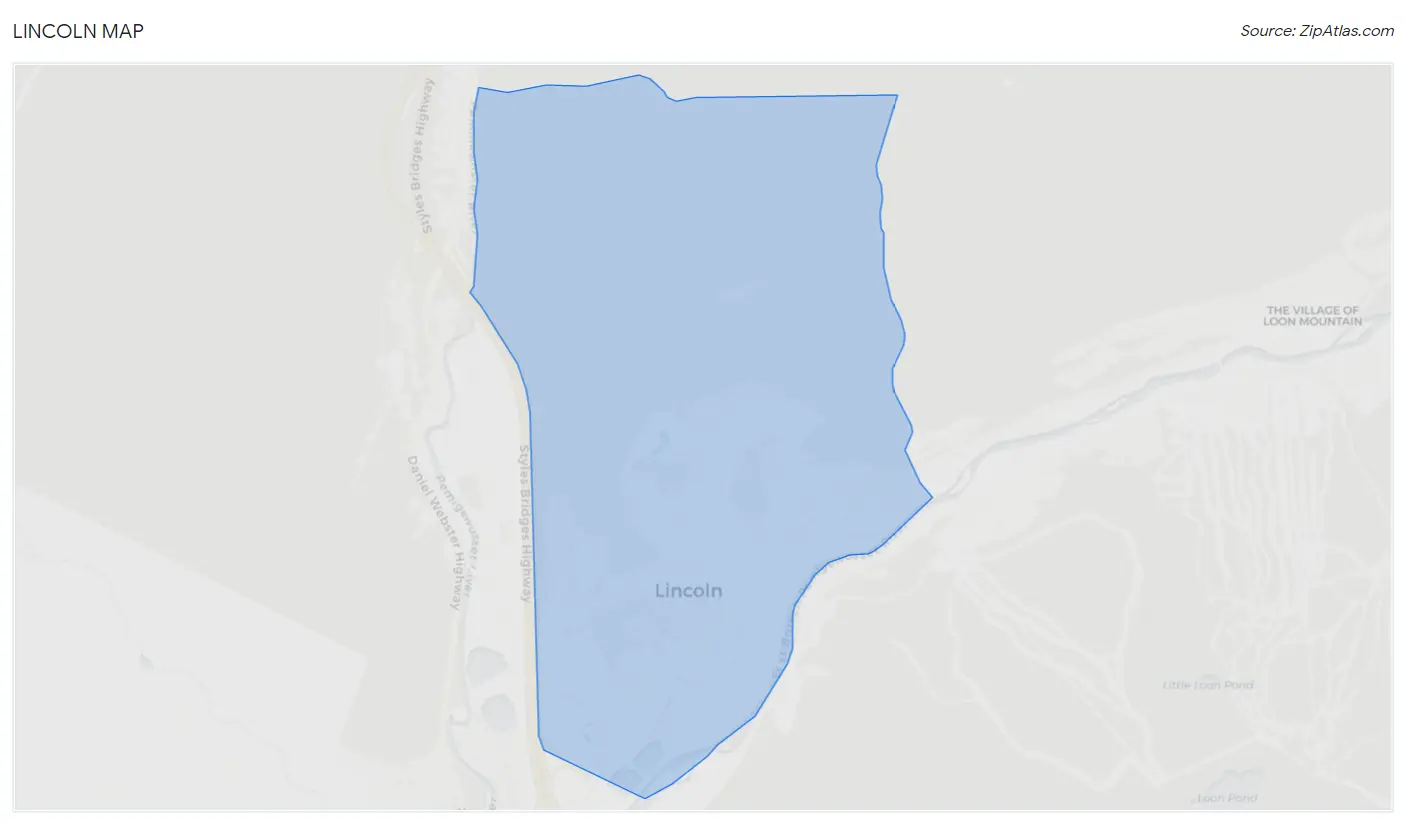
Lincoln Map
Lincoln Overview
$37,937
PER CAPITA INCOME
$64,250
AVG FAMILY INCOME
$58,125
AVG HOUSEHOLD INCOME
4.9%
WAGE / INCOME GAP [ % ]
95.1¢/ $1
WAGE / INCOME GAP [ $ ]
0.46
INEQUALITY / GINI INDEX
1,017
TOTAL POPULATION
578
MALE POPULATION
439
FEMALE POPULATION
131.66
MALES / 100 FEMALES
75.95
FEMALES / 100 MALES
46.7
MEDIAN AGE
2.5
AVG FAMILY SIZE
2.2
AVG HOUSEHOLD SIZE
535
LABOR FORCE [ PEOPLE ]
62.1%
PERCENT IN LABOR FORCE
2.4%
UNEMPLOYMENT RATE
Lincoln Zip Codes
Lincoln Area Codes
Income in Lincoln
Income Overview in Lincoln
Per Capita Income in Lincoln is $37,937, while median incomes of families and households are $64,250 and $58,125 respectively.
| Characteristic | Number | Measure |
| Per Capita Income | 1,017 | $37,937 |
| Median Family Income | 314 | $64,250 |
| Mean Family Income | 314 | $91,512 |
| Median Household Income | 459 | $58,125 |
| Mean Household Income | 459 | $79,087 |
| Income Deficit | 314 | $0 |
| Wage / Income Gap (%) | 1,017 | 4.89% |
| Wage / Income Gap ($) | 1,017 | 95.11¢ per $1 |
| Gini / Inequality Index | 1,017 | 0.46 |
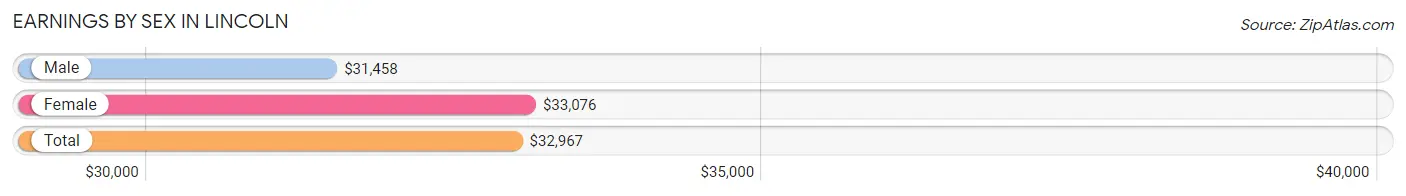
Earnings by Sex in Lincoln
Average Earnings in Lincoln are $32,967, $31,458 for men and $33,076 for women, a difference of 4.9%.
| Sex | Number | Average Earnings |
| Male | 306 (47.9%) | $31,458 |
| Female | 333 (52.1%) | $33,076 |
| Total | 639 (100.0%) | $32,967 |
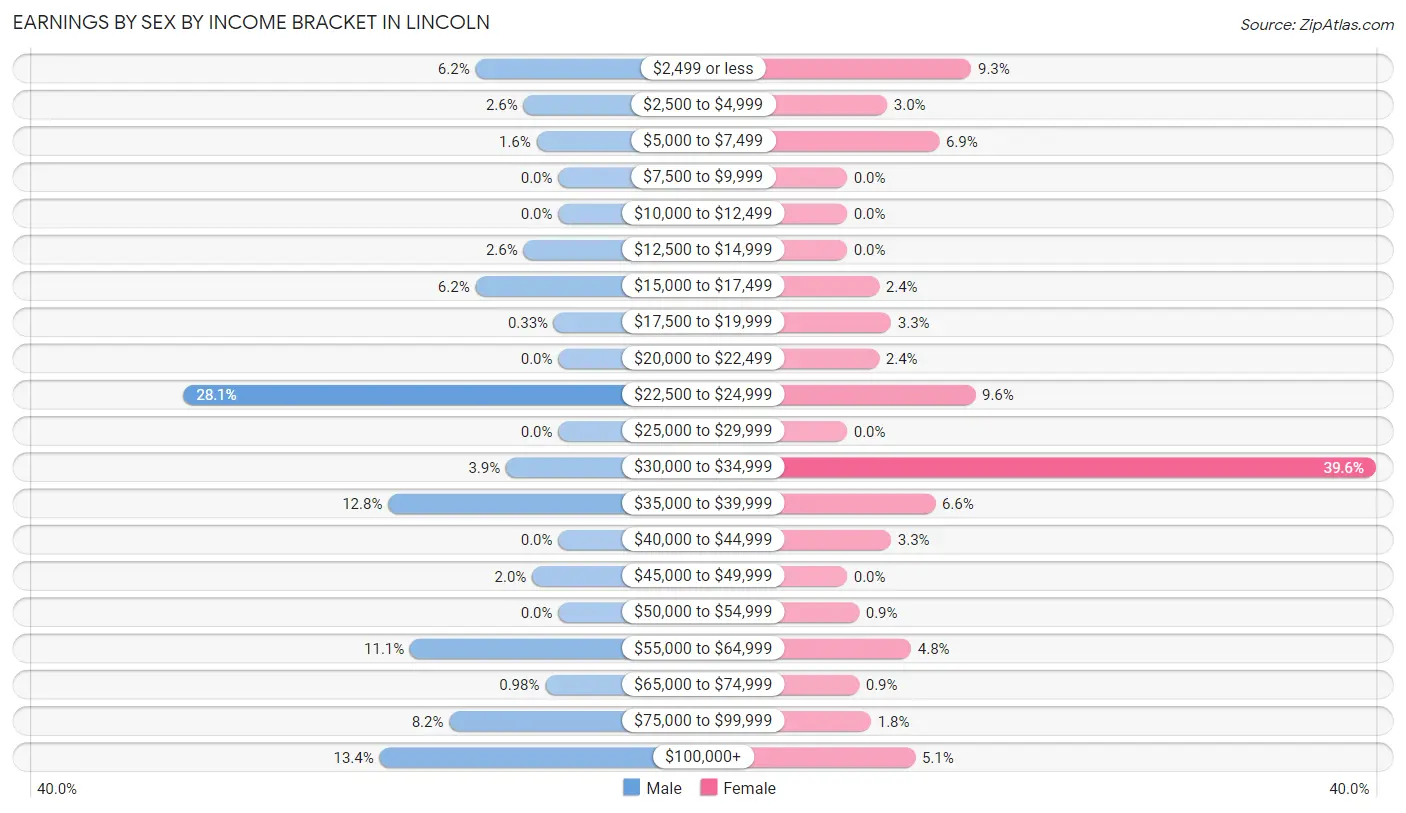
Earnings by Sex by Income Bracket in Lincoln
The most common earnings brackets in Lincoln are $22,500 to $24,999 for men (86 | 28.1%) and $30,000 to $34,999 for women (132 | 39.6%).
| Income | Male | Female |
| $2,499 or less | 19 (6.2%) | 31 (9.3%) |
| $2,500 to $4,999 | 8 (2.6%) | 10 (3.0%) |
| $5,000 to $7,499 | 5 (1.6%) | 23 (6.9%) |
| $7,500 to $9,999 | 0 (0.0%) | 0 (0.0%) |
| $10,000 to $12,499 | 0 (0.0%) | 0 (0.0%) |
| $12,500 to $14,999 | 8 (2.6%) | 0 (0.0%) |
| $15,000 to $17,499 | 19 (6.2%) | 8 (2.4%) |
| $17,500 to $19,999 | 1 (0.3%) | 11 (3.3%) |
| $20,000 to $22,499 | 0 (0.0%) | 8 (2.4%) |
| $22,500 to $24,999 | 86 (28.1%) | 32 (9.6%) |
| $25,000 to $29,999 | 0 (0.0%) | 0 (0.0%) |
| $30,000 to $34,999 | 12 (3.9%) | 132 (39.6%) |
| $35,000 to $39,999 | 39 (12.8%) | 22 (6.6%) |
| $40,000 to $44,999 | 0 (0.0%) | 11 (3.3%) |
| $45,000 to $49,999 | 6 (2.0%) | 0 (0.0%) |
| $50,000 to $54,999 | 0 (0.0%) | 3 (0.9%) |
| $55,000 to $64,999 | 34 (11.1%) | 16 (4.8%) |
| $65,000 to $74,999 | 3 (1.0%) | 3 (0.9%) |
| $75,000 to $99,999 | 25 (8.2%) | 6 (1.8%) |
| $100,000+ | 41 (13.4%) | 17 (5.1%) |
| Total | 306 (100.0%) | 333 (100.0%) |
Earnings by Sex by Educational Attainment in Lincoln
Average earnings in Lincoln are $35,256 for men and $33,423 for women, a difference of 5.2%. Men with an educational attainment of high school diploma enjoy the highest average annual earnings of $36,989, while those with college or associate's degree education earn the least with $35,294. Women with an educational attainment of graduate degree earn the most with the average annual earnings of $44,432, while those with high school diploma education have the smallest earnings of $23,684.

| Educational Attainment | Male Income | Female Income |
| Less than High School | - | - |
| High School Diploma | $36,989 | $23,684 |
| College or Associate's Degree | $35,294 | $33,989 |
| Bachelor's Degree | - | - |
| Graduate Degree | - | - |
| Total | $35,256 | $33,423 |
Family Income in Lincoln
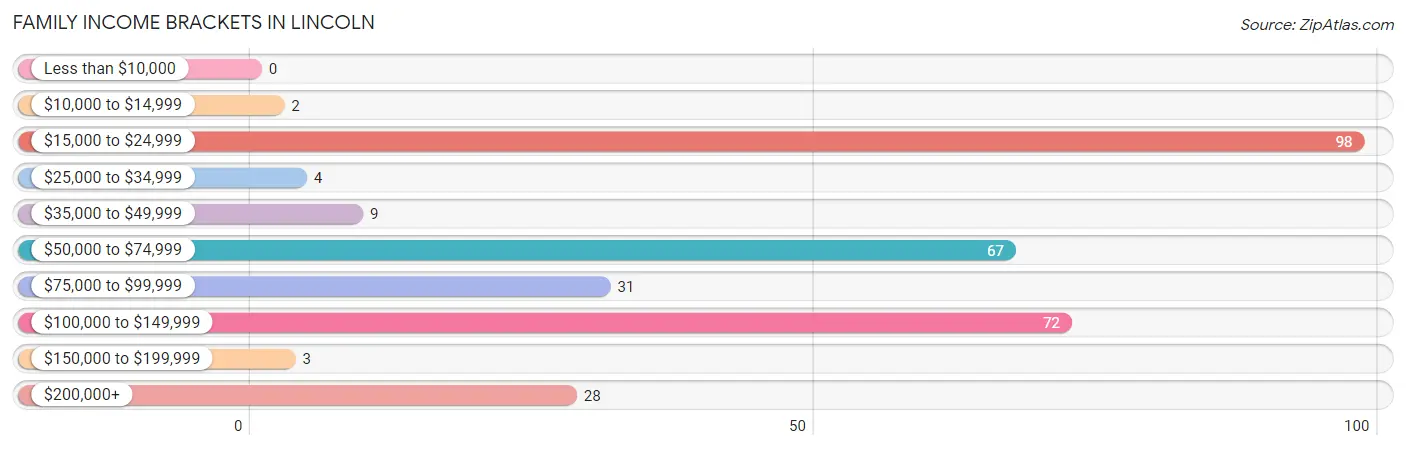
Family Income Brackets in Lincoln
According to the Lincoln family income data, there are 98 families falling into the $15,000 to $24,999 income range, which is the most common income bracket and makes up 31.2% of all families.
| Income Bracket | # Families | % Families |
| Less than $10,000 | 0 | 0.0% |
| $10,000 to $14,999 | 2 | 0.6% |
| $15,000 to $24,999 | 98 | 31.2% |
| $25,000 to $34,999 | 4 | 1.3% |
| $35,000 to $49,999 | 9 | 2.9% |
| $50,000 to $74,999 | 67 | 21.3% |
| $75,000 to $99,999 | 31 | 9.9% |
| $100,000 to $149,999 | 72 | 22.9% |
| $150,000 to $199,999 | 3 | 1.0% |
| $200,000+ | 28 | 8.9% |
Family Income by Famaliy Size in Lincoln
4-person families (20 | 6.4%) account for the highest median family income in Lincoln with $143,462 per family, while 4-person families (20 | 6.4%) have the highest median income of $35,866 per family member.
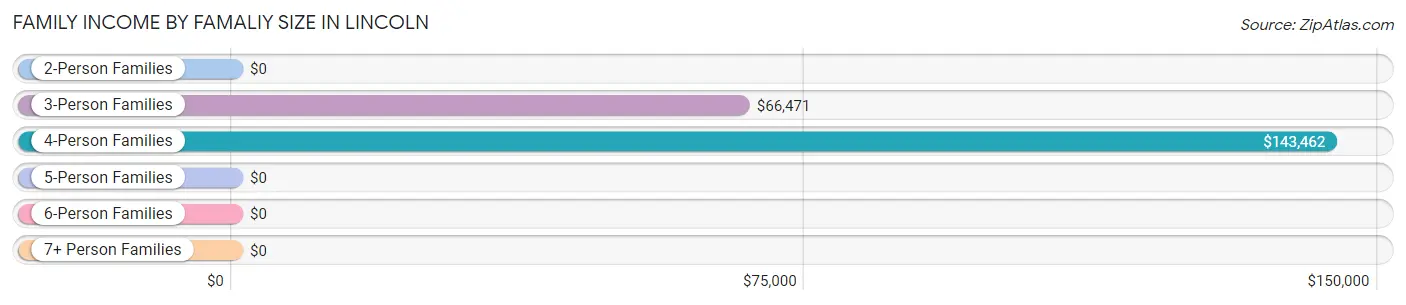
| Income Bracket | # Families | Median Income |
| 2-Person Families | 236 (75.2%) | $0 |
| 3-Person Families | 58 (18.5%) | $66,471 |
| 4-Person Families | 20 (6.4%) | $143,462 |
| 5-Person Families | 0 (0.0%) | $0 |
| 6-Person Families | 0 (0.0%) | $0 |
| 7+ Person Families | 0 (0.0%) | $0 |
| Total | 314 (100.0%) | $64,250 |
Family Income by Number of Earners in Lincoln
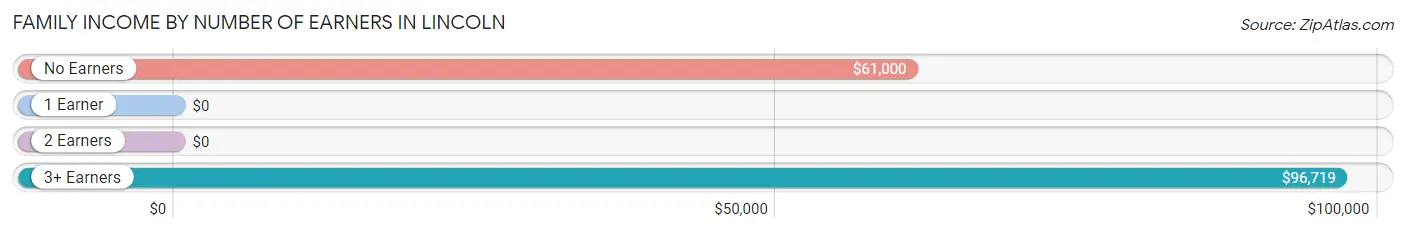
| Number of Earners | # Families | Median Income |
| No Earners | 24 (7.6%) | $61,000 |
| 1 Earner | 191 (60.8%) | $0 |
| 2 Earners | 57 (18.1%) | $0 |
| 3+ Earners | 42 (13.4%) | $96,719 |
| Total | 314 (100.0%) | $64,250 |
Household Income in Lincoln
Household Income Brackets in Lincoln
With 100 households falling in the category, the $35,000 to $49,999 income range is the most frequent in Lincoln, accounting for 21.8% of all households. In contrast, only 6 households (1.3%) fall into the less than $10,000 income bracket, making it the least populous group.
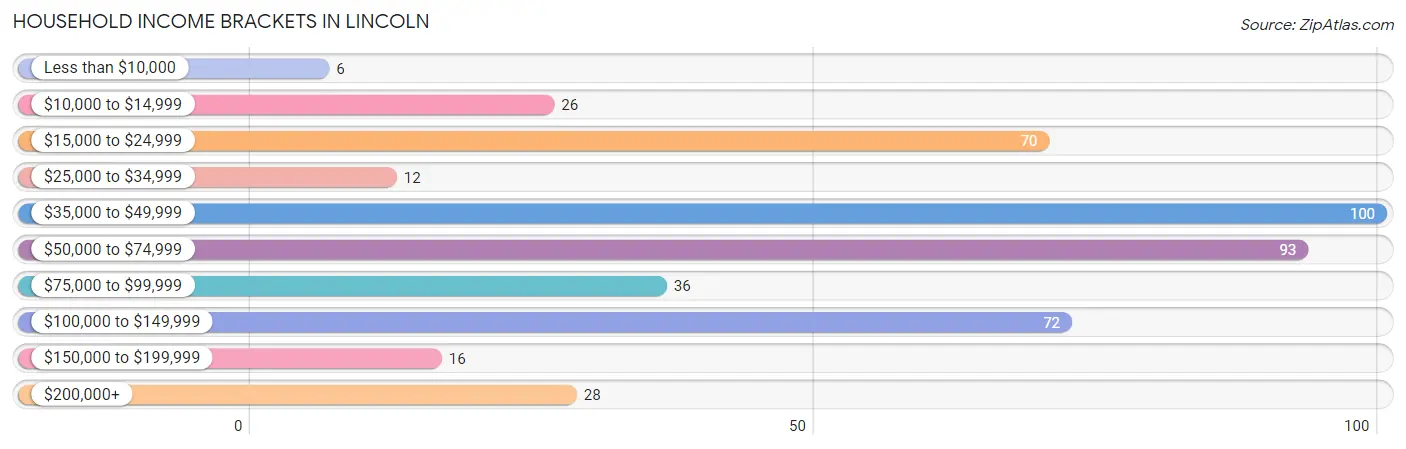
| Income Bracket | # Households | % Households |
| Less than $10,000 | 6 | 1.3% |
| $10,000 to $14,999 | 26 | 5.7% |
| $15,000 to $24,999 | 70 | 15.3% |
| $25,000 to $34,999 | 12 | 2.6% |
| $35,000 to $49,999 | 100 | 21.8% |
| $50,000 to $74,999 | 93 | 20.3% |
| $75,000 to $99,999 | 36 | 7.8% |
| $100,000 to $149,999 | 72 | 15.7% |
| $150,000 to $199,999 | 16 | 3.5% |
| $200,000+ | 28 | 6.1% |
Household Income by Householder Age in Lincoln
The median household income in Lincoln is $58,125, with the highest median household income of $64,000 found in the 45 to 64 years age bracket for the primary householder. A total of 134 households (29.2%) fall into this category. Meanwhile, the 15 to 24 years age bracket for the primary householder has the lowest median household income of $0, with 3 households (0.6%) in this group.
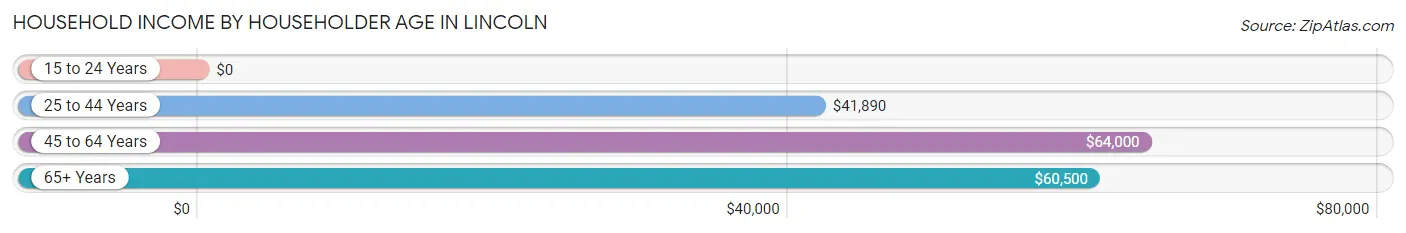
| Income Bracket | # Households | Median Income |
| 15 to 24 Years | 3 (0.6%) | $0 |
| 25 to 44 Years | 146 (31.8%) | $41,890 |
| 45 to 64 Years | 134 (29.2%) | $64,000 |
| 65+ Years | 176 (38.3%) | $60,500 |
| Total | 459 (100.0%) | $58,125 |
Poverty in Lincoln
Income Below Poverty by Sex and Age in Lincoln
With 4.5% poverty level for males and 10.0% for females among the residents of Lincoln, 65 to 74 year old males and 75 year old and over females are the most vulnerable to poverty, with 8 males (17.0%) and 11 females (30.6%) in their respective age groups living below the poverty level.
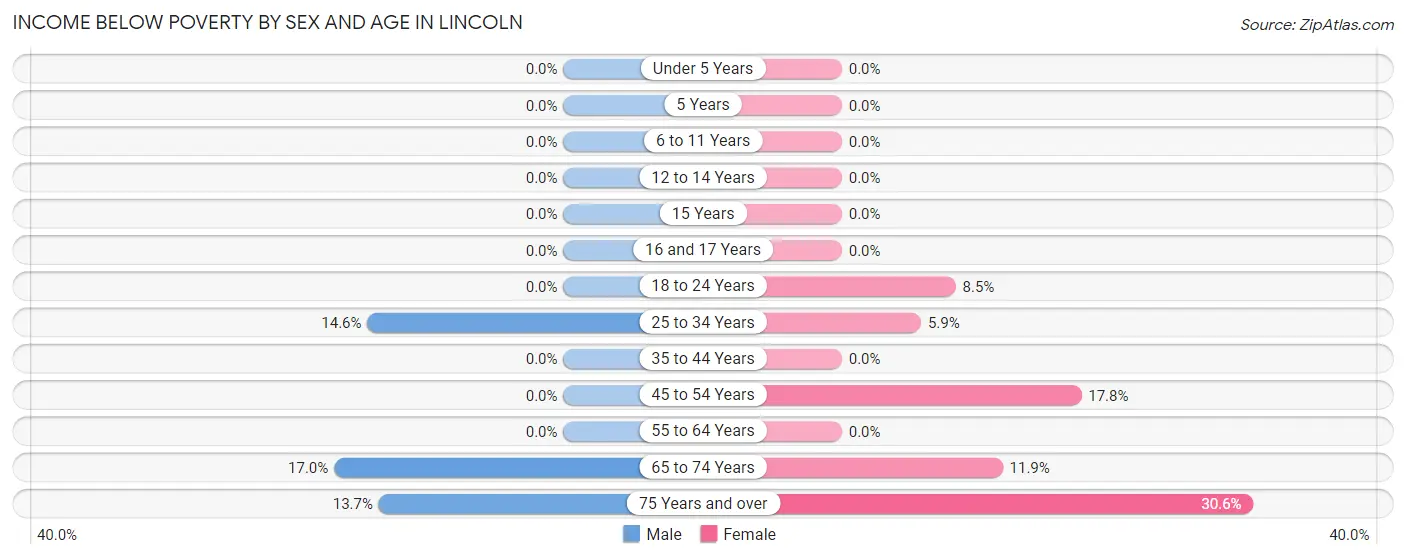
| Age Bracket | Male | Female |
| Under 5 Years | 0 (0.0%) | 0 (0.0%) |
| 5 Years | 0 (0.0%) | 0 (0.0%) |
| 6 to 11 Years | 0 (0.0%) | 0 (0.0%) |
| 12 to 14 Years | 0 (0.0%) | 0 (0.0%) |
| 15 Years | 0 (0.0%) | 0 (0.0%) |
| 16 and 17 Years | 0 (0.0%) | 0 (0.0%) |
| 18 to 24 Years | 0 (0.0%) | 6 (8.5%) |
| 25 to 34 Years | 8 (14.5%) | 3 (5.9%) |
| 35 to 44 Years | 0 (0.0%) | 0 (0.0%) |
| 45 to 54 Years | 0 (0.0%) | 8 (17.8%) |
| 55 to 64 Years | 0 (0.0%) | 0 (0.0%) |
| 65 to 74 Years | 8 (17.0%) | 16 (11.9%) |
| 75 Years and over | 10 (13.7%) | 11 (30.6%) |
| Total | 26 (4.5%) | 44 (10.0%) |
Income Above Poverty by Sex and Age in Lincoln
According to the poverty statistics in Lincoln, males aged under 5 years and females aged 5 years are the age groups that are most secure financially, with 100.0% of males and 100.0% of females in these age groups living above the poverty line.
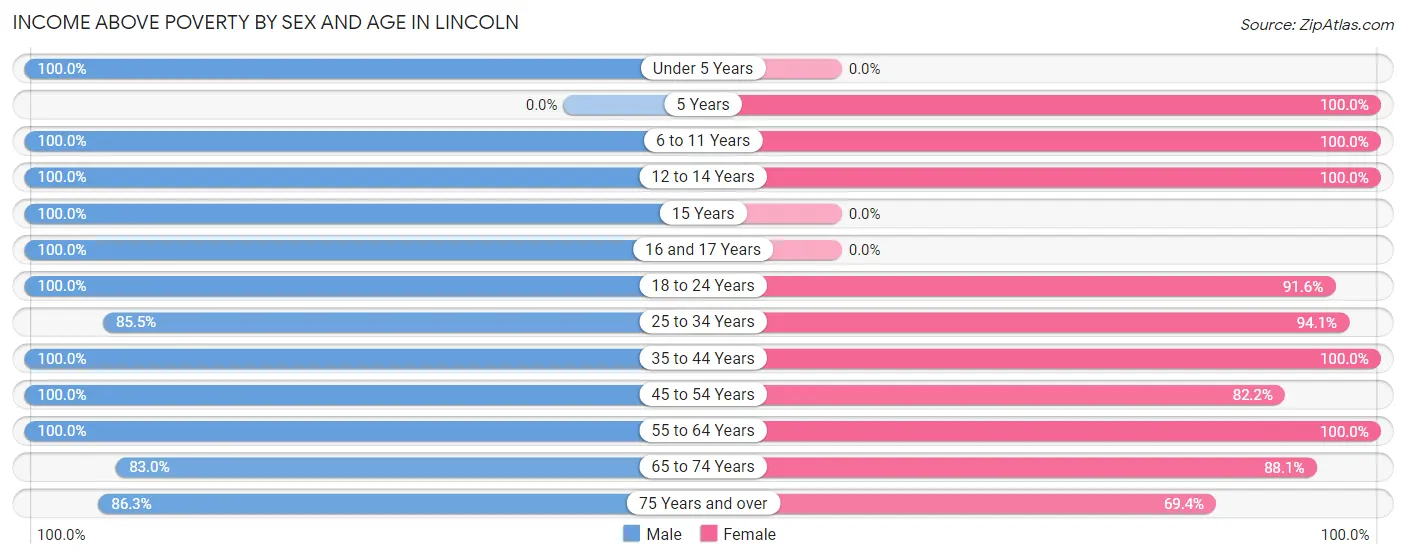
| Age Bracket | Male | Female |
| Under 5 Years | 17 (100.0%) | 0 (0.0%) |
| 5 Years | 0 (0.0%) | 4 (100.0%) |
| 6 to 11 Years | 93 (100.0%) | 14 (100.0%) |
| 12 to 14 Years | 15 (100.0%) | 4 (100.0%) |
| 15 Years | 9 (100.0%) | 0 (0.0%) |
| 16 and 17 Years | 21 (100.0%) | 0 (0.0%) |
| 18 to 24 Years | 18 (100.0%) | 65 (91.5%) |
| 25 to 34 Years | 47 (85.5%) | 48 (94.1%) |
| 35 to 44 Years | 96 (100.0%) | 20 (100.0%) |
| 45 to 54 Years | 81 (100.0%) | 37 (82.2%) |
| 55 to 64 Years | 53 (100.0%) | 60 (100.0%) |
| 65 to 74 Years | 39 (83.0%) | 118 (88.1%) |
| 75 Years and over | 63 (86.3%) | 25 (69.4%) |
| Total | 552 (95.5%) | 395 (90.0%) |
Income Below Poverty Among Married-Couple Families in Lincoln
The poverty statistics for married-couple families in Lincoln show that 3.9% or 7 of the total 179 families live below the poverty line. Families with no children have the highest poverty rate of 4.9%, comprising of 7 families. On the other hand, families with 1 or 2 children have the lowest poverty rate of 0.0%, which includes 0 families.
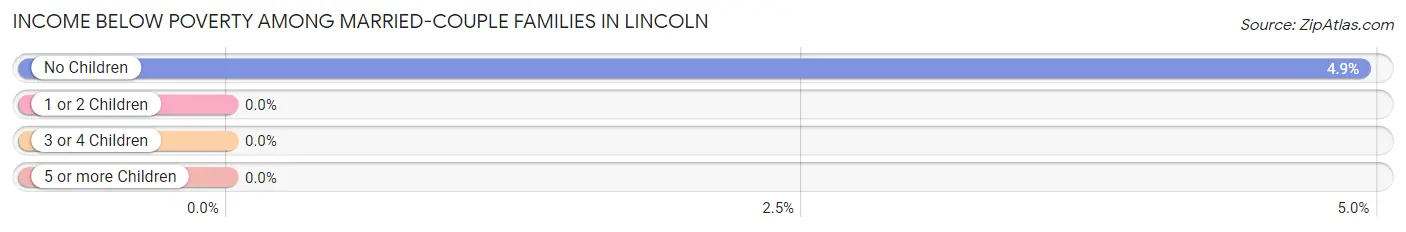
| Children | Above Poverty | Below Poverty |
| No Children | 135 (95.1%) | 7 (4.9%) |
| 1 or 2 Children | 37 (100.0%) | 0 (0.0%) |
| 3 or 4 Children | 0 (0.0%) | 0 (0.0%) |
| 5 or more Children | 0 (0.0%) | 0 (0.0%) |
| Total | 172 (96.1%) | 7 (3.9%) |
Income Below Poverty Among Single-Parent Households in Lincoln
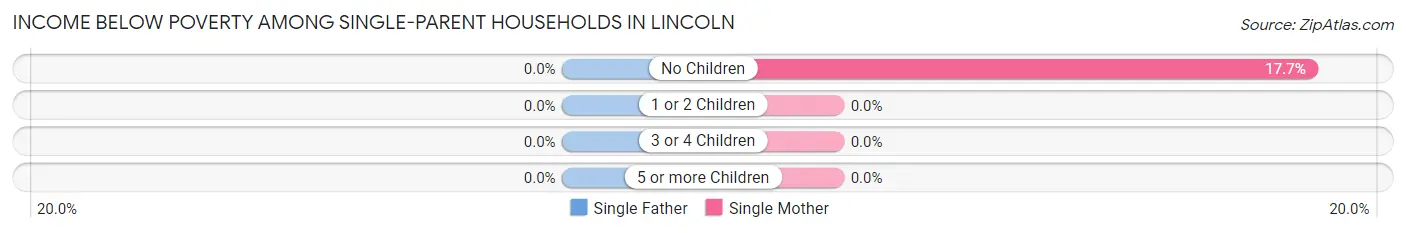
| Children | Single Father | Single Mother |
| No Children | 0 (0.0%) | 3 (17.6%) |
| 1 or 2 Children | 0 (0.0%) | 0 (0.0%) |
| 3 or 4 Children | 0 (0.0%) | 0 (0.0%) |
| 5 or more Children | 0 (0.0%) | 0 (0.0%) |
| Total | 0 (0.0%) | 3 (13.0%) |
Income Below Poverty Among Married-Couple vs Single-Parent Households in Lincoln
The poverty data for Lincoln shows that 7 of the married-couple family households (3.9%) and 3 of the single-parent households (2.2%) are living below the poverty level. Within the married-couple family households, those with no children have the highest poverty rate, with 7 households (4.9%) falling below the poverty line. Among the single-parent households, those with no children have the highest poverty rate, with 3 household (17.6%) living below poverty.
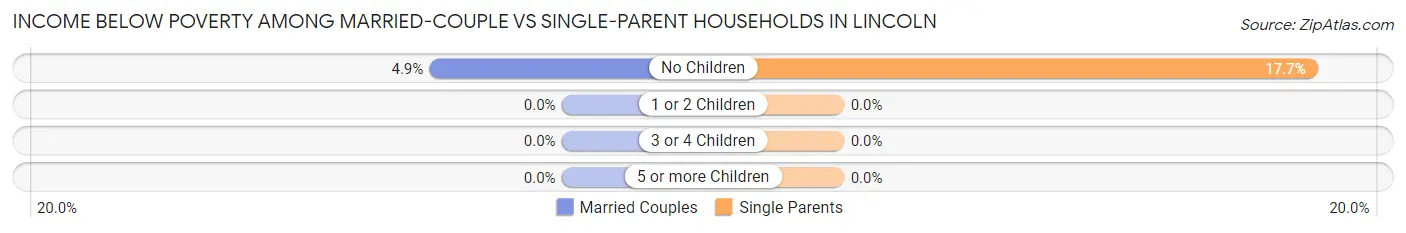
| Children | Married-Couple Families | Single-Parent Households |
| No Children | 7 (4.9%) | 3 (17.6%) |
| 1 or 2 Children | 0 (0.0%) | 0 (0.0%) |
| 3 or 4 Children | 0 (0.0%) | 0 (0.0%) |
| 5 or more Children | 0 (0.0%) | 0 (0.0%) |
| Total | 7 (3.9%) | 3 (2.2%) |
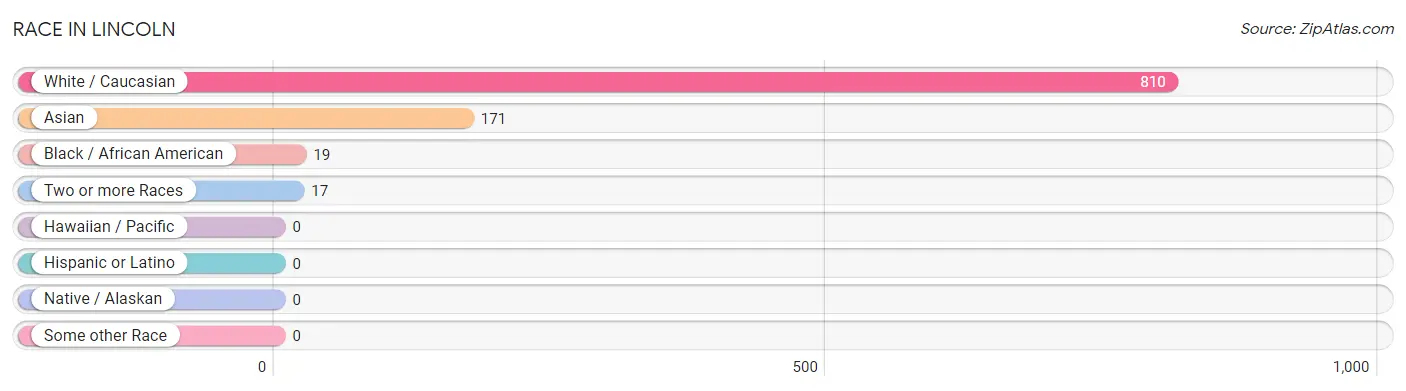
Race in Lincoln
The most populous races in Lincoln are White / Caucasian (810 | 79.6%), Asian (171 | 16.8%), and Black / African American (19 | 1.9%).
| Race | # Population | % Population |
| Asian | 171 | 16.8% |
| Black / African American | 19 | 1.9% |
| Hawaiian / Pacific | 0 | 0.0% |
| Hispanic or Latino | 0 | 0.0% |
| Native / Alaskan | 0 | 0.0% |
| White / Caucasian | 810 | 79.6% |
| Two or more Races | 17 | 1.7% |
| Some other Race | 0 | 0.0% |
| Total | 1,017 | 100.0% |
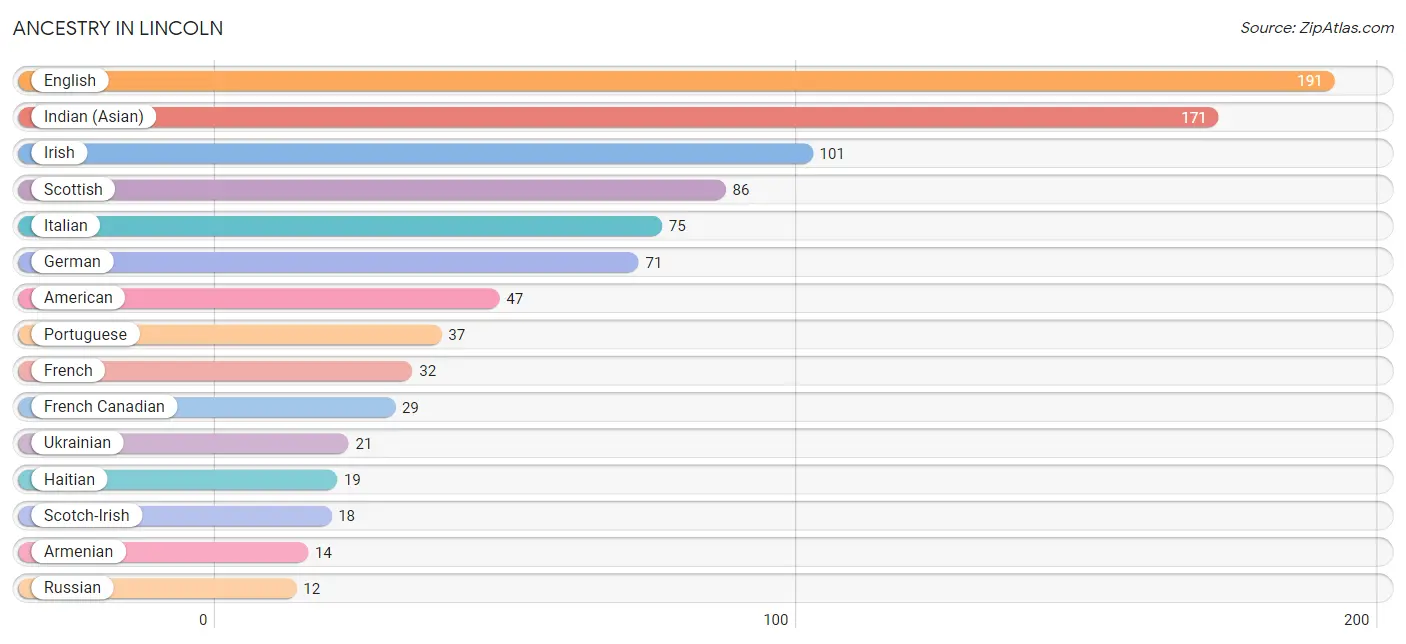
Ancestry in Lincoln
The most populous ancestries reported in Lincoln are English (191 | 18.8%), Indian (Asian) (171 | 16.8%), Irish (101 | 9.9%), Scottish (86 | 8.5%), and Italian (75 | 7.4%), together accounting for 61.3% of all Lincoln residents.
| Ancestry | # Population | % Population |
| American | 47 | 4.6% |
| Armenian | 14 | 1.4% |
| Belgian | 2 | 0.2% |
| British | 8 | 0.8% |
| Dutch | 10 | 1.0% |
| Eastern European | 3 | 0.3% |
| English | 191 | 18.8% |
| French | 32 | 3.2% |
| French Canadian | 29 | 2.9% |
| German | 71 | 7.0% |
| Greek | 3 | 0.3% |
| Haitian | 19 | 1.9% |
| Indian (Asian) | 171 | 16.8% |
| Irish | 101 | 9.9% |
| Italian | 75 | 7.4% |
| Norwegian | 11 | 1.1% |
| Polish | 8 | 0.8% |
| Portuguese | 37 | 3.6% |
| Russian | 12 | 1.2% |
| Scotch-Irish | 18 | 1.8% |
| Scottish | 86 | 8.5% |
| Swedish | 8 | 0.8% |
| Ukrainian | 21 | 2.1% |
| Welsh | 2 | 0.2% | View All 24 Rows |
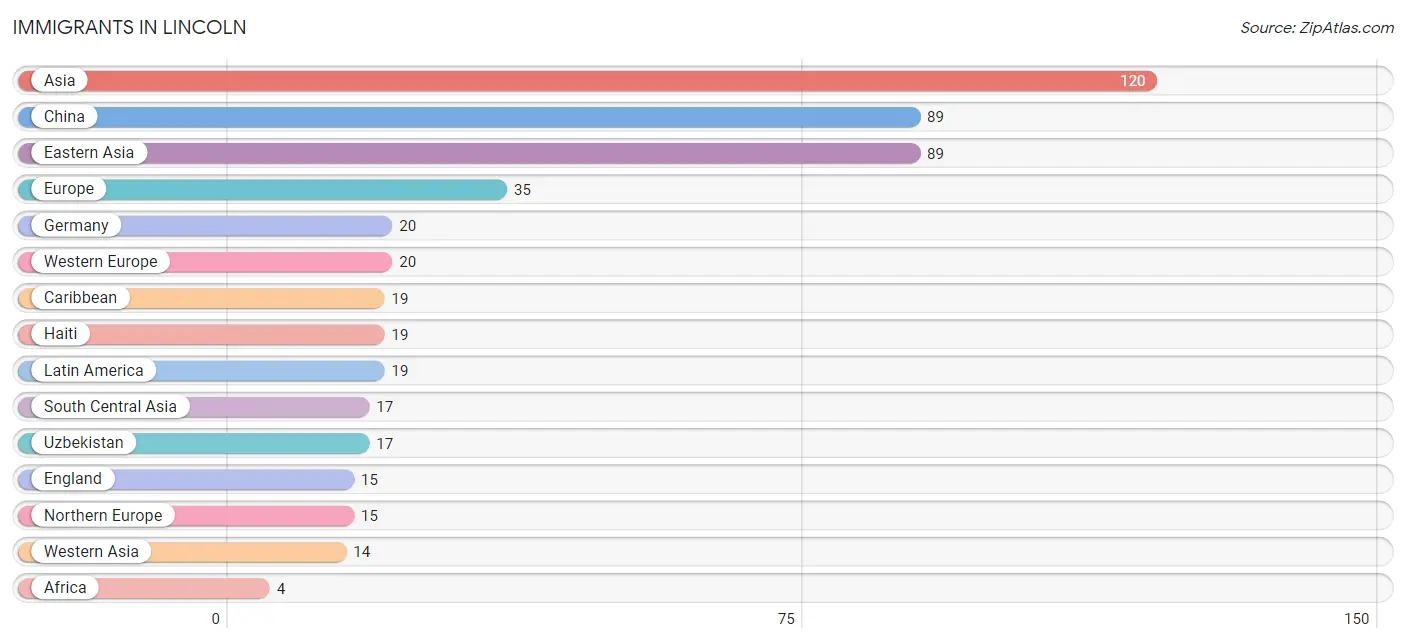
Immigrants in Lincoln
The most numerous immigrant groups reported in Lincoln came from Asia (120 | 11.8%), China (89 | 8.7%), Eastern Asia (89 | 8.7%), Europe (35 | 3.4%), and Germany (20 | 2.0%), together accounting for 34.7% of all Lincoln residents.
| Immigration Origin | # Population | % Population |
| Africa | 4 | 0.4% |
| Asia | 120 | 11.8% |
| Caribbean | 19 | 1.9% |
| China | 89 | 8.7% |
| Eastern Africa | 4 | 0.4% |
| Eastern Asia | 89 | 8.7% |
| England | 15 | 1.5% |
| Europe | 35 | 3.4% |
| Germany | 20 | 2.0% |
| Haiti | 19 | 1.9% |
| Latin America | 19 | 1.9% |
| Northern Europe | 15 | 1.5% |
| South Central Asia | 17 | 1.7% |
| Uzbekistan | 17 | 1.7% |
| Western Asia | 14 | 1.4% |
| Western Europe | 20 | 2.0% |
| Zimbabwe | 4 | 0.4% | View All 17 Rows |
Sex and Age in Lincoln
Sex and Age in Lincoln
The most populous age groups in Lincoln are 10 to 14 Years (100 | 17.3%) for men and 70 to 74 Years (103 | 23.5%) for women.
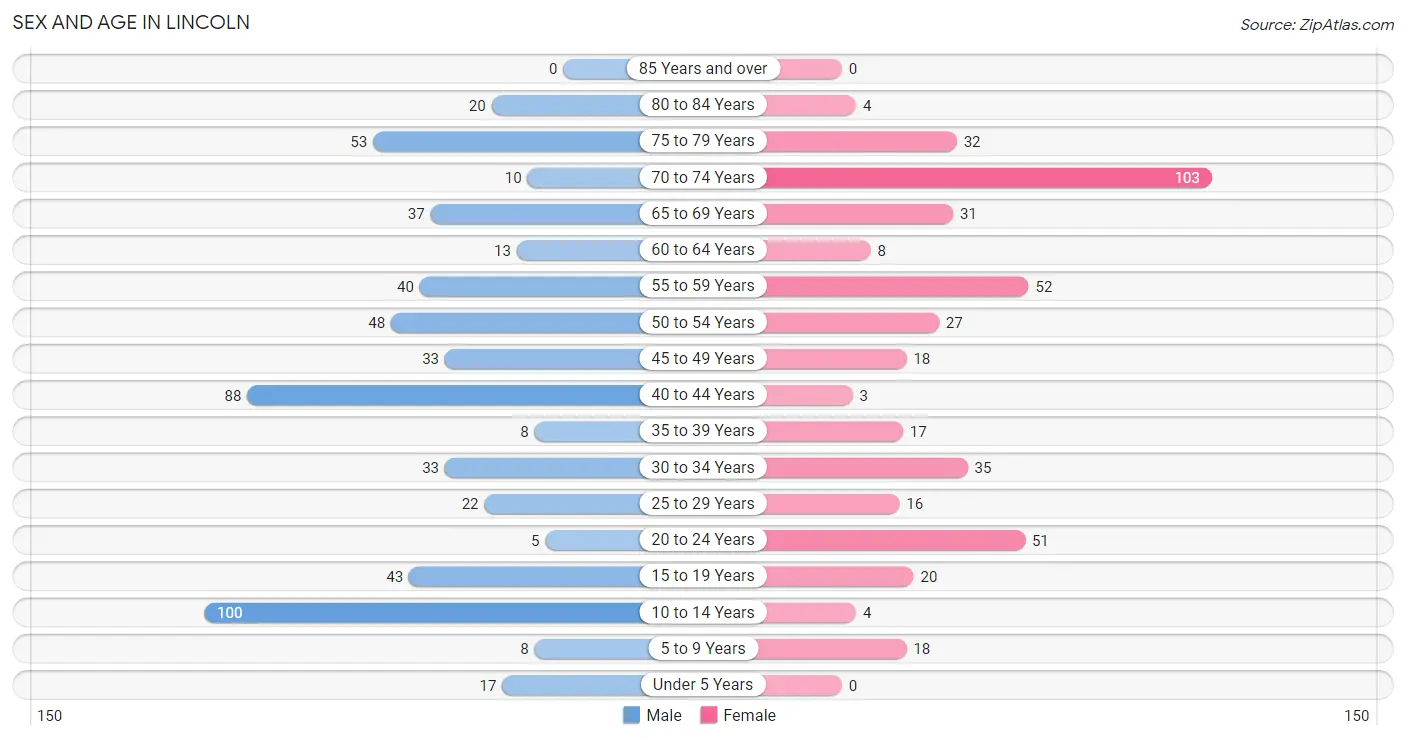
| Age Bracket | Male | Female |
| Under 5 Years | 17 (2.9%) | 0 (0.0%) |
| 5 to 9 Years | 8 (1.4%) | 18 (4.1%) |
| 10 to 14 Years | 100 (17.3%) | 4 (0.9%) |
| 15 to 19 Years | 43 (7.4%) | 20 (4.6%) |
| 20 to 24 Years | 5 (0.9%) | 51 (11.6%) |
| 25 to 29 Years | 22 (3.8%) | 16 (3.6%) |
| 30 to 34 Years | 33 (5.7%) | 35 (8.0%) |
| 35 to 39 Years | 8 (1.4%) | 17 (3.9%) |
| 40 to 44 Years | 88 (15.2%) | 3 (0.7%) |
| 45 to 49 Years | 33 (5.7%) | 18 (4.1%) |
| 50 to 54 Years | 48 (8.3%) | 27 (6.1%) |
| 55 to 59 Years | 40 (6.9%) | 52 (11.8%) |
| 60 to 64 Years | 13 (2.2%) | 8 (1.8%) |
| 65 to 69 Years | 37 (6.4%) | 31 (7.1%) |
| 70 to 74 Years | 10 (1.7%) | 103 (23.5%) |
| 75 to 79 Years | 53 (9.2%) | 32 (7.3%) |
| 80 to 84 Years | 20 (3.5%) | 4 (0.9%) |
| 85 Years and over | 0 (0.0%) | 0 (0.0%) |
| Total | 578 (100.0%) | 439 (100.0%) |
Families and Households in Lincoln
Median Family Size in Lincoln
The median family size in Lincoln is 2.51 persons per family, with single female/mother families (23 | 7.3%) accounting for the largest median family size of 4.35 persons per family. On the other hand, single male/father families (112 | 35.7%) represent the smallest median family size with 2.03 persons per family.
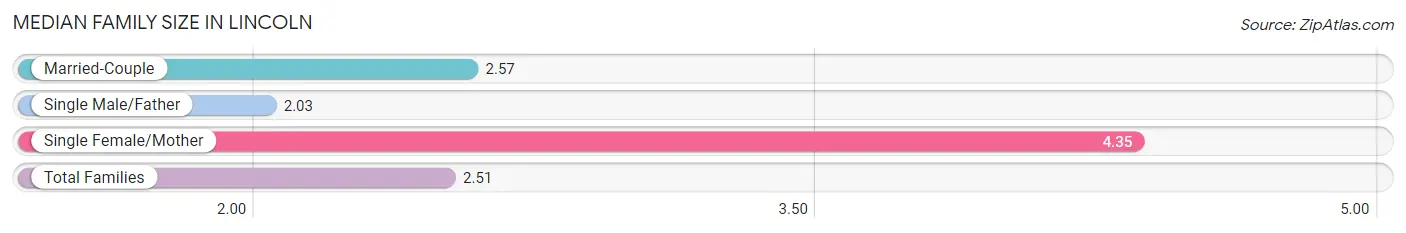
| Family Type | # Families | Family Size |
| Married-Couple | 179 (57.0%) | 2.57 |
| Single Male/Father | 112 (35.7%) | 2.03 |
| Single Female/Mother | 23 (7.3%) | 4.35 |
| Total Families | 314 (100.0%) | 2.51 |
Median Household Size in Lincoln
The median household size in Lincoln is 2.22 persons per household, with single female/mother households (23 | 5.0%) accounting for the largest median household size of 4.87 persons per household. non-family households (145 | 31.6%) represent the smallest median household size with 1.44 persons per household.
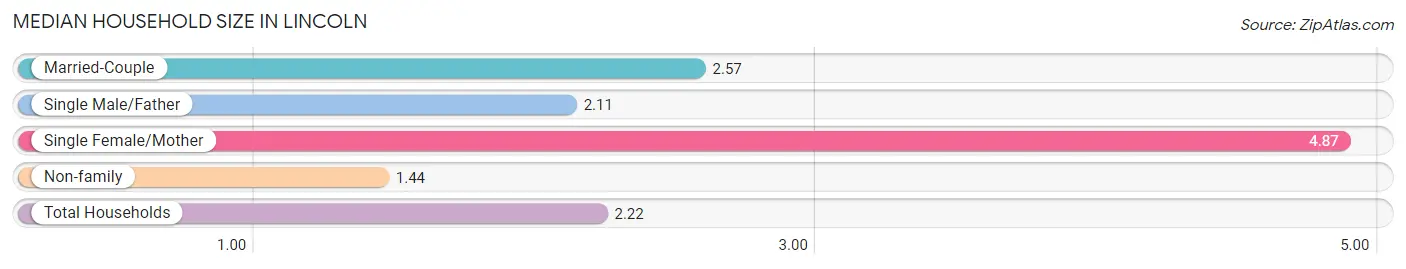
| Household Type | # Households | Household Size |
| Married-Couple | 179 (39.0%) | 2.57 |
| Single Male/Father | 112 (24.4%) | 2.11 |
| Single Female/Mother | 23 (5.0%) | 4.87 |
| Non-family | 145 (31.6%) | 1.44 |
| Total Households | 459 (100.0%) | 2.22 |
Household Size by Marriage Status in Lincoln
Out of a total of 459 households in Lincoln, 314 (68.4%) are family households, while 145 (31.6%) are nonfamily households. The most numerous type of family households are 2-person households, comprising 150, and the most common type of nonfamily households are 1-person households, comprising 110.
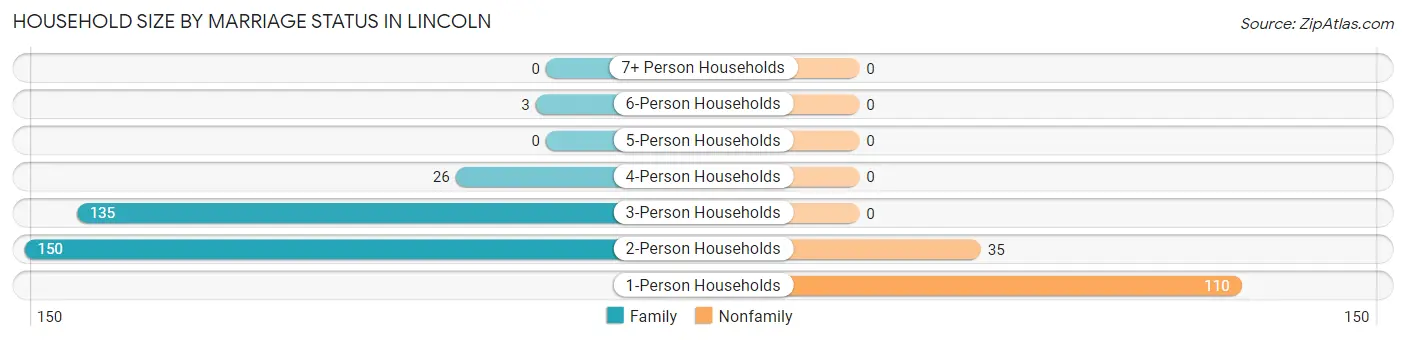
| Household Size | Family Households | Nonfamily Households |
| 1-Person Households | - | 110 (24.0%) |
| 2-Person Households | 150 (32.7%) | 35 (7.6%) |
| 3-Person Households | 135 (29.4%) | 0 (0.0%) |
| 4-Person Households | 26 (5.7%) | 0 (0.0%) |
| 5-Person Households | 0 (0.0%) | 0 (0.0%) |
| 6-Person Households | 3 (0.6%) | 0 (0.0%) |
| 7+ Person Households | 0 (0.0%) | 0 (0.0%) |
| Total | 314 (68.4%) | 145 (31.6%) |
Female Fertility in Lincoln
Fertility by Age in Lincoln
Average fertility rate in Lincoln is 86.0 births per 1,000 women. Women in the age bracket of 35 to 50 years have the highest fertility rate with 341.0 births per 1,000 women. Women in the age bracket of 35 to 50 years acount for 100.0% of all women with births.
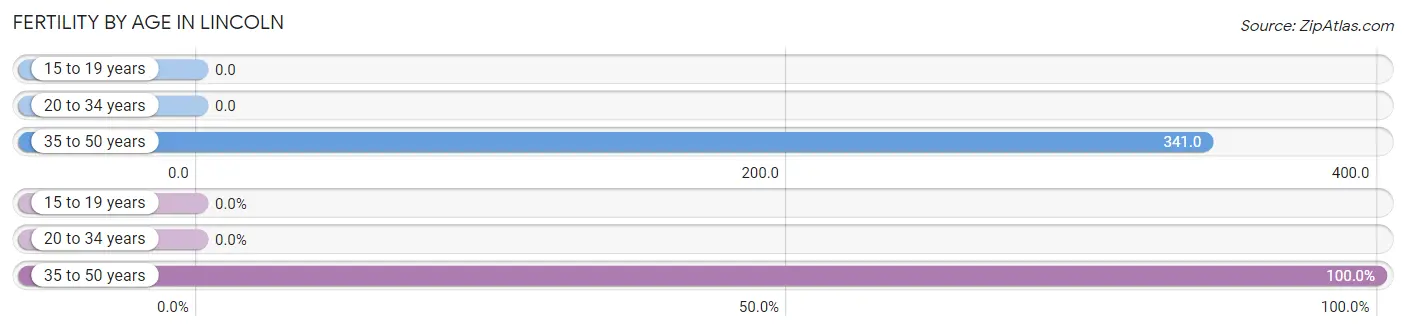
| Age Bracket | Women with Births | Births / 1,000 Women |
| 15 to 19 years | 0 (0.0%) | 0.0 |
| 20 to 34 years | 0 (0.0%) | 0.0 |
| 35 to 50 years | 14 (100.0%) | 341.0 |
| Total | 14 (100.0%) | 86.0 |
Fertility by Age by Marriage Status in Lincoln
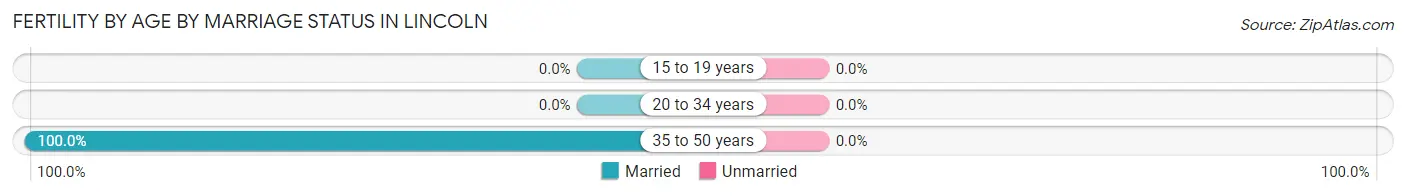
| Age Bracket | Married | Unmarried |
| 15 to 19 years | 0 (0.0%) | 0 (0.0%) |
| 20 to 34 years | 0 (0.0%) | 0 (0.0%) |
| 35 to 50 years | 14 (100.0%) | 0 (0.0%) |
| Total | 14 (100.0%) | 0 (0.0%) |
Fertility by Education in Lincoln
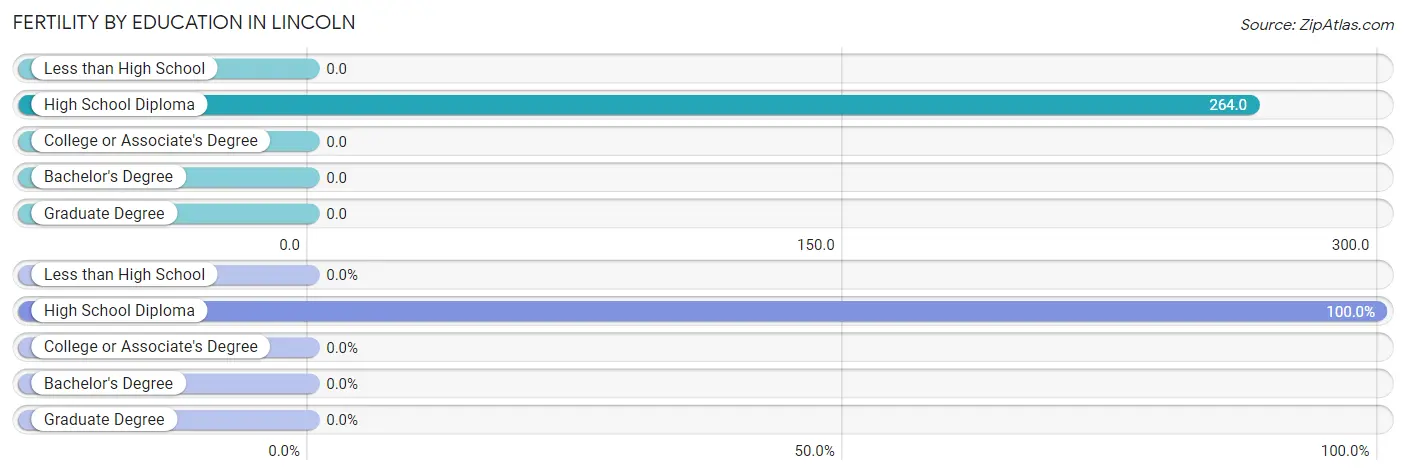
| Educational Attainment | Women with Births | Births / 1,000 Women |
| Less than High School | 0 (0.0%) | 0.0 |
| High School Diploma | 14 (100.0%) | 264.0 |
| College or Associate's Degree | 0 (0.0%) | 0.0 |
| Bachelor's Degree | 0 (0.0%) | 0.0 |
| Graduate Degree | 0 (0.0%) | 0.0 |
| Total | 14 (100.0%) | 86.0 |
Fertility by Education by Marriage Status in Lincoln
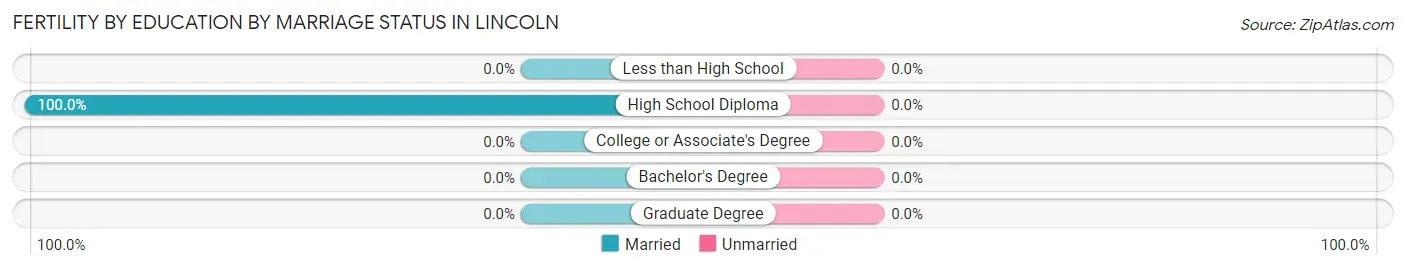
| Educational Attainment | Married | Unmarried |
| Less than High School | 0 (0.0%) | 0 (0.0%) |
| High School Diploma | 14 (100.0%) | 0 (0.0%) |
| College or Associate's Degree | 0 (0.0%) | 0 (0.0%) |
| Bachelor's Degree | 0 (0.0%) | 0 (0.0%) |
| Graduate Degree | 0 (0.0%) | 0 (0.0%) |
| Total | 14 (100.0%) | 0 (0.0%) |
Employment Characteristics in Lincoln
Employment by Class of Employer in Lincoln
Among the 502 employed individuals in Lincoln, private company employees (422 | 84.1%), not-for-profit organizations (35 | 7.0%), and self-employed (not incorporated) (27 | 5.4%) make up the most common classes of employment.
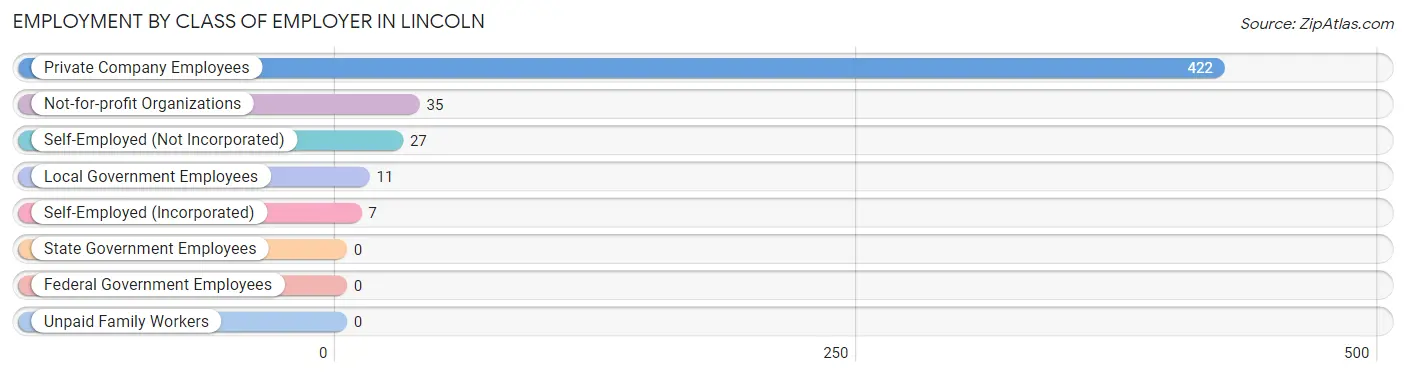
| Employer Class | # Employees | % Employees |
| Private Company Employees | 422 | 84.1% |
| Self-Employed (Incorporated) | 7 | 1.4% |
| Self-Employed (Not Incorporated) | 27 | 5.4% |
| Not-for-profit Organizations | 35 | 7.0% |
| Local Government Employees | 11 | 2.2% |
| State Government Employees | 0 | 0.0% |
| Federal Government Employees | 0 | 0.0% |
| Unpaid Family Workers | 0 | 0.0% |
| Total | 502 | 100.0% |
Employment Status by Age in Lincoln
According to the labor force statistics for Lincoln, out of the total population over 16 years of age (861), 62.1% or 535 individuals are in the labor force, with 2.4% or 13 of them unemployed. The age group with the highest labor force participation rate is 20 to 24 years, with 100.0% or 56 individuals in the labor force. Within the labor force, the 16 to 19 years age range has the highest percentage of unemployed individuals, with 56.5% or 13 of them being unemployed.
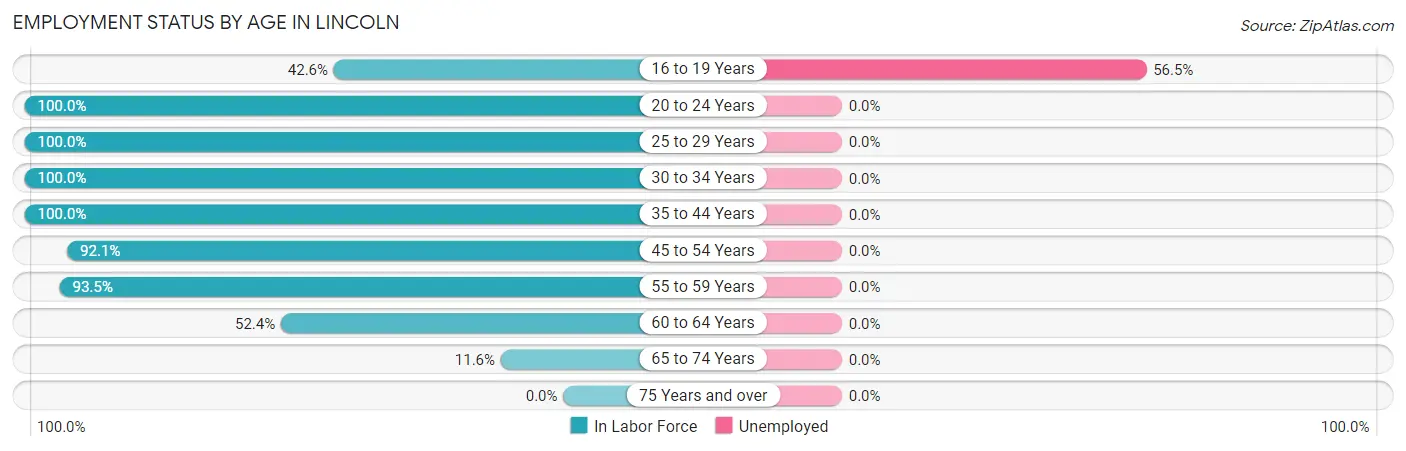
| Age Bracket | In Labor Force | Unemployed |
| 16 to 19 Years | 23 (42.6%) | 13 (56.5%) |
| 20 to 24 Years | 56 (100.0%) | 0 (0.0%) |
| 25 to 29 Years | 38 (100.0%) | 0 (0.0%) |
| 30 to 34 Years | 68 (100.0%) | 0 (0.0%) |
| 35 to 44 Years | 116 (100.0%) | 0 (0.0%) |
| 45 to 54 Years | 116 (92.1%) | 0 (0.0%) |
| 55 to 59 Years | 86 (93.5%) | 0 (0.0%) |
| 60 to 64 Years | 11 (52.4%) | 0 (0.0%) |
| 65 to 74 Years | 21 (11.6%) | 0 (0.0%) |
| 75 Years and over | 0 (0.0%) | 0 (0.0%) |
| Total | 535 (62.1%) | 13 (2.4%) |
Employment Status by Educational Attainment in Lincoln
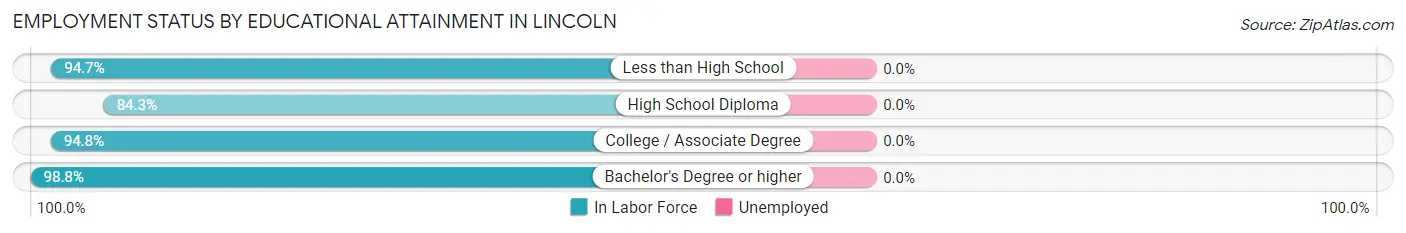
| Educational Attainment | In Labor Force | Unemployed |
| Less than High School | 89 (94.7%) | 0 (0.0%) |
| High School Diploma | 70 (84.3%) | 0 (0.0%) |
| College / Associate Degree | 109 (94.8%) | 0 (0.0%) |
| Bachelor's Degree or higher | 167 (98.8%) | 0 (0.0%) |
| Total | 435 (94.4%) | 0 (0.0%) |
Employment Occupations by Sex in Lincoln
Management, Business, Science and Arts Occupations
The most common Management, Business, Science and Arts occupations in Lincoln are Management (171 | 32.8%), Computers, Engineering & Science (22 | 4.2%), Business & Financial (13 | 2.5%), Community & Social Service (13 | 2.5%), and Computers & Mathematics (12 | 2.3%).
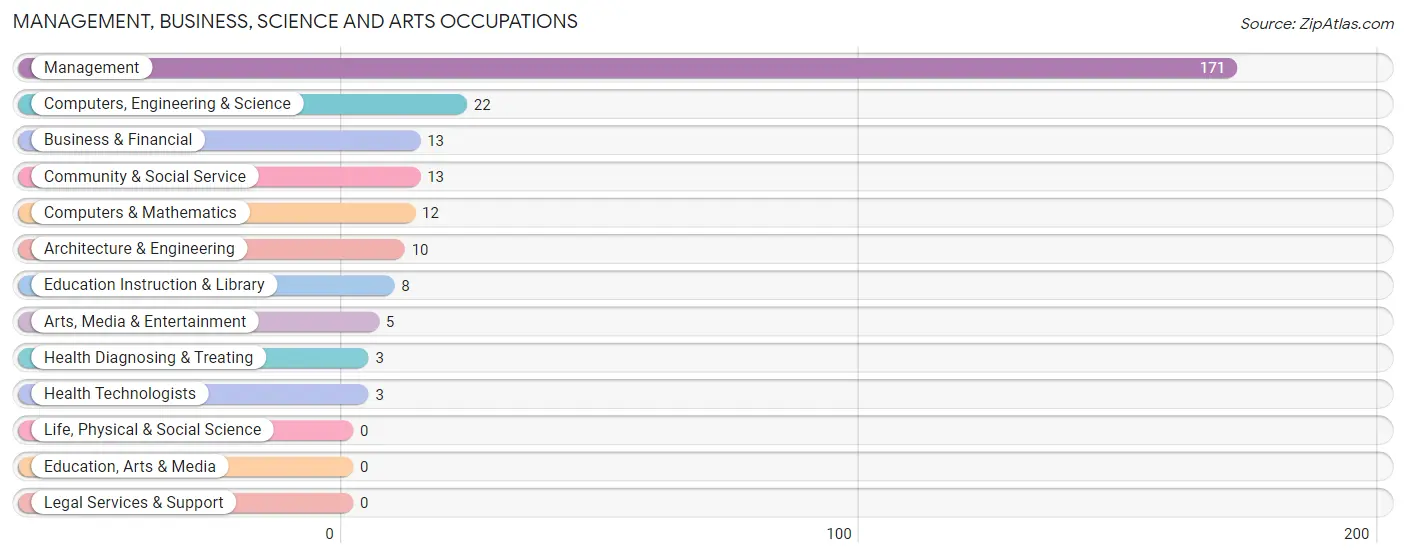
Management, Business, Science and Arts Occupations by Sex
Within the Management, Business, Science and Arts occupations in Lincoln, the most male-oriented occupations are Computers, Engineering & Science (100.0%), Computers & Mathematics (100.0%), and Architecture & Engineering (100.0%), while the most female-oriented occupations are Business & Financial (100.0%), Health Diagnosing & Treating (100.0%), and Health Technologists (100.0%).
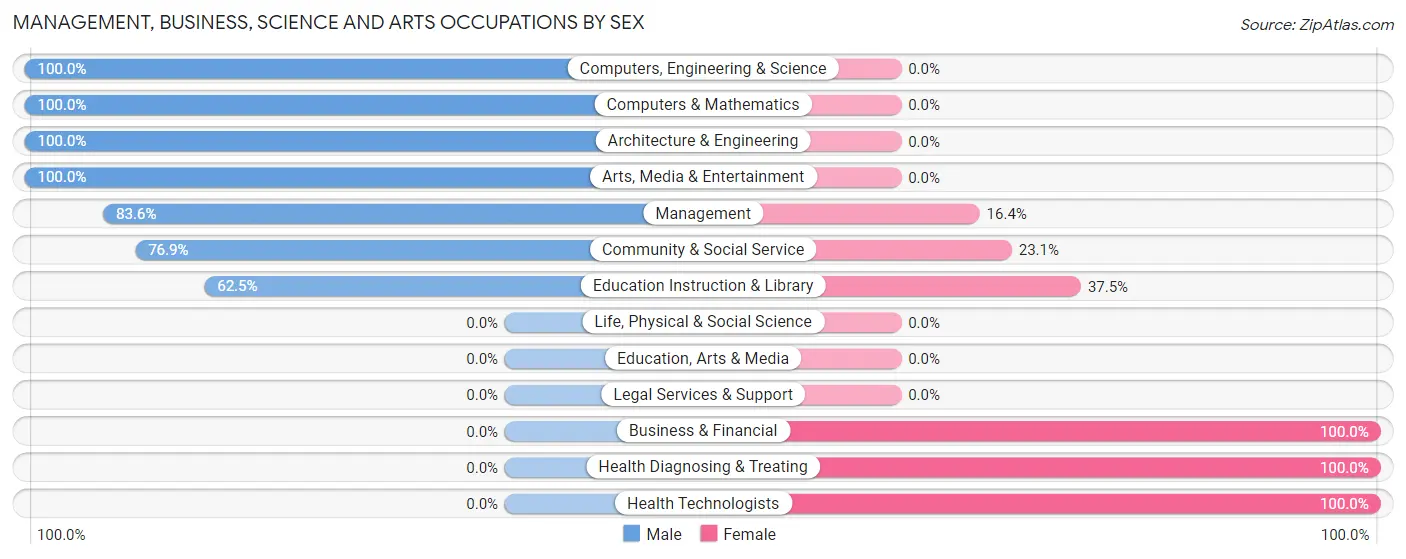
| Occupation | Male | Female |
| Management | 143 (83.6%) | 28 (16.4%) |
| Business & Financial | 0 (0.0%) | 13 (100.0%) |
| Computers, Engineering & Science | 22 (100.0%) | 0 (0.0%) |
| Computers & Mathematics | 12 (100.0%) | 0 (0.0%) |
| Architecture & Engineering | 10 (100.0%) | 0 (0.0%) |
| Life, Physical & Social Science | 0 (0.0%) | 0 (0.0%) |
| Community & Social Service | 10 (76.9%) | 3 (23.1%) |
| Education, Arts & Media | 0 (0.0%) | 0 (0.0%) |
| Legal Services & Support | 0 (0.0%) | 0 (0.0%) |
| Education Instruction & Library | 5 (62.5%) | 3 (37.5%) |
| Arts, Media & Entertainment | 5 (100.0%) | 0 (0.0%) |
| Health Diagnosing & Treating | 0 (0.0%) | 3 (100.0%) |
| Health Technologists | 0 (0.0%) | 3 (100.0%) |
| Total (Category) | 175 (78.8%) | 47 (21.2%) |
| Total (Overall) | 287 (55.0%) | 235 (45.0%) |
Services Occupations
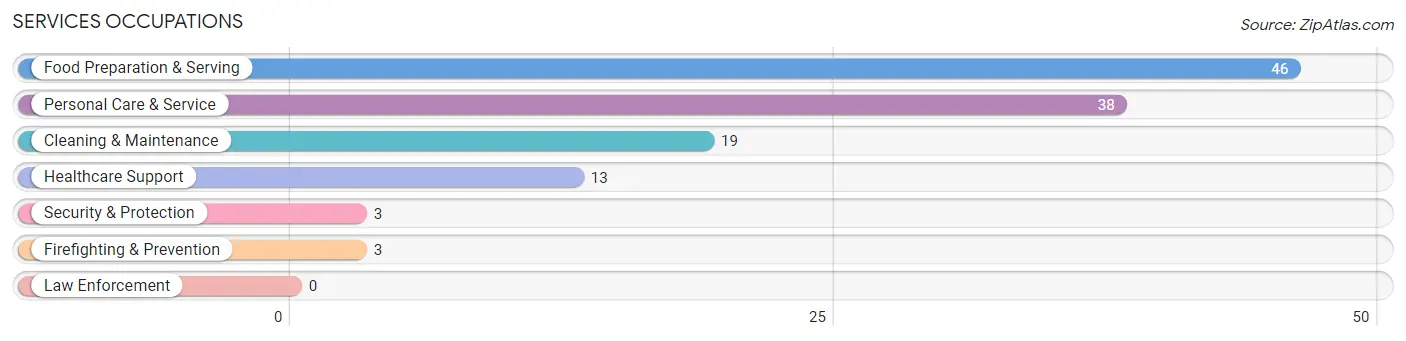
The most common Services occupations in Lincoln are Food Preparation & Serving (46 | 8.8%), Personal Care & Service (38 | 7.3%), Cleaning & Maintenance (19 | 3.6%), Healthcare Support (13 | 2.5%), and Security & Protection (3 | 0.6%).
Services Occupations by Sex
Within the Services occupations in Lincoln, the most male-oriented occupations are Personal Care & Service (31.6%), and Cleaning & Maintenance (26.3%), while the most female-oriented occupations are Healthcare Support (100.0%), Security & Protection (100.0%), and Firefighting & Prevention (100.0%).
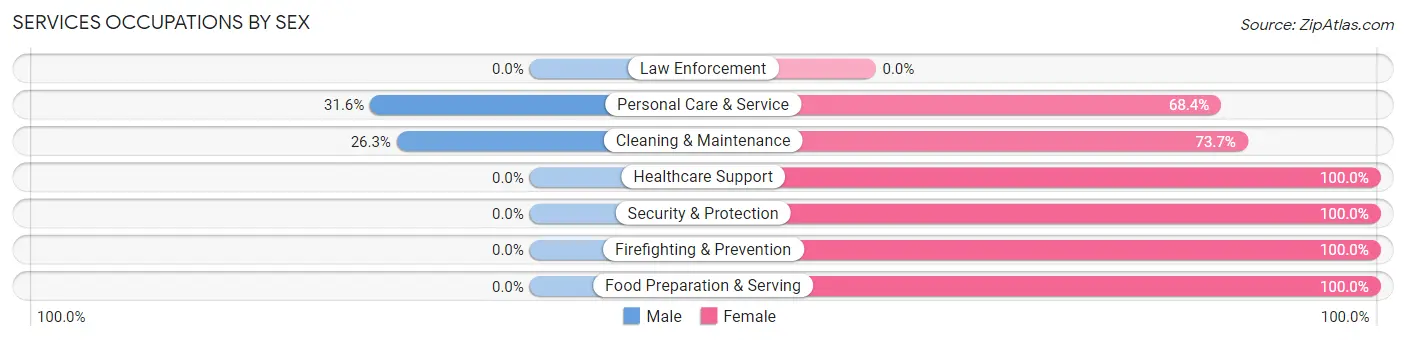
| Occupation | Male | Female |
| Healthcare Support | 0 (0.0%) | 13 (100.0%) |
| Security & Protection | 0 (0.0%) | 3 (100.0%) |
| Firefighting & Prevention | 0 (0.0%) | 3 (100.0%) |
| Law Enforcement | 0 (0.0%) | 0 (0.0%) |
| Food Preparation & Serving | 0 (0.0%) | 46 (100.0%) |
| Cleaning & Maintenance | 5 (26.3%) | 14 (73.7%) |
| Personal Care & Service | 12 (31.6%) | 26 (68.4%) |
| Total (Category) | 17 (14.3%) | 102 (85.7%) |
| Total (Overall) | 287 (55.0%) | 235 (45.0%) |
Sales and Office Occupations
The most common Sales and Office occupations in Lincoln are Office & Administration (65 | 12.4%), and Sales & Related (13 | 2.5%).
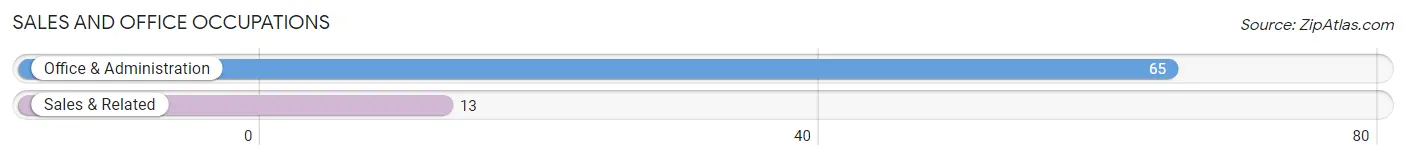
Sales and Office Occupations by Sex
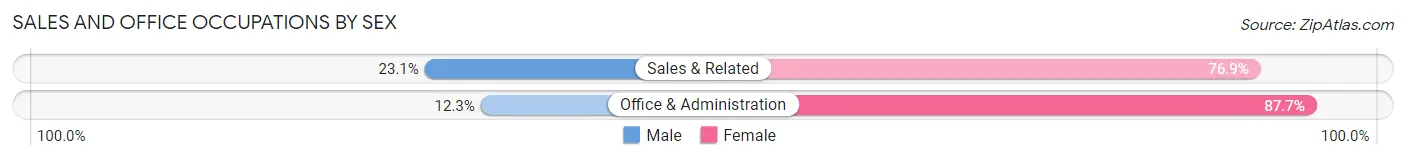
| Occupation | Male | Female |
| Sales & Related | 3 (23.1%) | 10 (76.9%) |
| Office & Administration | 8 (12.3%) | 57 (87.7%) |
| Total (Category) | 11 (14.1%) | 67 (85.9%) |
| Total (Overall) | 287 (55.0%) | 235 (45.0%) |
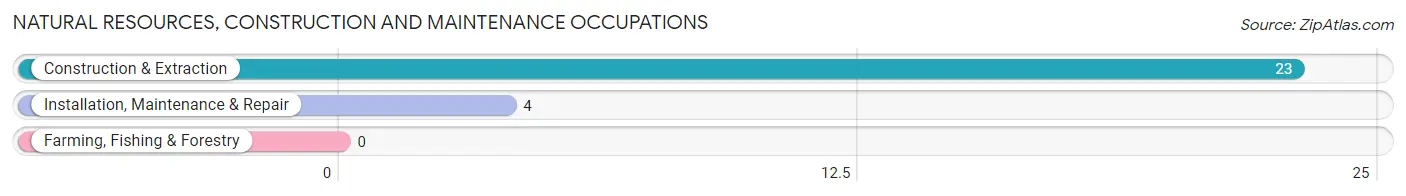
Natural Resources, Construction and Maintenance Occupations
The most common Natural Resources, Construction and Maintenance occupations in Lincoln are Construction & Extraction (23 | 4.4%), and Installation, Maintenance & Repair (4 | 0.8%).
Natural Resources, Construction and Maintenance Occupations by Sex
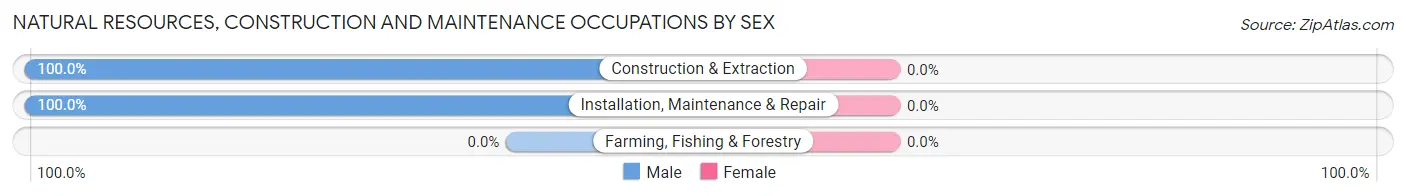
| Occupation | Male | Female |
| Farming, Fishing & Forestry | 0 (0.0%) | 0 (0.0%) |
| Construction & Extraction | 23 (100.0%) | 0 (0.0%) |
| Installation, Maintenance & Repair | 4 (100.0%) | 0 (0.0%) |
| Total (Category) | 27 (100.0%) | 0 (0.0%) |
| Total (Overall) | 287 (55.0%) | 235 (45.0%) |
Production, Transportation and Moving Occupations
The most common Production, Transportation and Moving occupations in Lincoln are Production (53 | 10.2%), Transportation (20 | 3.8%), and Material Moving (3 | 0.6%).
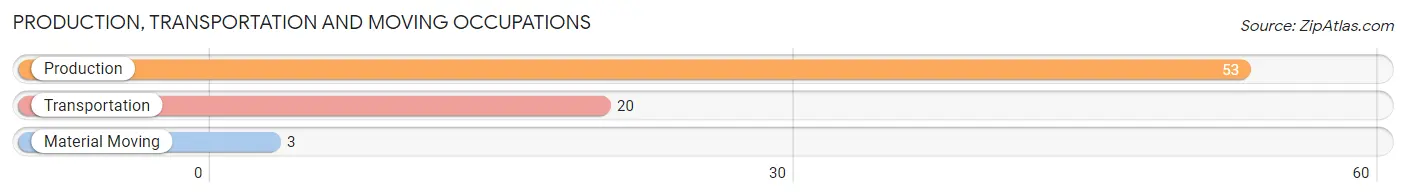
Production, Transportation and Moving Occupations by Sex
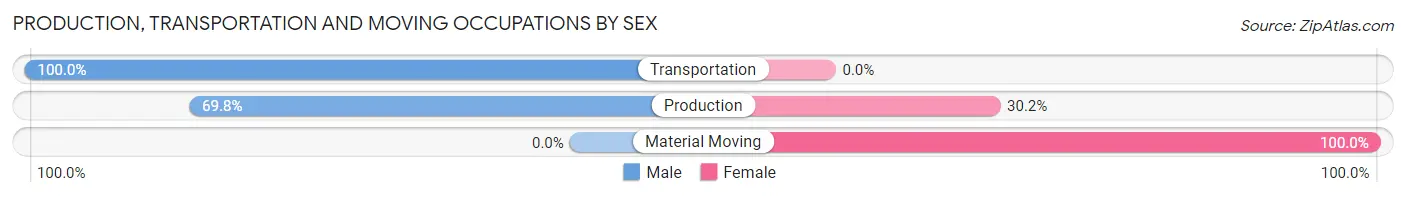
| Occupation | Male | Female |
| Production | 37 (69.8%) | 16 (30.2%) |
| Transportation | 20 (100.0%) | 0 (0.0%) |
| Material Moving | 0 (0.0%) | 3 (100.0%) |
| Total (Category) | 57 (75.0%) | 19 (25.0%) |
| Total (Overall) | 287 (55.0%) | 235 (45.0%) |
Employment Industries by Sex in Lincoln
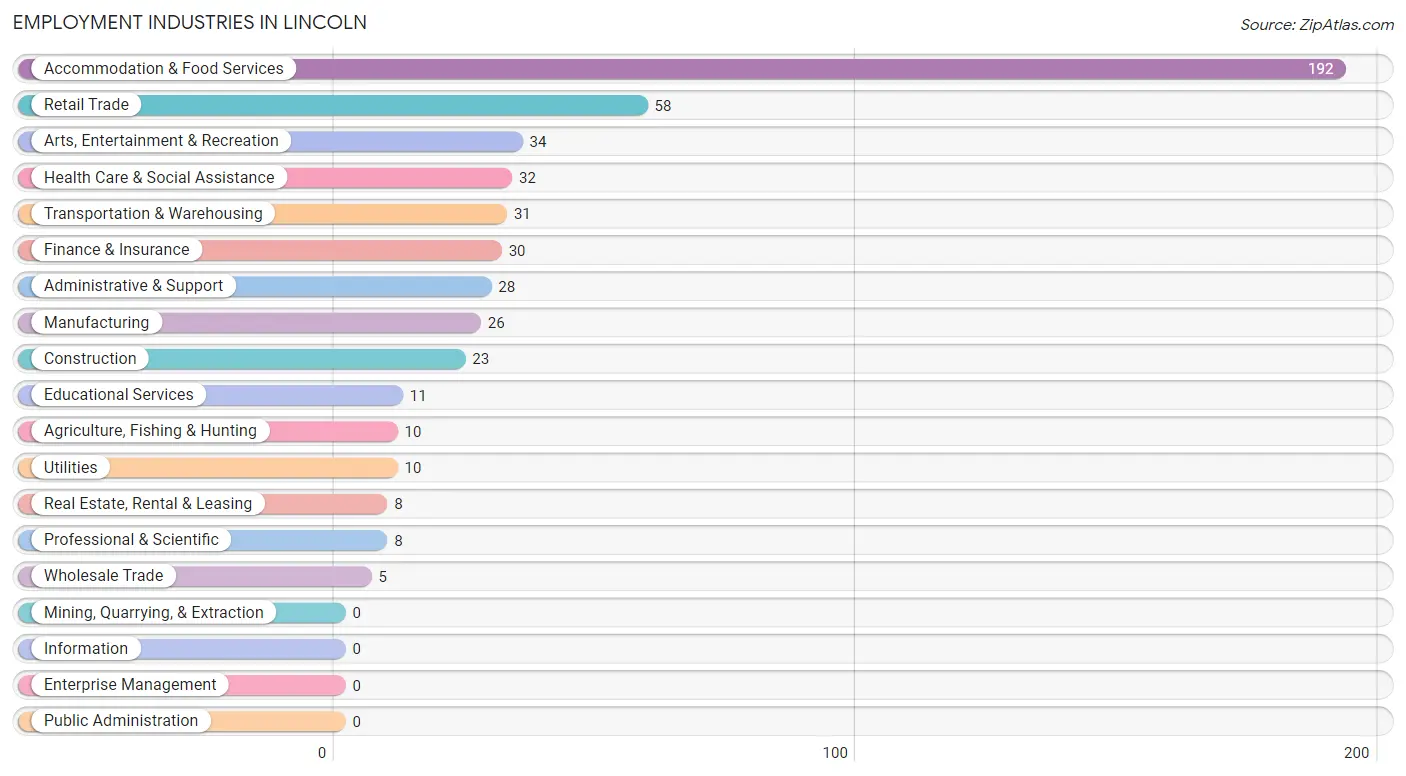
Employment Industries in Lincoln
The major employment industries in Lincoln include Accommodation & Food Services (192 | 36.8%), Retail Trade (58 | 11.1%), Arts, Entertainment & Recreation (34 | 6.5%), Health Care & Social Assistance (32 | 6.1%), and Transportation & Warehousing (31 | 5.9%).
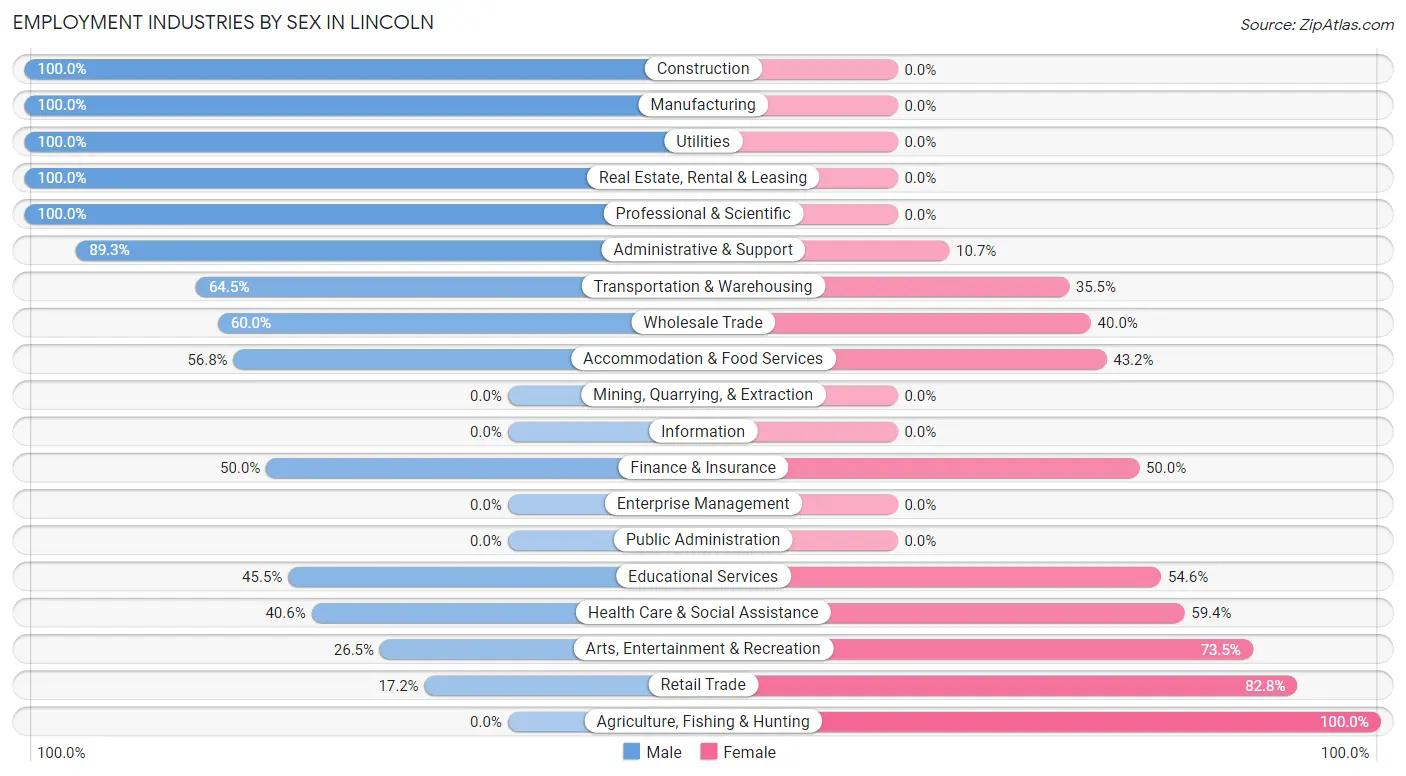
Employment Industries by Sex in Lincoln
The Lincoln industries that see more men than women are Construction (100.0%), Manufacturing (100.0%), and Utilities (100.0%), whereas the industries that tend to have a higher number of women are Agriculture, Fishing & Hunting (100.0%), Retail Trade (82.8%), and Arts, Entertainment & Recreation (73.5%).
| Industry | Male | Female |
| Agriculture, Fishing & Hunting | 0 (0.0%) | 10 (100.0%) |
| Mining, Quarrying, & Extraction | 0 (0.0%) | 0 (0.0%) |
| Construction | 23 (100.0%) | 0 (0.0%) |
| Manufacturing | 26 (100.0%) | 0 (0.0%) |
| Wholesale Trade | 3 (60.0%) | 2 (40.0%) |
| Retail Trade | 10 (17.2%) | 48 (82.8%) |
| Transportation & Warehousing | 20 (64.5%) | 11 (35.5%) |
| Utilities | 10 (100.0%) | 0 (0.0%) |
| Information | 0 (0.0%) | 0 (0.0%) |
| Finance & Insurance | 15 (50.0%) | 15 (50.0%) |
| Real Estate, Rental & Leasing | 8 (100.0%) | 0 (0.0%) |
| Professional & Scientific | 8 (100.0%) | 0 (0.0%) |
| Enterprise Management | 0 (0.0%) | 0 (0.0%) |
| Administrative & Support | 25 (89.3%) | 3 (10.7%) |
| Educational Services | 5 (45.5%) | 6 (54.5%) |
| Health Care & Social Assistance | 13 (40.6%) | 19 (59.4%) |
| Arts, Entertainment & Recreation | 9 (26.5%) | 25 (73.5%) |
| Accommodation & Food Services | 109 (56.8%) | 83 (43.2%) |
| Public Administration | 0 (0.0%) | 0 (0.0%) |
| Total | 287 (55.0%) | 235 (45.0%) |
Education in Lincoln
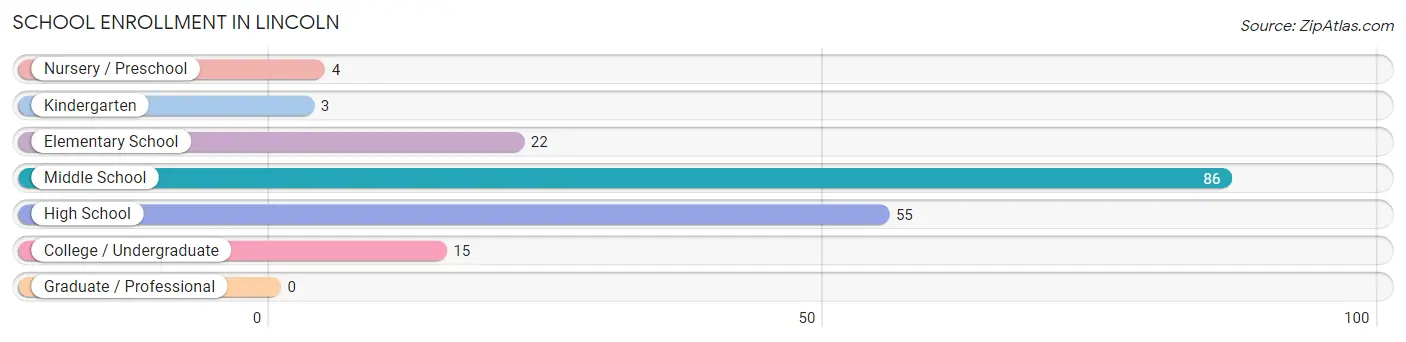
School Enrollment in Lincoln
The most common levels of schooling among the 185 students in Lincoln are middle school (86 | 46.5%), high school (55 | 29.7%), and elementary school (22 | 11.9%).
| School Level | # Students | % Students |
| Nursery / Preschool | 4 | 2.2% |
| Kindergarten | 3 | 1.6% |
| Elementary School | 22 | 11.9% |
| Middle School | 86 | 46.5% |
| High School | 55 | 29.7% |
| College / Undergraduate | 15 | 8.1% |
| Graduate / Professional | 0 | 0.0% |
| Total | 185 | 100.0% |
School Enrollment by Age by Funding Source in Lincoln
Out of a total of 185 students who are enrolled in schools in Lincoln, 25 (13.5%) attend a private institution, while the remaining 160 (86.5%) are enrolled in public schools. The age group of 15 to 17 year olds has the highest likelihood of being enrolled in private schools, with 21 (70.0% in the age bracket) enrolled. Conversely, the age group of 10 to 14 year olds has the lowest likelihood of being enrolled in a private school, with 104 (100.0% in the age bracket) attending a public institution.
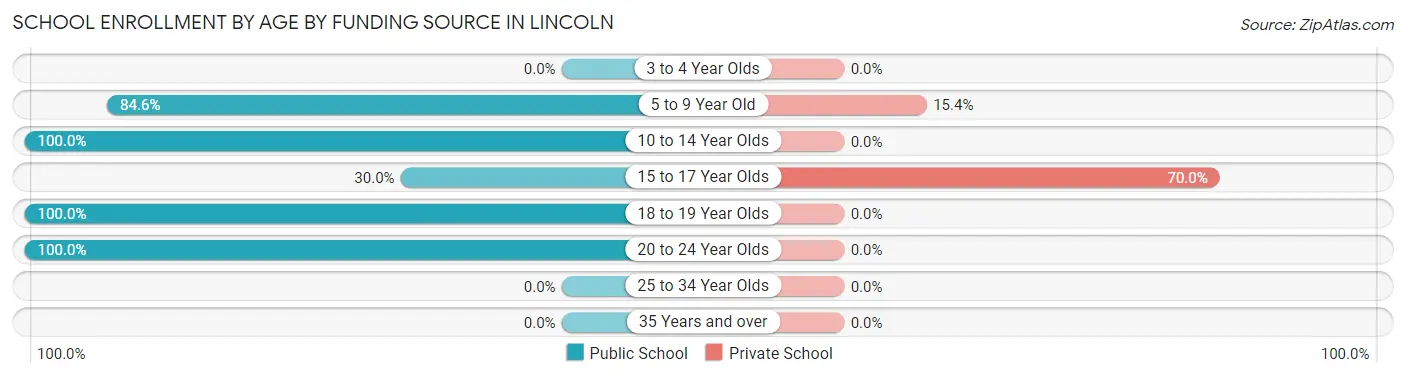
| Age Bracket | Public School | Private School |
| 3 to 4 Year Olds | 0 (0.0%) | 0 (0.0%) |
| 5 to 9 Year Old | 22 (84.6%) | 4 (15.4%) |
| 10 to 14 Year Olds | 104 (100.0%) | 0 (0.0%) |
| 15 to 17 Year Olds | 9 (30.0%) | 21 (70.0%) |
| 18 to 19 Year Olds | 20 (100.0%) | 0 (0.0%) |
| 20 to 24 Year Olds | 5 (100.0%) | 0 (0.0%) |
| 25 to 34 Year Olds | 0 (0.0%) | 0 (0.0%) |
| 35 Years and over | 0 (0.0%) | 0 (0.0%) |
| Total | 160 (86.5%) | 25 (13.5%) |
Educational Attainment by Field of Study in Lincoln
Business (49 | 18.3%), education (49 | 18.3%), visual & performing arts (35 | 13.1%), literature & languages (29 | 10.9%), and social sciences (23 | 8.6%) are the most common fields of study among 267 individuals in Lincoln who have obtained a bachelor's degree or higher.
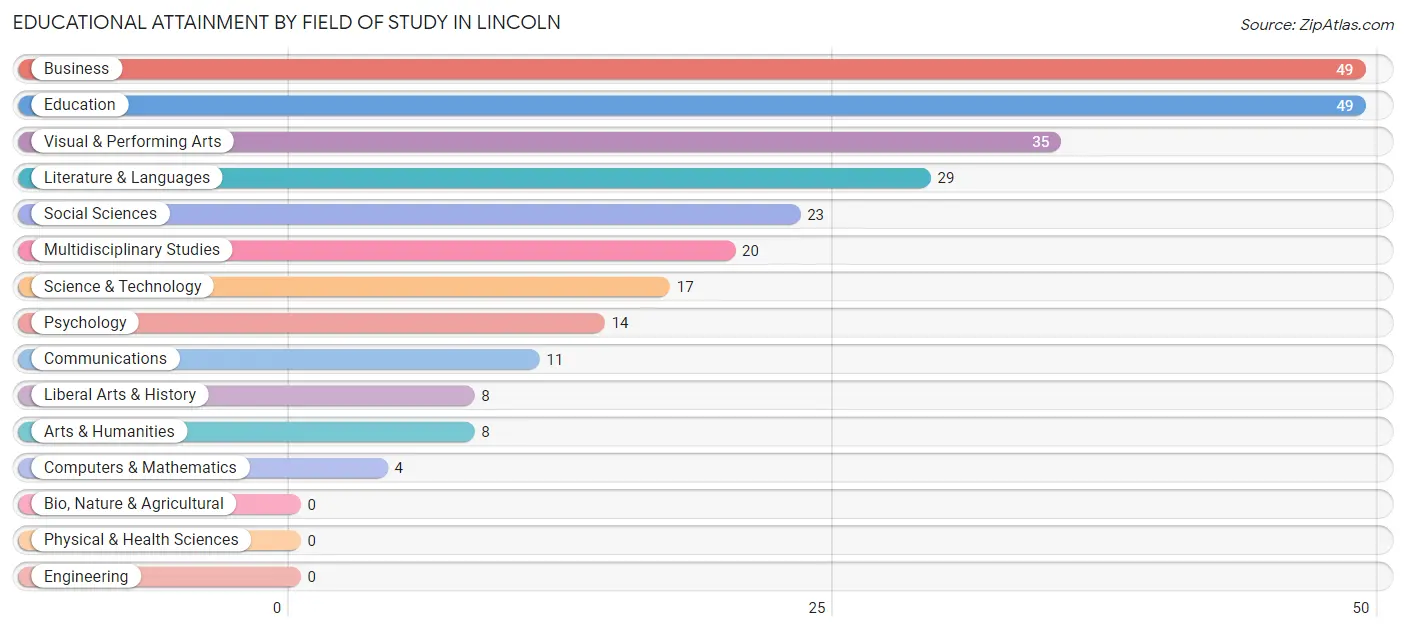
| Field of Study | # Graduates | % Graduates |
| Computers & Mathematics | 4 | 1.5% |
| Bio, Nature & Agricultural | 0 | 0.0% |
| Physical & Health Sciences | 0 | 0.0% |
| Psychology | 14 | 5.2% |
| Social Sciences | 23 | 8.6% |
| Engineering | 0 | 0.0% |
| Multidisciplinary Studies | 20 | 7.5% |
| Science & Technology | 17 | 6.4% |
| Business | 49 | 18.3% |
| Education | 49 | 18.3% |
| Literature & Languages | 29 | 10.9% |
| Liberal Arts & History | 8 | 3.0% |
| Visual & Performing Arts | 35 | 13.1% |
| Communications | 11 | 4.1% |
| Arts & Humanities | 8 | 3.0% |
| Total | 267 | 100.0% |
Transportation & Commute in Lincoln
Vehicle Availability by Sex in Lincoln
The most prevalent vehicle ownership categories in Lincoln are males with 2 vehicles (127, accounting for 47.6%) and females with 2 vehicles (180, making up 54.0%).
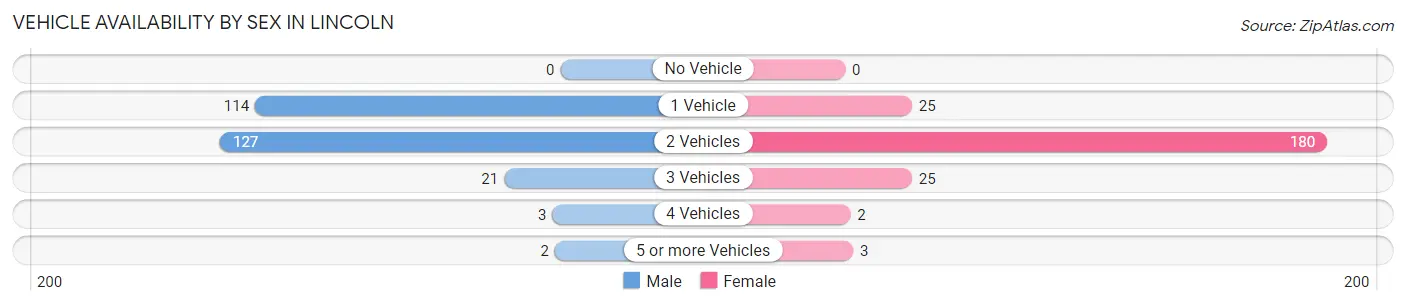
| Vehicles Available | Male | Female |
| No Vehicle | 0 (0.0%) | 0 (0.0%) |
| 1 Vehicle | 114 (42.7%) | 25 (10.6%) |
| 2 Vehicles | 127 (47.6%) | 180 (76.6%) |
| 3 Vehicles | 21 (7.9%) | 25 (10.6%) |
| 4 Vehicles | 3 (1.1%) | 2 (0.9%) |
| 5 or more Vehicles | 2 (0.7%) | 3 (1.3%) |
| Total | 267 (100.0%) | 235 (100.0%) |
Commute Time in Lincoln
The most frequently occuring commute durations in Lincoln are 5 to 9 minutes (96 commuters, 22.2%), 15 to 19 minutes (94 commuters, 21.8%), and 10 to 14 minutes (62 commuters, 14.3%).
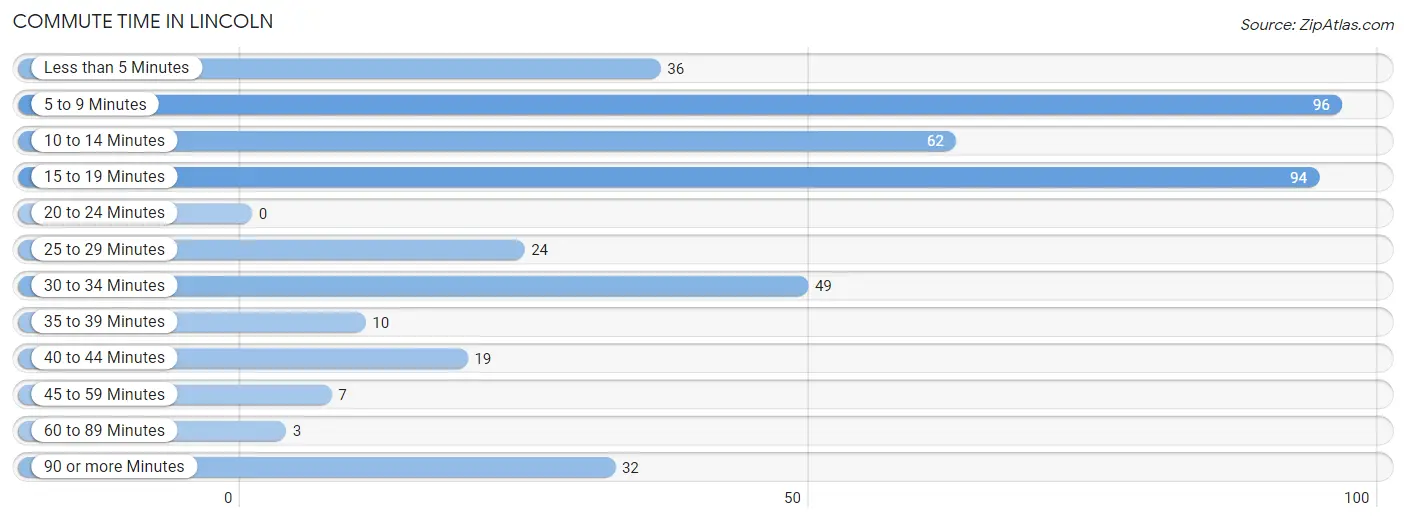
| Commute Time | # Commuters | % Commuters |
| Less than 5 Minutes | 36 | 8.3% |
| 5 to 9 Minutes | 96 | 22.2% |
| 10 to 14 Minutes | 62 | 14.3% |
| 15 to 19 Minutes | 94 | 21.8% |
| 20 to 24 Minutes | 0 | 0.0% |
| 25 to 29 Minutes | 24 | 5.6% |
| 30 to 34 Minutes | 49 | 11.3% |
| 35 to 39 Minutes | 10 | 2.3% |
| 40 to 44 Minutes | 19 | 4.4% |
| 45 to 59 Minutes | 7 | 1.6% |
| 60 to 89 Minutes | 3 | 0.7% |
| 90 or more Minutes | 32 | 7.4% |
Commute Time by Sex in Lincoln
The most common commute times in Lincoln are 15 to 19 minutes (88 commuters, 35.9%) for males and 5 to 9 minutes (61 commuters, 32.6%) for females.
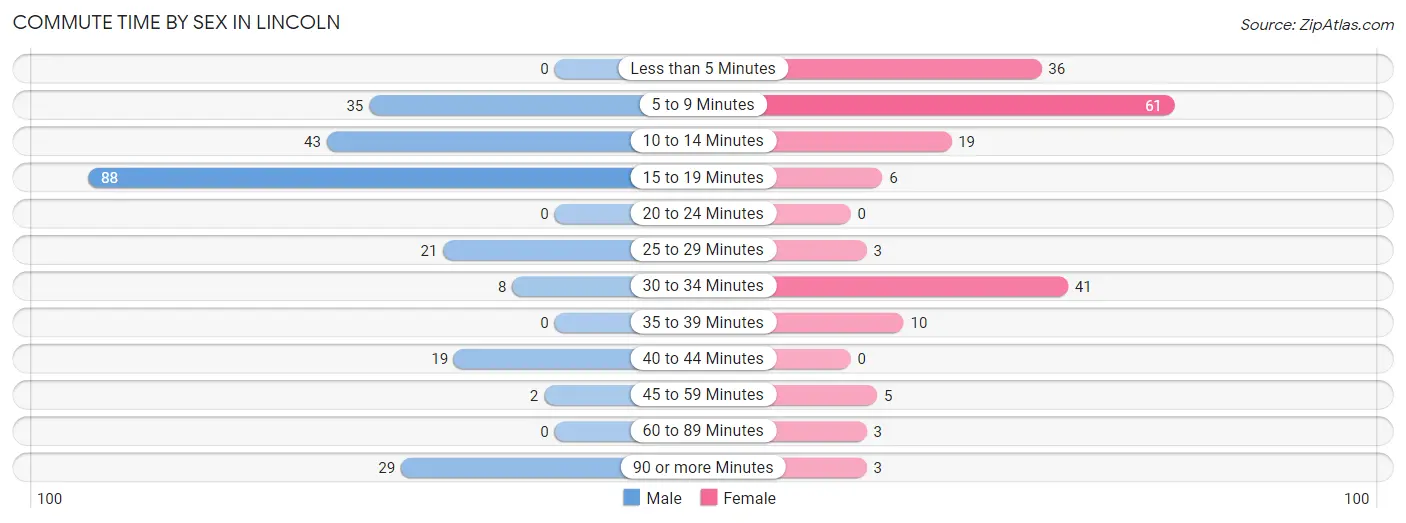
| Commute Time | Male | Female |
| Less than 5 Minutes | 0 (0.0%) | 36 (19.3%) |
| 5 to 9 Minutes | 35 (14.3%) | 61 (32.6%) |
| 10 to 14 Minutes | 43 (17.5%) | 19 (10.2%) |
| 15 to 19 Minutes | 88 (35.9%) | 6 (3.2%) |
| 20 to 24 Minutes | 0 (0.0%) | 0 (0.0%) |
| 25 to 29 Minutes | 21 (8.6%) | 3 (1.6%) |
| 30 to 34 Minutes | 8 (3.3%) | 41 (21.9%) |
| 35 to 39 Minutes | 0 (0.0%) | 10 (5.3%) |
| 40 to 44 Minutes | 19 (7.8%) | 0 (0.0%) |
| 45 to 59 Minutes | 2 (0.8%) | 5 (2.7%) |
| 60 to 89 Minutes | 0 (0.0%) | 3 (1.6%) |
| 90 or more Minutes | 29 (11.8%) | 3 (1.6%) |
Time of Departure to Work by Sex in Lincoln
The most frequent times of departure to work in Lincoln are 9:00 AM to 9:59 AM (86, 35.1%) for males and 6:30 AM to 6:59 AM (46, 24.6%) for females.
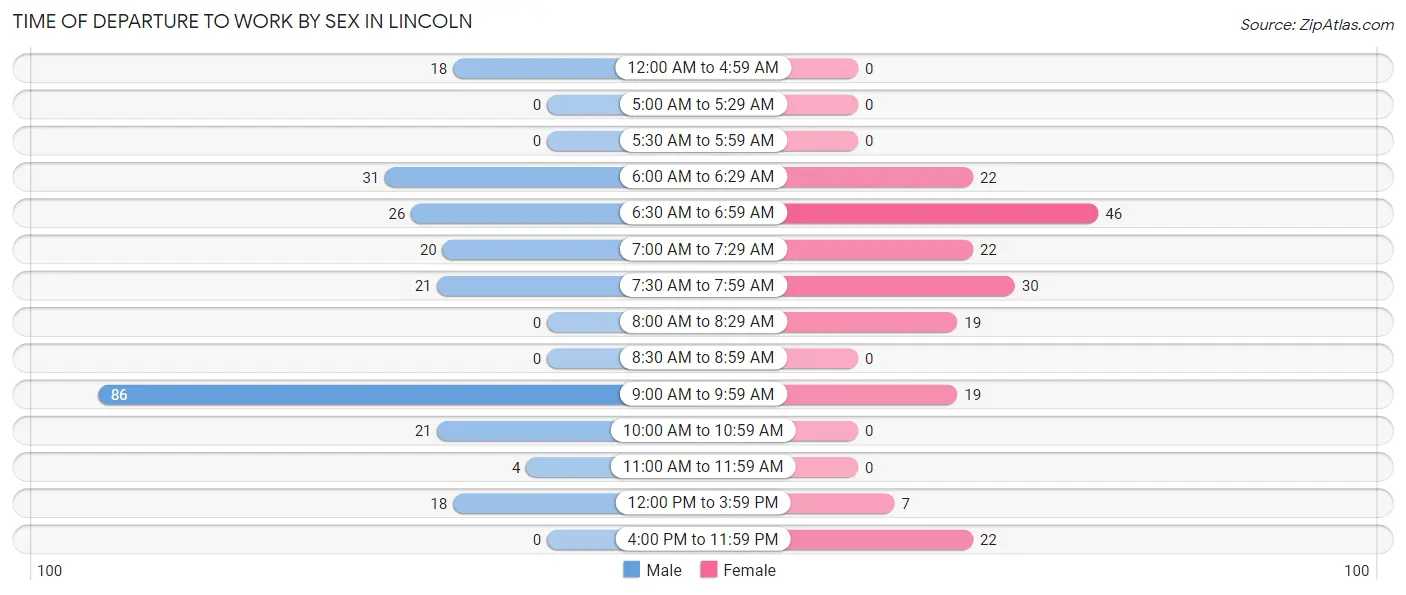
| Time of Departure | Male | Female |
| 12:00 AM to 4:59 AM | 18 (7.3%) | 0 (0.0%) |
| 5:00 AM to 5:29 AM | 0 (0.0%) | 0 (0.0%) |
| 5:30 AM to 5:59 AM | 0 (0.0%) | 0 (0.0%) |
| 6:00 AM to 6:29 AM | 31 (12.7%) | 22 (11.8%) |
| 6:30 AM to 6:59 AM | 26 (10.6%) | 46 (24.6%) |
| 7:00 AM to 7:29 AM | 20 (8.2%) | 22 (11.8%) |
| 7:30 AM to 7:59 AM | 21 (8.6%) | 30 (16.0%) |
| 8:00 AM to 8:29 AM | 0 (0.0%) | 19 (10.2%) |
| 8:30 AM to 8:59 AM | 0 (0.0%) | 0 (0.0%) |
| 9:00 AM to 9:59 AM | 86 (35.1%) | 19 (10.2%) |
| 10:00 AM to 10:59 AM | 21 (8.6%) | 0 (0.0%) |
| 11:00 AM to 11:59 AM | 4 (1.6%) | 0 (0.0%) |
| 12:00 PM to 3:59 PM | 18 (7.3%) | 7 (3.7%) |
| 4:00 PM to 11:59 PM | 0 (0.0%) | 22 (11.8%) |
| Total | 245 (100.0%) | 187 (100.0%) |
Housing Occupancy in Lincoln
Occupancy by Ownership in Lincoln
Of the total 459 dwellings in Lincoln, owner-occupied units account for 321 (69.9%), while renter-occupied units make up 138 (30.1%).
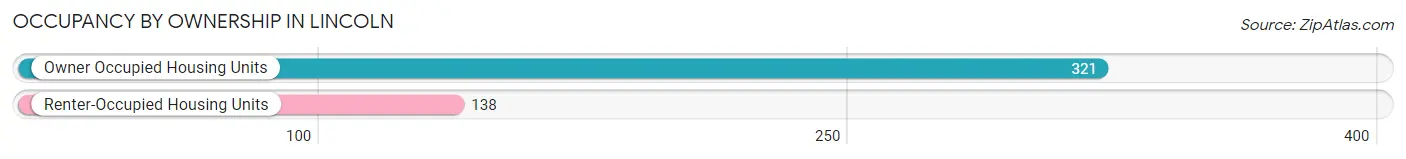
| Occupancy | # Housing Units | % Housing Units |
| Owner Occupied Housing Units | 321 | 69.9% |
| Renter-Occupied Housing Units | 138 | 30.1% |
| Total Occupied Housing Units | 459 | 100.0% |
Occupancy by Household Size in Lincoln
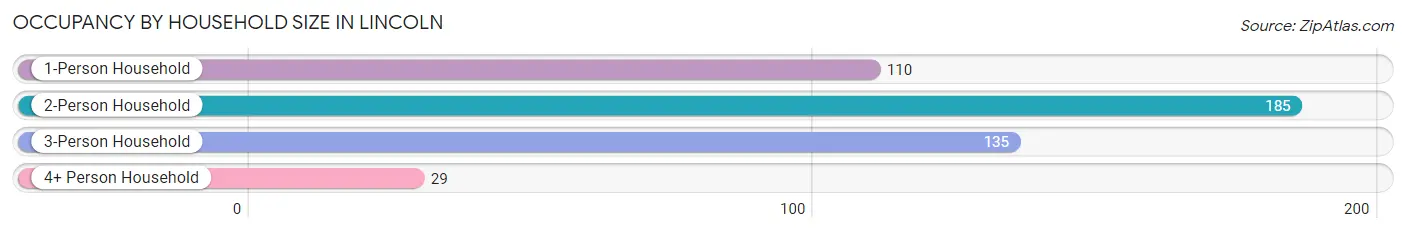
| Household Size | # Housing Units | % Housing Units |
| 1-Person Household | 110 | 24.0% |
| 2-Person Household | 185 | 40.3% |
| 3-Person Household | 135 | 29.4% |
| 4+ Person Household | 29 | 6.3% |
| Total Housing Units | 459 | 100.0% |
Occupancy by Ownership by Household Size in Lincoln
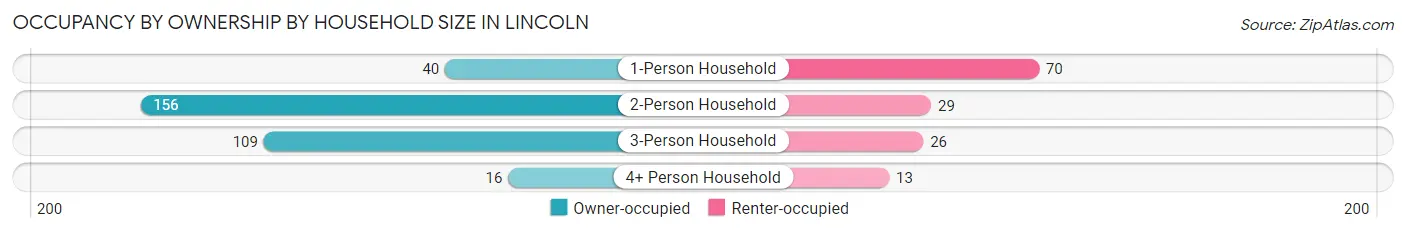
| Household Size | Owner-occupied | Renter-occupied |
| 1-Person Household | 40 (36.4%) | 70 (63.6%) |
| 2-Person Household | 156 (84.3%) | 29 (15.7%) |
| 3-Person Household | 109 (80.7%) | 26 (19.3%) |
| 4+ Person Household | 16 (55.2%) | 13 (44.8%) |
| Total Housing Units | 321 (69.9%) | 138 (30.1%) |
Occupancy by Educational Attainment in Lincoln
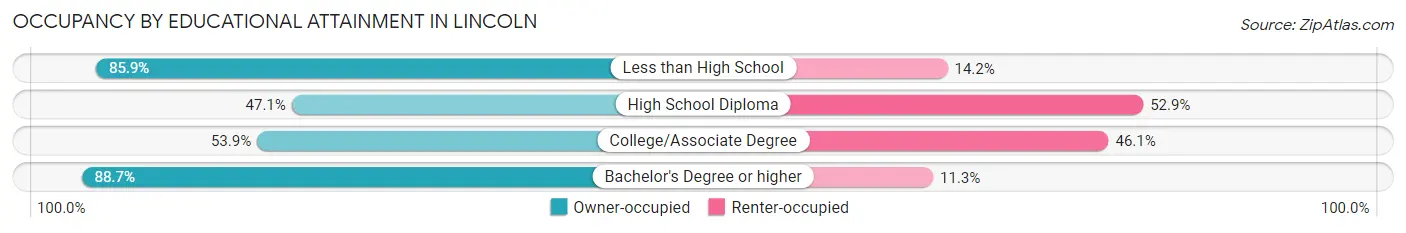
| Household Size | Owner-occupied | Renter-occupied |
| Less than High School | 91 (85.9%) | 15 (14.1%) |
| High School Diploma | 24 (47.1%) | 27 (52.9%) |
| College/Associate Degree | 96 (53.9%) | 82 (46.1%) |
| Bachelor's Degree or higher | 110 (88.7%) | 14 (11.3%) |
Occupancy by Age of Householder in Lincoln
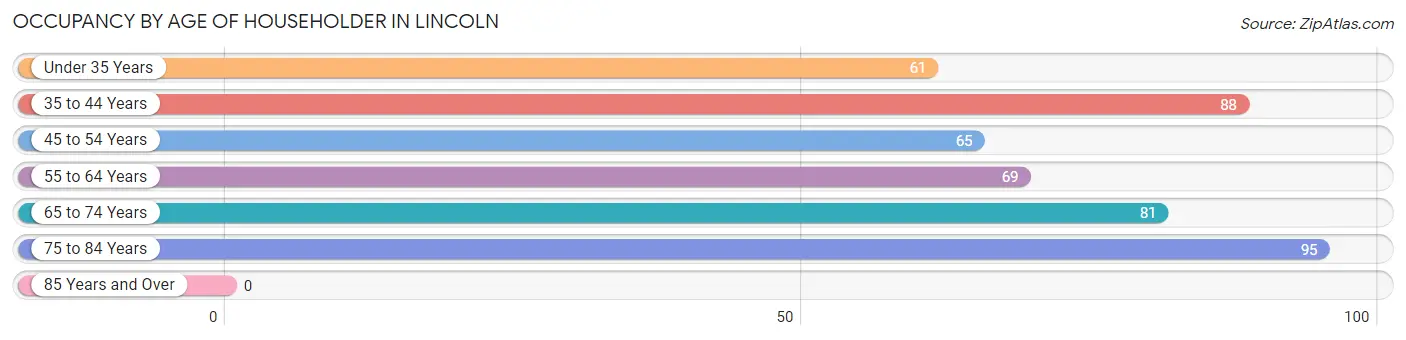
| Age Bracket | # Households | % Households |
| Under 35 Years | 61 | 13.3% |
| 35 to 44 Years | 88 | 19.2% |
| 45 to 54 Years | 65 | 14.2% |
| 55 to 64 Years | 69 | 15.0% |
| 65 to 74 Years | 81 | 17.6% |
| 75 to 84 Years | 95 | 20.7% |
| 85 Years and Over | 0 | 0.0% |
| Total | 459 | 100.0% |
Housing Finances in Lincoln
Median Income by Occupancy in Lincoln
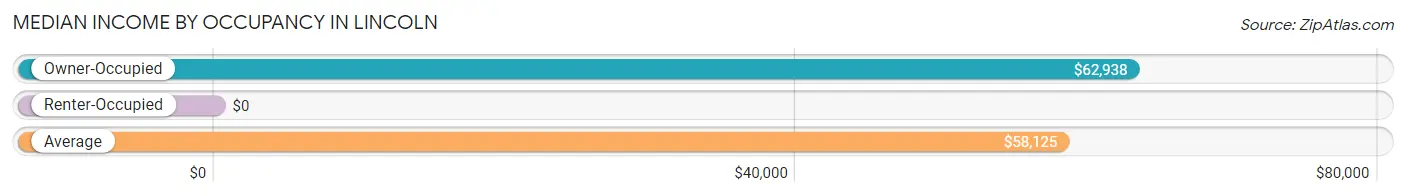
| Occupancy Type | # Households | Median Income |
| Owner-Occupied | 321 (69.9%) | $62,938 |
| Renter-Occupied | 138 (30.1%) | $0 |
| Average | 459 (100.0%) | $58,125 |
Occupancy by Householder Income Bracket in Lincoln
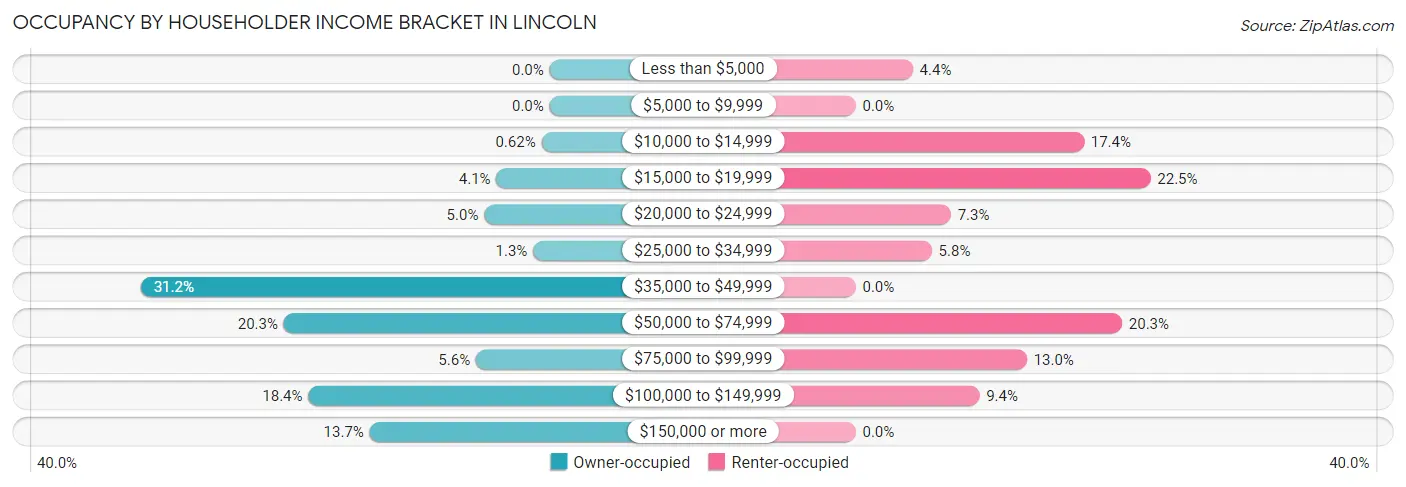
| Income Bracket | Owner-occupied | Renter-occupied |
| Less than $5,000 | 0 (0.0%) | 6 (4.3%) |
| $5,000 to $9,999 | 0 (0.0%) | 0 (0.0%) |
| $10,000 to $14,999 | 2 (0.6%) | 24 (17.4%) |
| $15,000 to $19,999 | 13 (4.1%) | 31 (22.5%) |
| $20,000 to $24,999 | 16 (5.0%) | 10 (7.2%) |
| $25,000 to $34,999 | 4 (1.3%) | 8 (5.8%) |
| $35,000 to $49,999 | 100 (31.1%) | 0 (0.0%) |
| $50,000 to $74,999 | 65 (20.3%) | 28 (20.3%) |
| $75,000 to $99,999 | 18 (5.6%) | 18 (13.0%) |
| $100,000 to $149,999 | 59 (18.4%) | 13 (9.4%) |
| $150,000 or more | 44 (13.7%) | 0 (0.0%) |
| Total | 321 (100.0%) | 138 (100.0%) |
Monthly Housing Cost Tiers in Lincoln
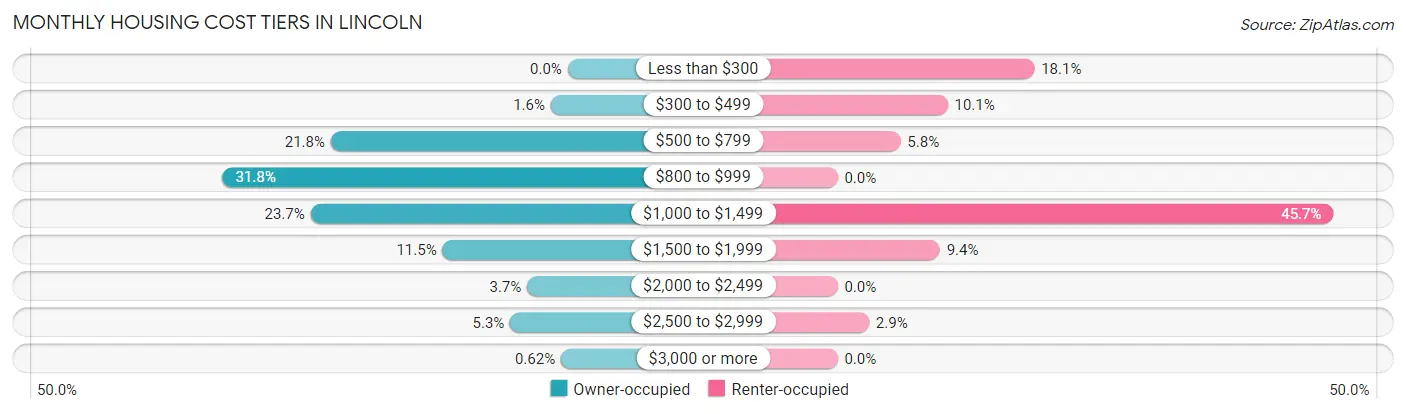
| Monthly Cost | Owner-occupied | Renter-occupied |
| Less than $300 | 0 (0.0%) | 25 (18.1%) |
| $300 to $499 | 5 (1.6%) | 14 (10.1%) |
| $500 to $799 | 70 (21.8%) | 8 (5.8%) |
| $800 to $999 | 102 (31.8%) | 0 (0.0%) |
| $1,000 to $1,499 | 76 (23.7%) | 63 (45.7%) |
| $1,500 to $1,999 | 37 (11.5%) | 13 (9.4%) |
| $2,000 to $2,499 | 12 (3.7%) | 0 (0.0%) |
| $2,500 to $2,999 | 17 (5.3%) | 4 (2.9%) |
| $3,000 or more | 2 (0.6%) | 0 (0.0%) |
| Total | 321 (100.0%) | 138 (100.0%) |
Physical Housing Characteristics in Lincoln
Housing Structures in Lincoln
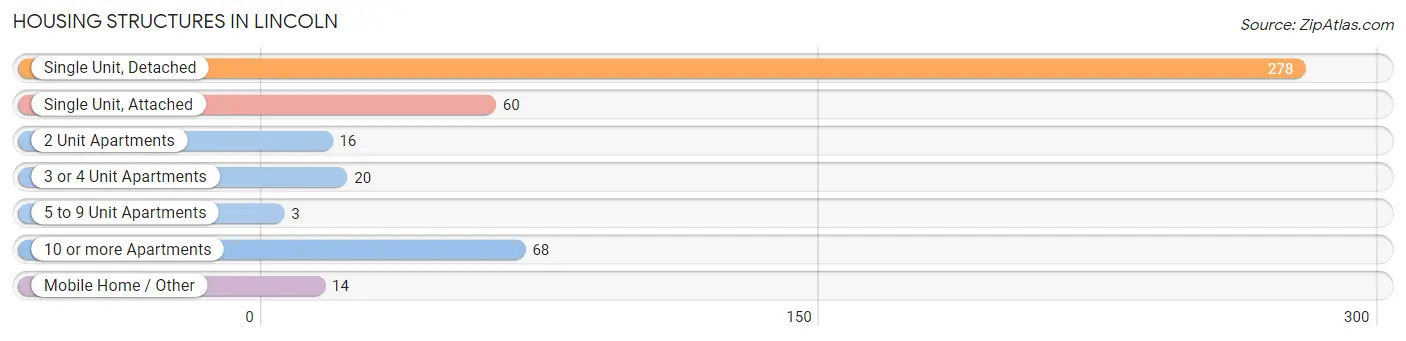
| Structure Type | # Housing Units | % Housing Units |
| Single Unit, Detached | 278 | 60.6% |
| Single Unit, Attached | 60 | 13.1% |
| 2 Unit Apartments | 16 | 3.5% |
| 3 or 4 Unit Apartments | 20 | 4.4% |
| 5 to 9 Unit Apartments | 3 | 0.6% |
| 10 or more Apartments | 68 | 14.8% |
| Mobile Home / Other | 14 | 3.0% |
| Total | 459 | 100.0% |
Housing Structures by Occupancy in Lincoln
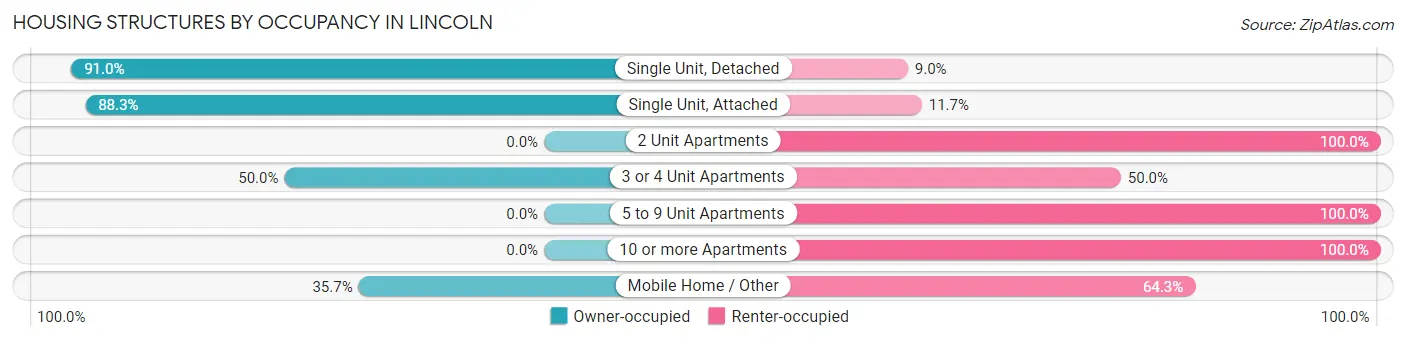
| Structure Type | Owner-occupied | Renter-occupied |
| Single Unit, Detached | 253 (91.0%) | 25 (9.0%) |
| Single Unit, Attached | 53 (88.3%) | 7 (11.7%) |
| 2 Unit Apartments | 0 (0.0%) | 16 (100.0%) |
| 3 or 4 Unit Apartments | 10 (50.0%) | 10 (50.0%) |
| 5 to 9 Unit Apartments | 0 (0.0%) | 3 (100.0%) |
| 10 or more Apartments | 0 (0.0%) | 68 (100.0%) |
| Mobile Home / Other | 5 (35.7%) | 9 (64.3%) |
| Total | 321 (69.9%) | 138 (30.1%) |
Housing Structures by Number of Rooms in Lincoln
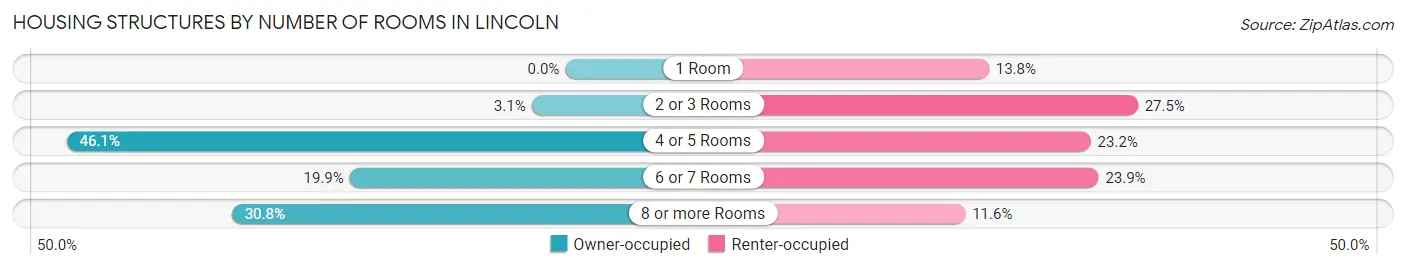
| Number of Rooms | Owner-occupied | Renter-occupied |
| 1 Room | 0 (0.0%) | 19 (13.8%) |
| 2 or 3 Rooms | 10 (3.1%) | 38 (27.5%) |
| 4 or 5 Rooms | 148 (46.1%) | 32 (23.2%) |
| 6 or 7 Rooms | 64 (19.9%) | 33 (23.9%) |
| 8 or more Rooms | 99 (30.8%) | 16 (11.6%) |
| Total | 321 (100.0%) | 138 (100.0%) |
Housing Structure by Heating Type in Lincoln
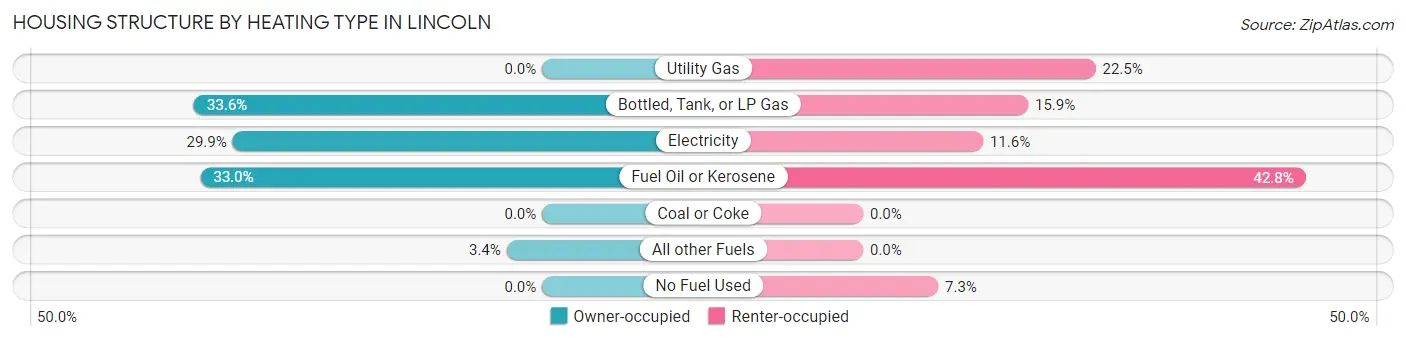
| Heating Type | Owner-occupied | Renter-occupied |
| Utility Gas | 0 (0.0%) | 31 (22.5%) |
| Bottled, Tank, or LP Gas | 108 (33.6%) | 22 (15.9%) |
| Electricity | 96 (29.9%) | 16 (11.6%) |
| Fuel Oil or Kerosene | 106 (33.0%) | 59 (42.7%) |
| Coal or Coke | 0 (0.0%) | 0 (0.0%) |
| All other Fuels | 11 (3.4%) | 0 (0.0%) |
| No Fuel Used | 0 (0.0%) | 10 (7.2%) |
| Total | 321 (100.0%) | 138 (100.0%) |
Household Vehicle Usage in Lincoln
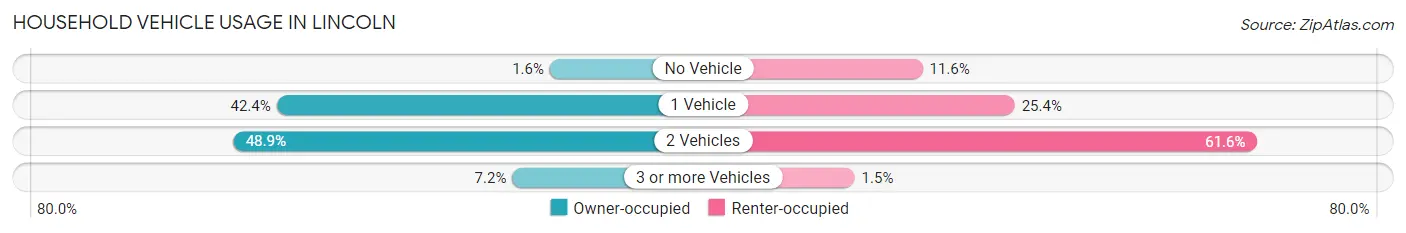
| Vehicles per Household | Owner-occupied | Renter-occupied |
| No Vehicle | 5 (1.6%) | 16 (11.6%) |
| 1 Vehicle | 136 (42.4%) | 35 (25.4%) |
| 2 Vehicles | 157 (48.9%) | 85 (61.6%) |
| 3 or more Vehicles | 23 (7.2%) | 2 (1.5%) |
| Total | 321 (100.0%) | 138 (100.0%) |
Real Estate & Mortgages in Lincoln
Real Estate and Mortgage Overview in Lincoln
| Characteristic | Without Mortgage | With Mortgage |
| Housing Units | 172 | 149 |
| Median Property Value | $238,800 | $270,700 |
| Median Household Income | $42,093 | $30 |
| Monthly Housing Costs | $868 | $2 |
| Real Estate Taxes | $2,691 | $0 |
Property Value by Mortgage Status in Lincoln
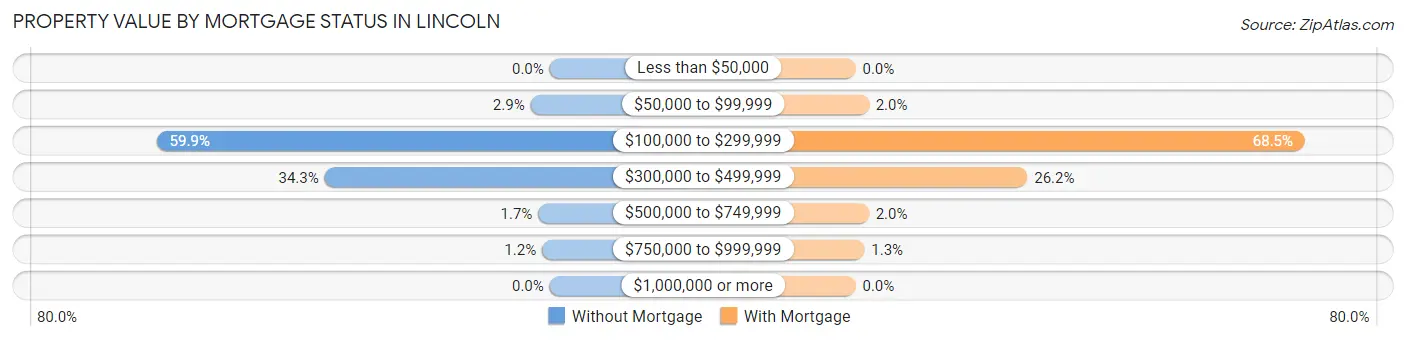
| Property Value | Without Mortgage | With Mortgage |
| Less than $50,000 | 0 (0.0%) | 0 (0.0%) |
| $50,000 to $99,999 | 5 (2.9%) | 3 (2.0%) |
| $100,000 to $299,999 | 103 (59.9%) | 102 (68.5%) |
| $300,000 to $499,999 | 59 (34.3%) | 39 (26.2%) |
| $500,000 to $749,999 | 3 (1.7%) | 3 (2.0%) |
| $750,000 to $999,999 | 2 (1.2%) | 2 (1.3%) |
| $1,000,000 or more | 0 (0.0%) | 0 (0.0%) |
| Total | 172 (100.0%) | 149 (100.0%) |
Household Income by Mortgage Status in Lincoln
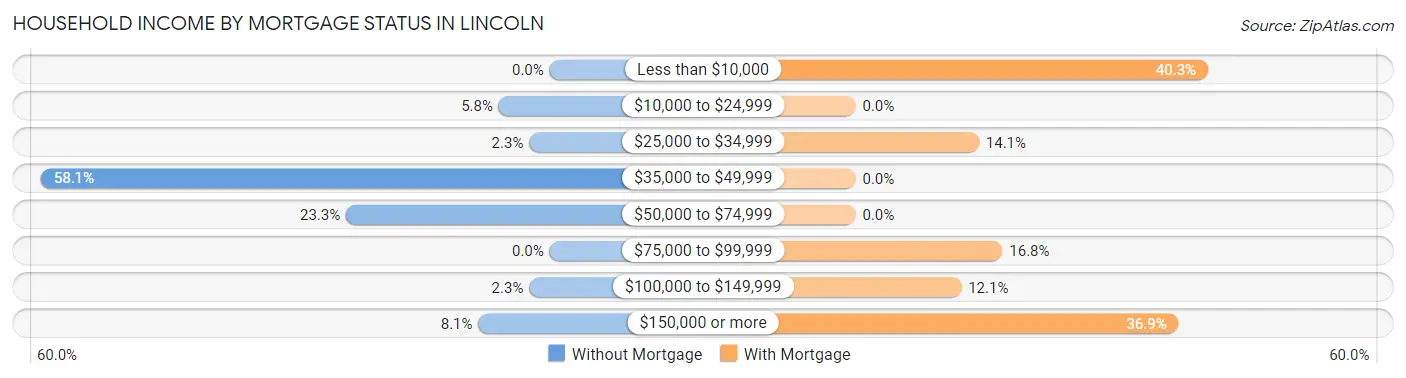
| Household Income | Without Mortgage | With Mortgage |
| Less than $10,000 | 0 (0.0%) | 60 (40.3%) |
| $10,000 to $24,999 | 10 (5.8%) | 0 (0.0%) |
| $25,000 to $34,999 | 4 (2.3%) | 21 (14.1%) |
| $35,000 to $49,999 | 100 (58.1%) | 0 (0.0%) |
| $50,000 to $74,999 | 40 (23.3%) | 0 (0.0%) |
| $75,000 to $99,999 | 0 (0.0%) | 25 (16.8%) |
| $100,000 to $149,999 | 4 (2.3%) | 18 (12.1%) |
| $150,000 or more | 14 (8.1%) | 55 (36.9%) |
| Total | 172 (100.0%) | 149 (100.0%) |
Property Value to Household Income Ratio in Lincoln
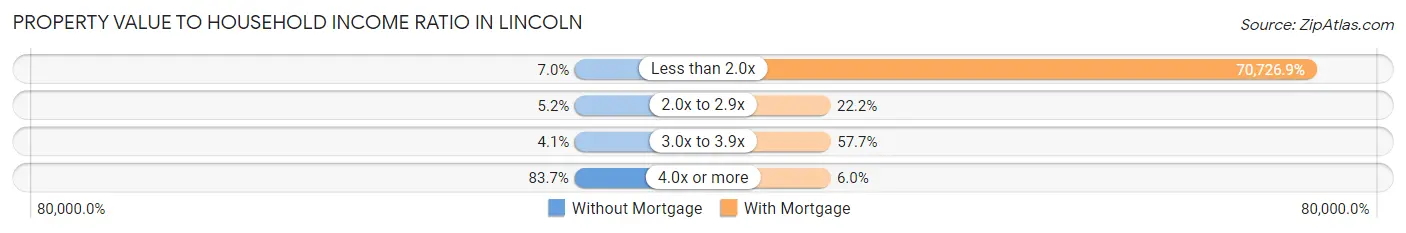
| Value-to-Income Ratio | Without Mortgage | With Mortgage |
| Less than 2.0x | 12 (7.0%) | 105,383 (70,726.9%) |
| 2.0x to 2.9x | 9 (5.2%) | 33 (22.2%) |
| 3.0x to 3.9x | 7 (4.1%) | 86 (57.7%) |
| 4.0x or more | 144 (83.7%) | 9 (6.0%) |
| Total | 172 (100.0%) | 149 (100.0%) |
Real Estate Taxes by Mortgage Status in Lincoln
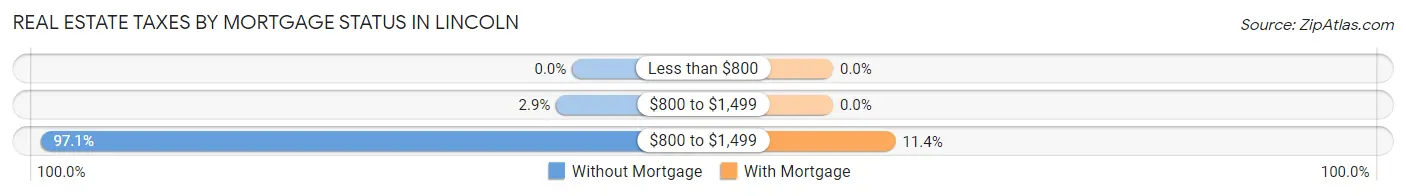
| Property Taxes | Without Mortgage | With Mortgage |
| Less than $800 | 0 (0.0%) | 0 (0.0%) |
| $800 to $1,499 | 5 (2.9%) | 0 (0.0%) |
| $800 to $1,499 | 167 (97.1%) | 17 (11.4%) |
| Total | 172 (100.0%) | 149 (100.0%) |
Health & Disability in Lincoln
Health Insurance Coverage by Age in Lincoln
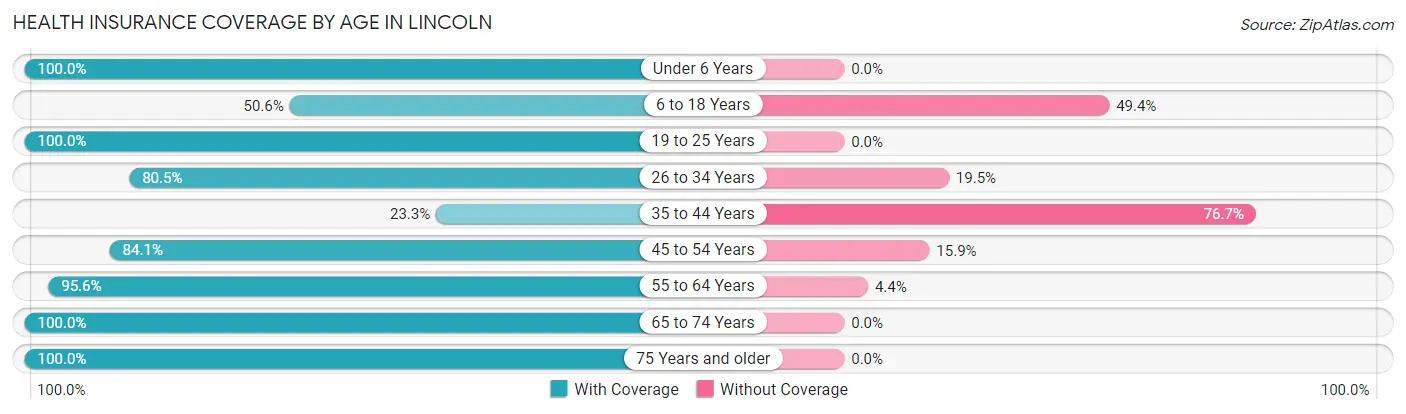
| Age Bracket | With Coverage | Without Coverage |
| Under 6 Years | 21 (100.0%) | 0 (0.0%) |
| 6 to 18 Years | 84 (50.6%) | 82 (49.4%) |
| 19 to 25 Years | 103 (100.0%) | 0 (0.0%) |
| 26 to 34 Years | 66 (80.5%) | 16 (19.5%) |
| 35 to 44 Years | 27 (23.3%) | 89 (76.7%) |
| 45 to 54 Years | 106 (84.1%) | 20 (15.9%) |
| 55 to 64 Years | 108 (95.6%) | 5 (4.4%) |
| 65 to 74 Years | 181 (100.0%) | 0 (0.0%) |
| 75 Years and older | 109 (100.0%) | 0 (0.0%) |
| Total | 805 (79.1%) | 212 (20.8%) |
Health Insurance Coverage by Citizenship Status in Lincoln
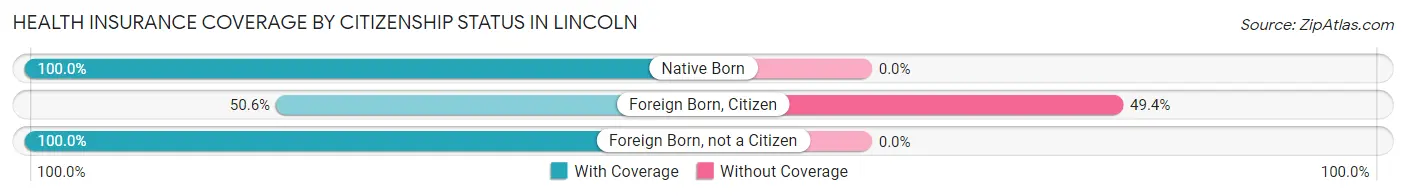
| Citizenship Status | With Coverage | Without Coverage |
| Native Born | 21 (100.0%) | 0 (0.0%) |
| Foreign Born, Citizen | 84 (50.6%) | 82 (49.4%) |
| Foreign Born, not a Citizen | 103 (100.0%) | 0 (0.0%) |
Health Insurance Coverage by Household Income in Lincoln
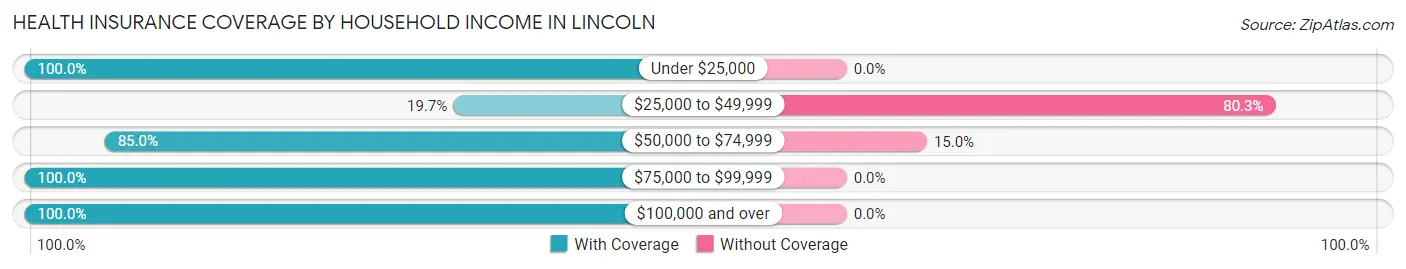
| Household Income | With Coverage | Without Coverage |
| Under $25,000 | 137 (100.0%) | 0 (0.0%) |
| $25,000 to $49,999 | 42 (19.7%) | 171 (80.3%) |
| $50,000 to $74,999 | 232 (85.0%) | 41 (15.0%) |
| $75,000 to $99,999 | 98 (100.0%) | 0 (0.0%) |
| $100,000 and over | 296 (100.0%) | 0 (0.0%) |
Public vs Private Health Insurance Coverage by Age in Lincoln
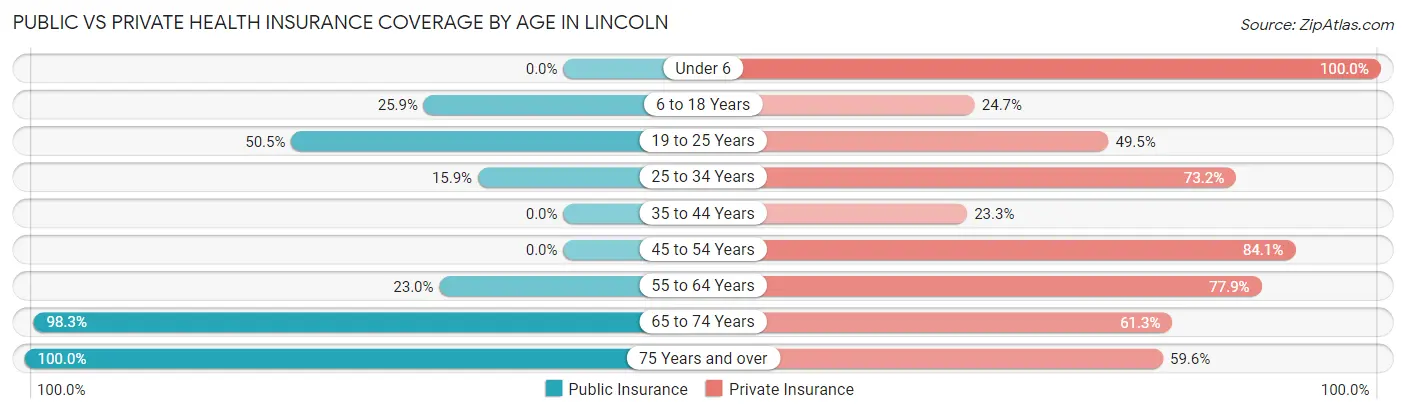
| Age Bracket | Public Insurance | Private Insurance |
| Under 6 | 0 (0.0%) | 21 (100.0%) |
| 6 to 18 Years | 43 (25.9%) | 41 (24.7%) |
| 19 to 25 Years | 52 (50.5%) | 51 (49.5%) |
| 25 to 34 Years | 13 (15.9%) | 60 (73.2%) |
| 35 to 44 Years | 0 (0.0%) | 27 (23.3%) |
| 45 to 54 Years | 0 (0.0%) | 106 (84.1%) |
| 55 to 64 Years | 26 (23.0%) | 88 (77.9%) |
| 65 to 74 Years | 178 (98.3%) | 111 (61.3%) |
| 75 Years and over | 109 (100.0%) | 65 (59.6%) |
| Total | 421 (41.4%) | 570 (56.0%) |
Disability Status by Sex by Age in Lincoln
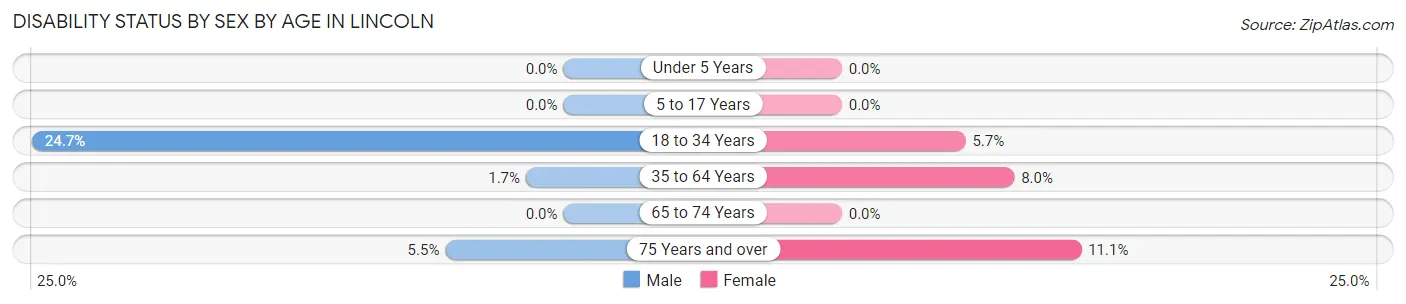
| Age Bracket | Male | Female |
| Under 5 Years | 0 (0.0%) | 0 (0.0%) |
| 5 to 17 Years | 0 (0.0%) | 0 (0.0%) |
| 18 to 34 Years | 18 (24.7%) | 7 (5.7%) |
| 35 to 64 Years | 4 (1.7%) | 10 (8.0%) |
| 65 to 74 Years | 0 (0.0%) | 0 (0.0%) |
| 75 Years and over | 4 (5.5%) | 4 (11.1%) |
Disability Class by Sex by Age in Lincoln
Disability Class: Hearing Difficulty
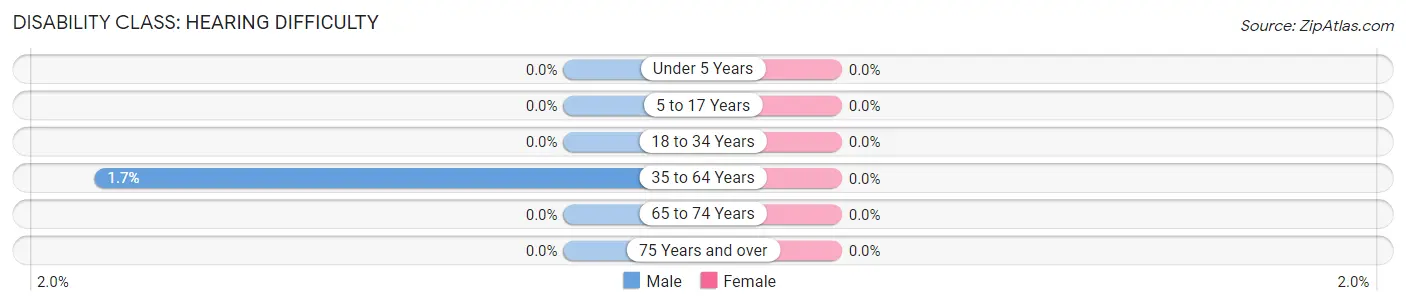
| Age Bracket | Male | Female |
| Under 5 Years | 0 (0.0%) | 0 (0.0%) |
| 5 to 17 Years | 0 (0.0%) | 0 (0.0%) |
| 18 to 34 Years | 0 (0.0%) | 0 (0.0%) |
| 35 to 64 Years | 4 (1.7%) | 0 (0.0%) |
| 65 to 74 Years | 0 (0.0%) | 0 (0.0%) |
| 75 Years and over | 0 (0.0%) | 0 (0.0%) |
Disability Class: Vision Difficulty
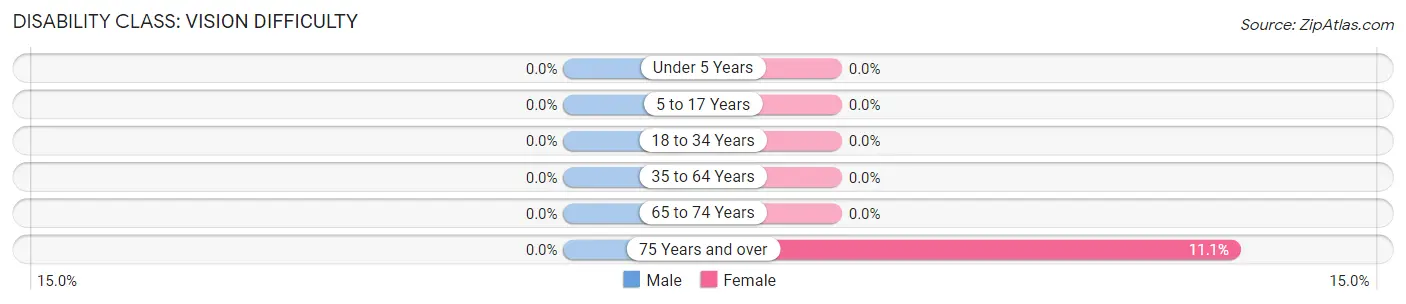
| Age Bracket | Male | Female |
| Under 5 Years | 0 (0.0%) | 0 (0.0%) |
| 5 to 17 Years | 0 (0.0%) | 0 (0.0%) |
| 18 to 34 Years | 0 (0.0%) | 0 (0.0%) |
| 35 to 64 Years | 0 (0.0%) | 0 (0.0%) |
| 65 to 74 Years | 0 (0.0%) | 0 (0.0%) |
| 75 Years and over | 0 (0.0%) | 4 (11.1%) |
Disability Class: Cognitive Difficulty
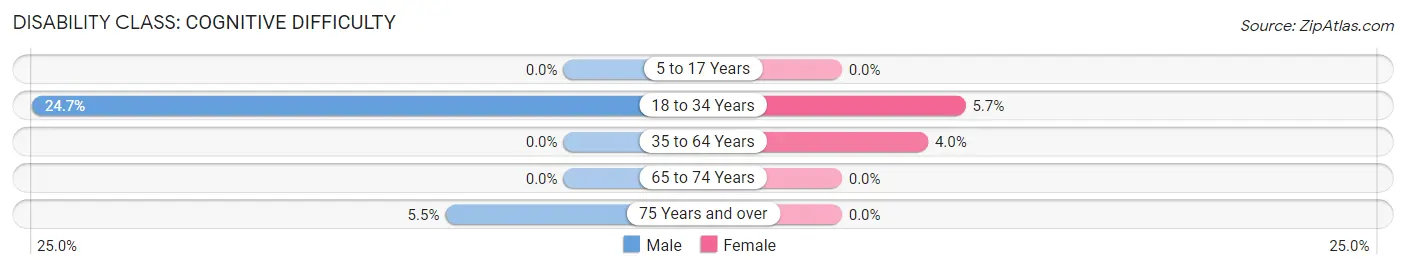
| Age Bracket | Male | Female |
| 5 to 17 Years | 0 (0.0%) | 0 (0.0%) |
| 18 to 34 Years | 18 (24.7%) | 7 (5.7%) |
| 35 to 64 Years | 0 (0.0%) | 5 (4.0%) |
| 65 to 74 Years | 0 (0.0%) | 0 (0.0%) |
| 75 Years and over | 4 (5.5%) | 0 (0.0%) |
Disability Class: Ambulatory Difficulty
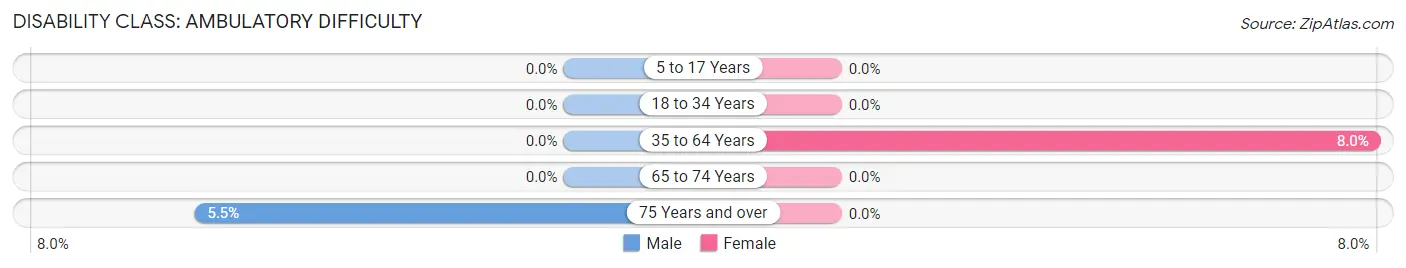
| Age Bracket | Male | Female |
| 5 to 17 Years | 0 (0.0%) | 0 (0.0%) |
| 18 to 34 Years | 0 (0.0%) | 0 (0.0%) |
| 35 to 64 Years | 0 (0.0%) | 10 (8.0%) |
| 65 to 74 Years | 0 (0.0%) | 0 (0.0%) |
| 75 Years and over | 4 (5.5%) | 0 (0.0%) |
Disability Class: Self-Care Difficulty
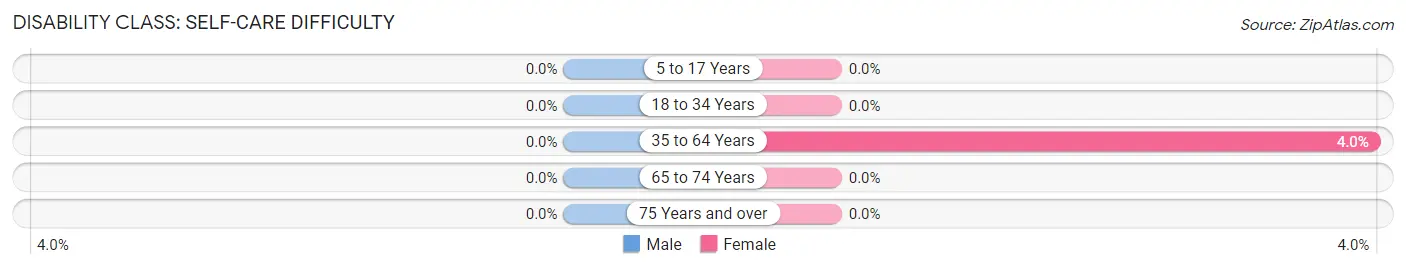
| Age Bracket | Male | Female |
| 5 to 17 Years | 0 (0.0%) | 0 (0.0%) |
| 18 to 34 Years | 0 (0.0%) | 0 (0.0%) |
| 35 to 64 Years | 0 (0.0%) | 5 (4.0%) |
| 65 to 74 Years | 0 (0.0%) | 0 (0.0%) |
| 75 Years and over | 0 (0.0%) | 0 (0.0%) |
Technology Access in Lincoln
Computing Device Access in Lincoln
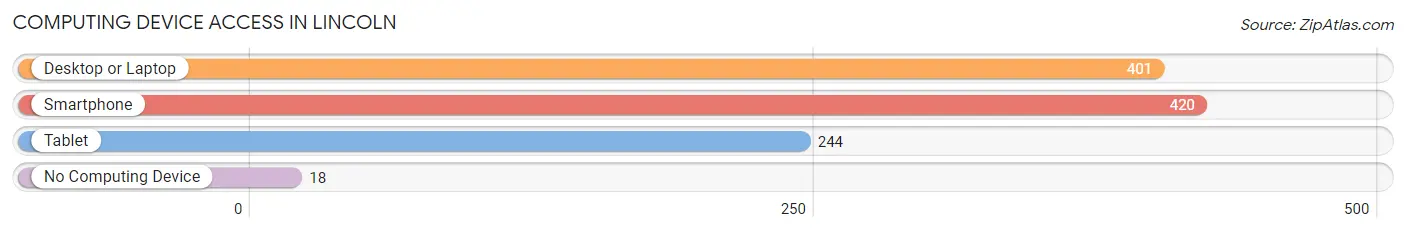
| Device Type | # Households | % Households |
| Desktop or Laptop | 401 | 87.4% |
| Smartphone | 420 | 91.5% |
| Tablet | 244 | 53.2% |
| No Computing Device | 18 | 3.9% |
| Total | 459 | 100.0% |
Internet Access in Lincoln
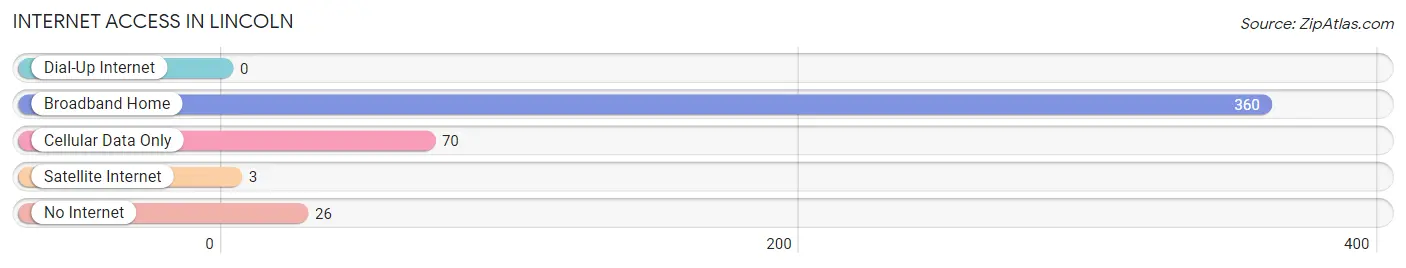
| Internet Type | # Households | % Households |
| Dial-Up Internet | 0 | 0.0% |
| Broadband Home | 360 | 78.4% |
| Cellular Data Only | 70 | 15.2% |
| Satellite Internet | 3 | 0.6% |
| No Internet | 26 | 5.7% |
| Total | 459 | 100.0% |
Lincoln Summary
Lincoln, New Hampshire is a small town located in the White Mountains region of the state. It is situated in Grafton County, and is part of the larger Plymouth-Laconia metropolitan area. The town has a population of 1,662 people, according to the 2010 census.
History
Lincoln was first settled in 1764 by a group of settlers from Massachusetts. The town was named after Henry Lincoln, a prominent local landowner. The town was incorporated in 1782, and the first town meeting was held in 1783.
In the early 19th century, Lincoln was a thriving agricultural community. The town was home to several sawmills, gristmills, and a tannery. The town also had a thriving lumber industry, and the town's first railroad was built in 1848.
In the late 19th century, Lincoln became a popular tourist destination. The town was home to several grand hotels, and the area was known for its scenic beauty. The town was also home to several ski resorts, and the first ski lift in the United States was built in Lincoln in 1936.
Geography
Lincoln is located in the White Mountains region of New Hampshire. The town is situated in Grafton County, and is part of the larger Plymouth-Laconia metropolitan area. The town is bordered by the towns of Woodstock to the north, Franconia to the east, and North Woodstock to the south.
The town is located in the White Mountain National Forest, and is home to several mountains, including Mount Liberty, Mount Flume, and Mount Lafayette. The town is also home to several lakes, including Echo Lake, Loon Lake, and Pemigewasset Lake.
Economy
Lincoln is a small, rural town, and the economy is largely based on tourism. The town is home to several ski resorts, including Loon Mountain, Cannon Mountain, and Waterville Valley. The town is also home to several restaurants, shops, and lodging establishments.
The town is also home to several manufacturing companies, including a paper mill, a furniture factory, and a plastics factory. The town is also home to several small businesses, including a brewery, a winery, and a distillery.
Demographics
According to the 2010 census, Lincoln has a population of 1,662 people. The town has a median household income of $50,000, and the median age is 44. The town is predominantly white, with 95.3% of the population identifying as white. The town also has a small Hispanic population, with 2.2% of the population identifying as Hispanic or Latino.
Conclusion
Lincoln, New Hampshire is a small town located in the White Mountains region of the state. It is situated in Grafton County, and is part of the larger Plymouth-Laconia metropolitan area. The town has a population of 1,662 people, according to the 2010 census. The town is largely based on tourism, and is home to several ski resorts, restaurants, shops, and lodging establishments. The town also has a small manufacturing sector, and is home to several small businesses. The town is predominantly white, with 95.3% of the population identifying as white. The town also has a small Hispanic population, with 2.2% of the population identifying as Hispanic or Latino.
Common Questions
What is Per Capita Income in Lincoln?
Per Capita income in Lincoln is $37,937.
What is the Median Family Income in Lincoln?
Median Family Income in Lincoln is $64,250.
What is the Median Household income in Lincoln?
Median Household Income in Lincoln is $58,125.
What is Income or Wage Gap in Lincoln?
Income or Wage Gap in Lincoln is 4.9%.
Women in Lincoln earn 95.1 cents for every dollar earned by a man.
What is Inequality or Gini Index in Lincoln?
Inequality or Gini Index in Lincoln is 0.46.
What is the Total Population of Lincoln?
Total Population of Lincoln is 1,017.
What is the Total Male Population of Lincoln?
Total Male Population of Lincoln is 578.
What is the Total Female Population of Lincoln?
Total Female Population of Lincoln is 439.
What is the Ratio of Males per 100 Females in Lincoln?
There are 131.66 Males per 100 Females in Lincoln.
What is the Ratio of Females per 100 Males in Lincoln?
There are 75.95 Females per 100 Males in Lincoln.
What is the Median Population Age in Lincoln?
Median Population Age in Lincoln is 46.7 Years.
What is the Average Family Size in Lincoln
Average Family Size in Lincoln is 2.5 People.
What is the Average Household Size in Lincoln
Average Household Size in Lincoln is 2.2 People.
How Large is the Labor Force in Lincoln?
There are 535 People in the Labor Forcein in Lincoln.
What is the Percentage of People in the Labor Force in Lincoln?
62.1% of People are in the Labor Force in Lincoln.
What is the Unemployment Rate in Lincoln?
Unemployment Rate in Lincoln is 2.4%.