Hampton Beach, NH Map & Demographics
Hampton Beach Map
Hampton Beach Overview
$58,718
PER CAPITA INCOME
$128,125
AVG FAMILY INCOME
$73,269
AVG HOUSEHOLD INCOME
25.5%
WAGE / INCOME GAP [ % ]
74.5¢/ $1
WAGE / INCOME GAP [ $ ]
0.48
INEQUALITY / GINI INDEX
2,650
TOTAL POPULATION
1,332
MALE POPULATION
1,318
FEMALE POPULATION
101.06
MALES / 100 FEMALES
98.95
FEMALES / 100 MALES
57.7
MEDIAN AGE
2.7
AVG FAMILY SIZE
2.0
AVG HOUSEHOLD SIZE
1,602
LABOR FORCE [ PEOPLE ]
64.9%
PERCENT IN LABOR FORCE
6.7%
UNEMPLOYMENT RATE
Income in Hampton Beach
Income Overview in Hampton Beach
Per Capita Income in Hampton Beach is $58,718, while median incomes of families and households are $128,125 and $73,269 respectively.
| Characteristic | Number | Measure |
| Per Capita Income | 2,650 | $58,718 |
| Median Family Income | 660 | $128,125 |
| Mean Family Income | 660 | $157,231 |
| Median Household Income | 1,334 | $73,269 |
| Mean Household Income | 1,334 | $114,374 |
| Income Deficit | 660 | $0 |
| Wage / Income Gap (%) | 2,650 | 25.50% |
| Wage / Income Gap ($) | 2,650 | 74.50¢ per $1 |
| Gini / Inequality Index | 2,650 | 0.48 |
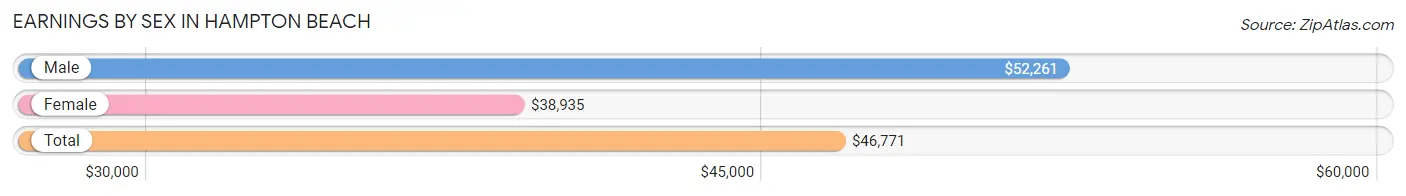
Earnings by Sex in Hampton Beach
Average Earnings in Hampton Beach are $46,771, $52,261 for men and $38,935 for women, a difference of 25.5%.
| Sex | Number | Average Earnings |
| Male | 875 (54.2%) | $52,261 |
| Female | 738 (45.8%) | $38,935 |
| Total | 1,613 (100.0%) | $46,771 |
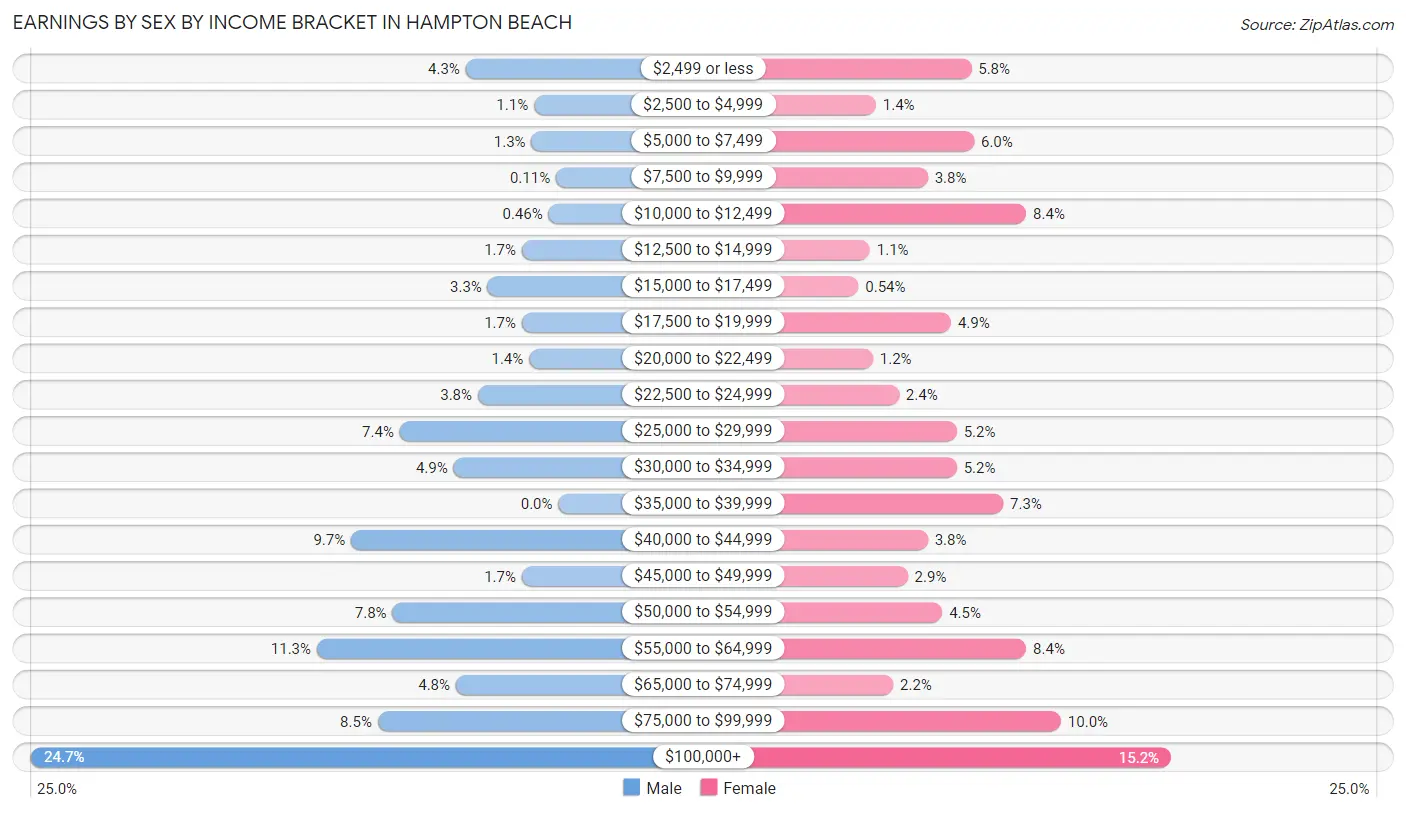
Earnings by Sex by Income Bracket in Hampton Beach
The most common earnings brackets in Hampton Beach are $100,000+ for men (216 | 24.7%) and $100,000+ for women (112 | 15.2%).
| Income | Male | Female |
| $2,499 or less | 38 (4.3%) | 43 (5.8%) |
| $2,500 to $4,999 | 10 (1.1%) | 10 (1.4%) |
| $5,000 to $7,499 | 11 (1.3%) | 44 (6.0%) |
| $7,500 to $9,999 | 1 (0.1%) | 28 (3.8%) |
| $10,000 to $12,499 | 4 (0.5%) | 62 (8.4%) |
| $12,500 to $14,999 | 15 (1.7%) | 8 (1.1%) |
| $15,000 to $17,499 | 29 (3.3%) | 4 (0.5%) |
| $17,500 to $19,999 | 15 (1.7%) | 36 (4.9%) |
| $20,000 to $22,499 | 12 (1.4%) | 9 (1.2%) |
| $22,500 to $24,999 | 33 (3.8%) | 18 (2.4%) |
| $25,000 to $29,999 | 65 (7.4%) | 38 (5.1%) |
| $30,000 to $34,999 | 43 (4.9%) | 38 (5.1%) |
| $35,000 to $39,999 | 0 (0.0%) | 54 (7.3%) |
| $40,000 to $44,999 | 85 (9.7%) | 28 (3.8%) |
| $45,000 to $49,999 | 15 (1.7%) | 21 (2.9%) |
| $50,000 to $54,999 | 68 (7.8%) | 33 (4.5%) |
| $55,000 to $64,999 | 99 (11.3%) | 62 (8.4%) |
| $65,000 to $74,999 | 42 (4.8%) | 16 (2.2%) |
| $75,000 to $99,999 | 74 (8.5%) | 74 (10.0%) |
| $100,000+ | 216 (24.7%) | 112 (15.2%) |
| Total | 875 (100.0%) | 738 (100.0%) |
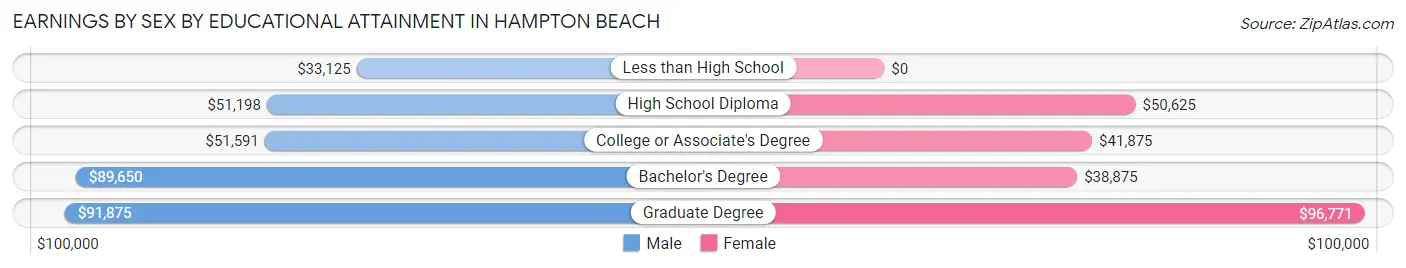
Earnings by Sex by Educational Attainment in Hampton Beach
Average earnings in Hampton Beach are $58,438 for men and $45,060 for women, a difference of 22.9%. Men with an educational attainment of graduate degree enjoy the highest average annual earnings of $91,875, while those with less than high school education earn the least with $33,125. Women with an educational attainment of graduate degree earn the most with the average annual earnings of $96,771, while those with bachelor's degree education have the smallest earnings of $38,875.
| Educational Attainment | Male Income | Female Income |
| Less than High School | $33,125 | $0 |
| High School Diploma | $51,198 | $50,625 |
| College or Associate's Degree | $51,591 | $41,875 |
| Bachelor's Degree | $89,650 | $38,875 |
| Graduate Degree | $91,875 | $96,771 |
| Total | $58,438 | $45,060 |
Family Income in Hampton Beach
Family Income Brackets in Hampton Beach
According to the Hampton Beach family income data, there are 178 families falling into the $200,000+ income range, which is the most common income bracket and makes up 27.0% of all families.
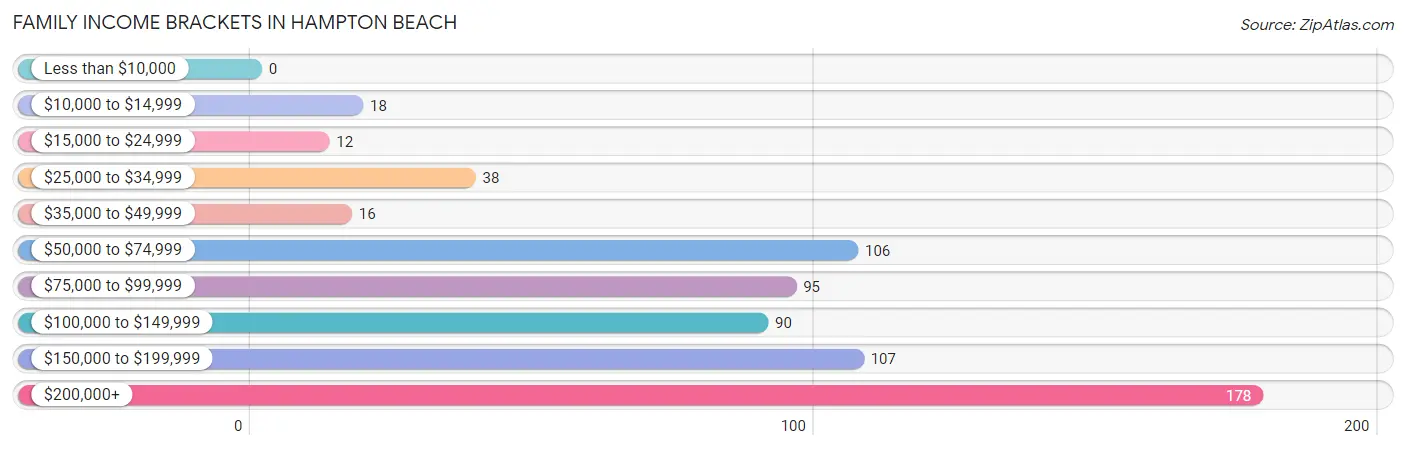
| Income Bracket | # Families | % Families |
| Less than $10,000 | 0 | 0.0% |
| $10,000 to $14,999 | 18 | 2.7% |
| $15,000 to $24,999 | 12 | 1.8% |
| $25,000 to $34,999 | 38 | 5.8% |
| $35,000 to $49,999 | 16 | 2.4% |
| $50,000 to $74,999 | 106 | 16.1% |
| $75,000 to $99,999 | 95 | 14.4% |
| $100,000 to $149,999 | 90 | 13.6% |
| $150,000 to $199,999 | 107 | 16.2% |
| $200,000+ | 178 | 27.0% |
Family Income by Famaliy Size in Hampton Beach
3-person families (82 | 12.4%) account for the highest median family income in Hampton Beach with $250,001 per family, while 3-person families (82 | 12.4%) have the highest median income of $83,334 per family member.
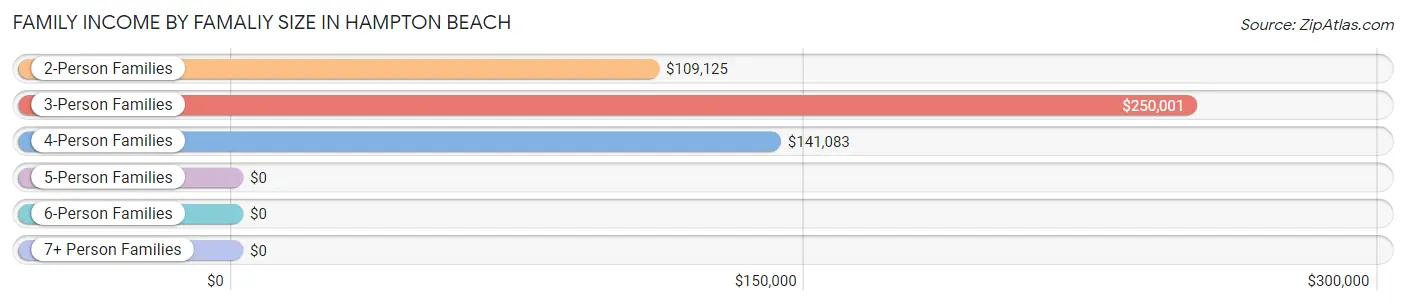
| Income Bracket | # Families | Median Income |
| 2-Person Families | 437 (66.2%) | $109,125 |
| 3-Person Families | 82 (12.4%) | $250,001 |
| 4-Person Families | 115 (17.4%) | $141,083 |
| 5-Person Families | 20 (3.0%) | $0 |
| 6-Person Families | 6 (0.9%) | $0 |
| 7+ Person Families | 0 (0.0%) | $0 |
| Total | 660 (100.0%) | $128,125 |
Family Income by Number of Earners in Hampton Beach
The median family income in Hampton Beach is $128,125, with families comprising 3+ earners (65) having the highest median family income of $168,906, while families with no earners (128) have the lowest median family income of $71,875, accounting for 9.9% and 19.4% of families, respectively.
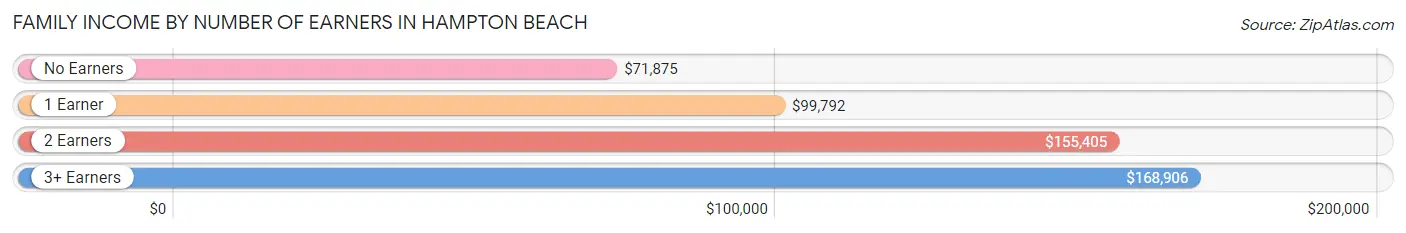
| Number of Earners | # Families | Median Income |
| No Earners | 128 (19.4%) | $71,875 |
| 1 Earner | 167 (25.3%) | $99,792 |
| 2 Earners | 300 (45.5%) | $155,405 |
| 3+ Earners | 65 (9.9%) | $168,906 |
| Total | 660 (100.0%) | $128,125 |
Household Income in Hampton Beach
Household Income Brackets in Hampton Beach
With 277 households falling in the category, the $50,000 to $74,999 income range is the most frequent in Hampton Beach, accounting for 20.8% of all households. In contrast, only 33 households (2.5%) fall into the $10,000 to $14,999 income bracket, making it the least populous group.
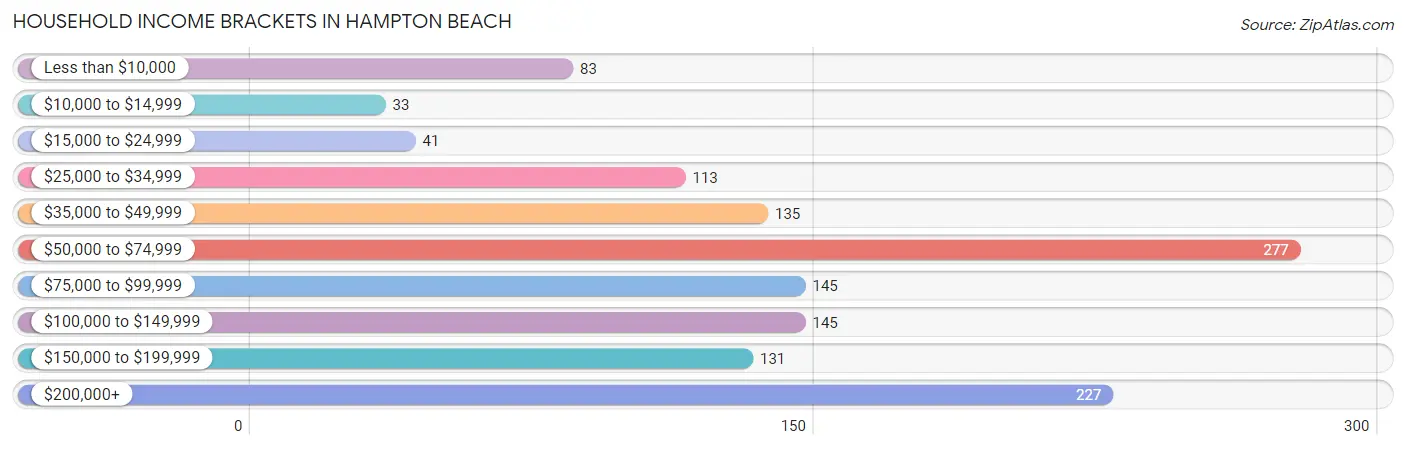
| Income Bracket | # Households | % Households |
| Less than $10,000 | 83 | 6.2% |
| $10,000 to $14,999 | 33 | 2.5% |
| $15,000 to $24,999 | 41 | 3.1% |
| $25,000 to $34,999 | 113 | 8.5% |
| $35,000 to $49,999 | 135 | 10.1% |
| $50,000 to $74,999 | 277 | 20.8% |
| $75,000 to $99,999 | 145 | 10.9% |
| $100,000 to $149,999 | 145 | 10.9% |
| $150,000 to $199,999 | 131 | 9.8% |
| $200,000+ | 227 | 17.0% |
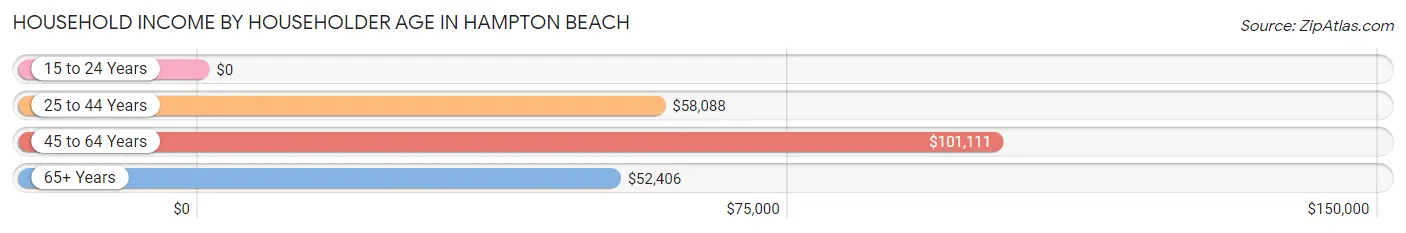
Household Income by Householder Age in Hampton Beach
The median household income in Hampton Beach is $73,269, with the highest median household income of $101,111 found in the 45 to 64 years age bracket for the primary householder. A total of 712 households (53.4%) fall into this category. Meanwhile, the 15 to 24 years age bracket for the primary householder has the lowest median household income of $0, with 31 households (2.3%) in this group.
| Income Bracket | # Households | Median Income |
| 15 to 24 Years | 31 (2.3%) | $0 |
| 25 to 44 Years | 134 (10.0%) | $58,088 |
| 45 to 64 Years | 712 (53.4%) | $101,111 |
| 65+ Years | 457 (34.3%) | $52,406 |
| Total | 1,334 (100.0%) | $73,269 |
Poverty in Hampton Beach
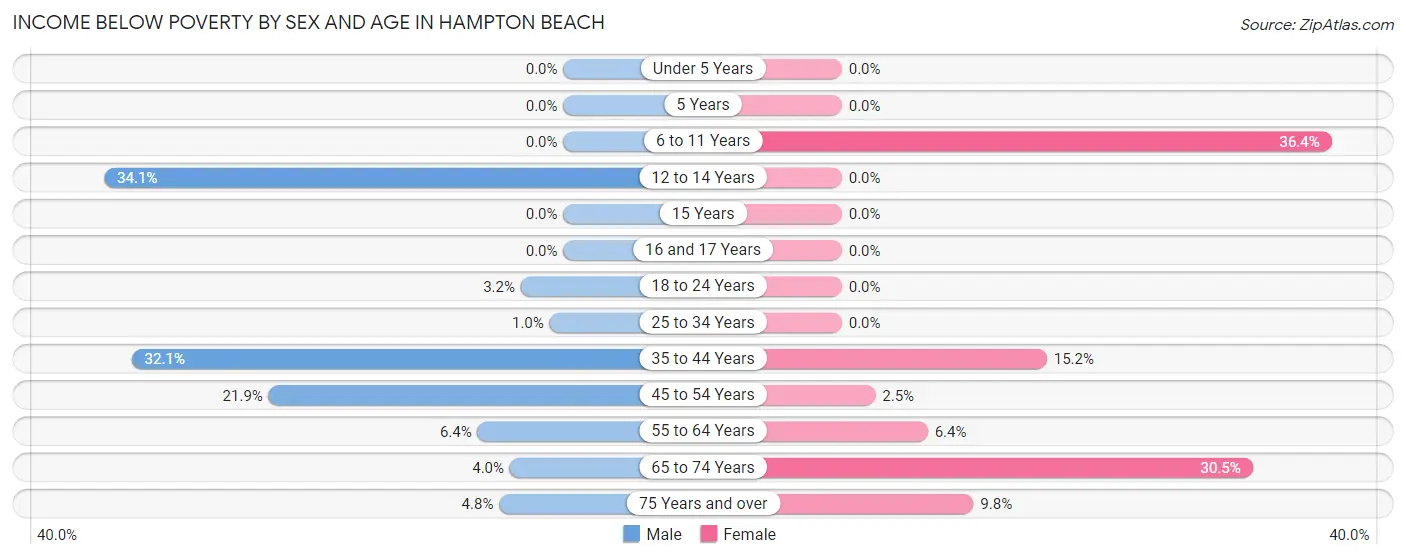
Income Below Poverty by Sex and Age in Hampton Beach
With 9.3% poverty level for males and 11.5% for females among the residents of Hampton Beach, 12 to 14 year old males and 6 to 11 year old females are the most vulnerable to poverty, with 30 males (34.1%) and 12 females (36.4%) in their respective age groups living below the poverty level.
| Age Bracket | Male | Female |
| Under 5 Years | 0 (0.0%) | 0 (0.0%) |
| 5 Years | 0 (0.0%) | 0 (0.0%) |
| 6 to 11 Years | 0 (0.0%) | 12 (36.4%) |
| 12 to 14 Years | 30 (34.1%) | 0 (0.0%) |
| 15 Years | 0 (0.0%) | 0 (0.0%) |
| 16 and 17 Years | 0 (0.0%) | 0 (0.0%) |
| 18 to 24 Years | 5 (3.2%) | 0 (0.0%) |
| 25 to 34 Years | 1 (1.0%) | 0 (0.0%) |
| 35 to 44 Years | 25 (32.1%) | 14 (15.2%) |
| 45 to 54 Years | 21 (21.9%) | 7 (2.5%) |
| 55 to 64 Years | 30 (6.4%) | 19 (6.4%) |
| 65 to 74 Years | 6 (4.0%) | 86 (30.5%) |
| 75 Years and over | 6 (4.8%) | 13 (9.8%) |
| Total | 124 (9.3%) | 151 (11.5%) |
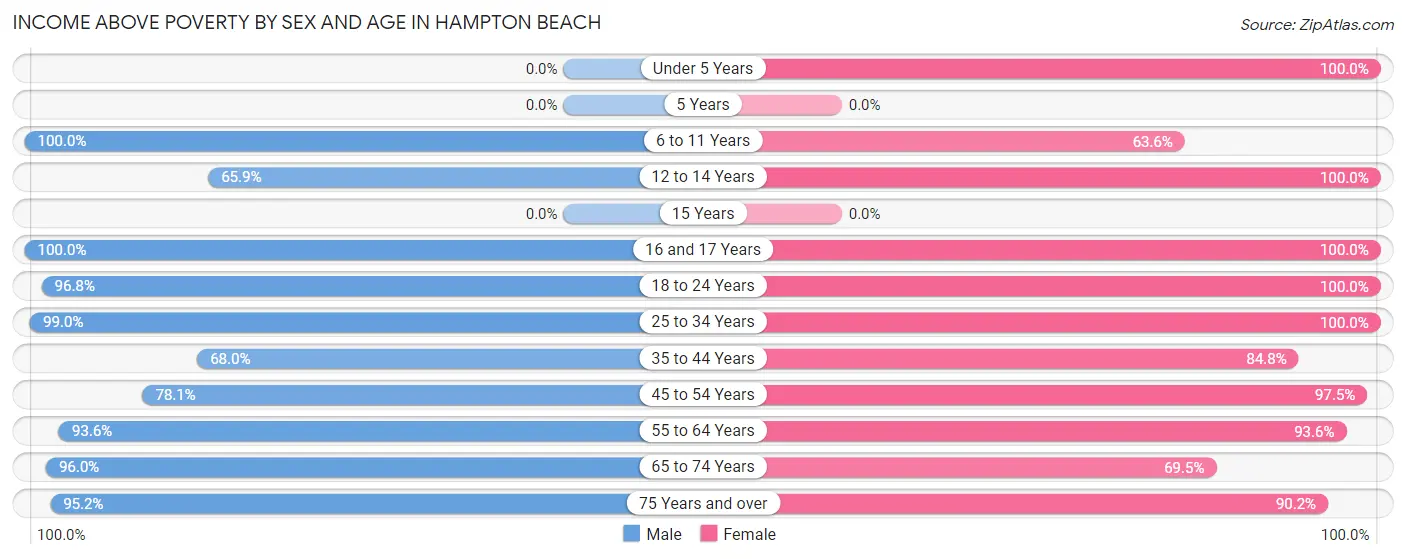
Income Above Poverty by Sex and Age in Hampton Beach
According to the poverty statistics in Hampton Beach, males aged 6 to 11 years and females aged under 5 years are the age groups that are most secure financially, with 100.0% of males and 100.0% of females in these age groups living above the poverty line.
| Age Bracket | Male | Female |
| Under 5 Years | 0 (0.0%) | 6 (100.0%) |
| 5 Years | 0 (0.0%) | 0 (0.0%) |
| 6 to 11 Years | 50 (100.0%) | 21 (63.6%) |
| 12 to 14 Years | 58 (65.9%) | 5 (100.0%) |
| 15 Years | 0 (0.0%) | 0 (0.0%) |
| 16 and 17 Years | 16 (100.0%) | 68 (100.0%) |
| 18 to 24 Years | 153 (96.8%) | 86 (100.0%) |
| 25 to 34 Years | 97 (99.0%) | 34 (100.0%) |
| 35 to 44 Years | 53 (67.9%) | 78 (84.8%) |
| 45 to 54 Years | 75 (78.1%) | 274 (97.5%) |
| 55 to 64 Years | 441 (93.6%) | 279 (93.6%) |
| 65 to 74 Years | 145 (96.0%) | 196 (69.5%) |
| 75 Years and over | 120 (95.2%) | 120 (90.2%) |
| Total | 1,208 (90.7%) | 1,167 (88.5%) |
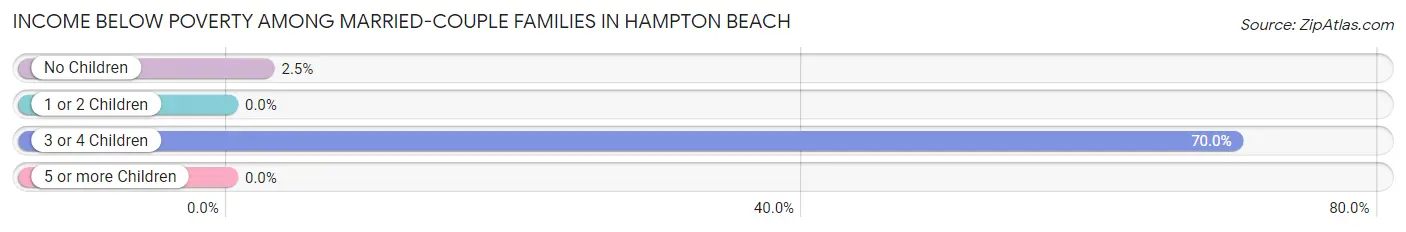
Income Below Poverty Among Married-Couple Families in Hampton Beach
The poverty statistics for married-couple families in Hampton Beach show that 4.5% or 26 of the total 575 families live below the poverty line. Families with 3 or 4 children have the highest poverty rate of 70.0%, comprising of 14 families. On the other hand, families with 1 or 2 children have the lowest poverty rate of 0.0%, which includes 0 families.
| Children | Above Poverty | Below Poverty |
| No Children | 460 (97.5%) | 12 (2.5%) |
| 1 or 2 Children | 83 (100.0%) | 0 (0.0%) |
| 3 or 4 Children | 6 (30.0%) | 14 (70.0%) |
| 5 or more Children | 0 (0.0%) | 0 (0.0%) |
| Total | 549 (95.5%) | 26 (4.5%) |
Income Below Poverty Among Single-Parent Households in Hampton Beach
According to the poverty data in Hampton Beach, 3.2% or 1 single-father households and 9.3% or 5 single-mother households are living below the poverty line. Among single-father households, those with no children have the highest poverty rate, with 1 households (9.1%) experiencing poverty. Likewise, among single-mother households, those with no children have the highest poverty rate, with 5 households (18.5%) falling below the poverty line.
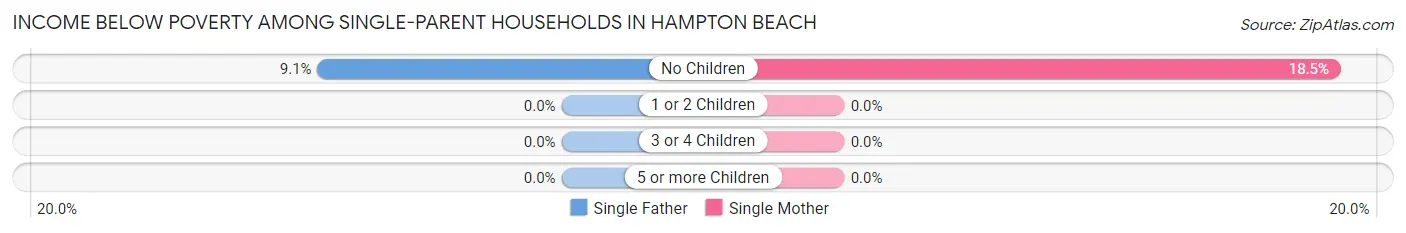
| Children | Single Father | Single Mother |
| No Children | 1 (9.1%) | 5 (18.5%) |
| 1 or 2 Children | 0 (0.0%) | 0 (0.0%) |
| 3 or 4 Children | 0 (0.0%) | 0 (0.0%) |
| 5 or more Children | 0 (0.0%) | 0 (0.0%) |
| Total | 1 (3.2%) | 5 (9.3%) |
Income Below Poverty Among Married-Couple vs Single-Parent Households in Hampton Beach
The poverty data for Hampton Beach shows that 26 of the married-couple family households (4.5%) and 6 of the single-parent households (7.1%) are living below the poverty level. Within the married-couple family households, those with 3 or 4 children have the highest poverty rate, with 14 households (70.0%) falling below the poverty line. Among the single-parent households, those with no children have the highest poverty rate, with 6 household (15.8%) living below poverty.
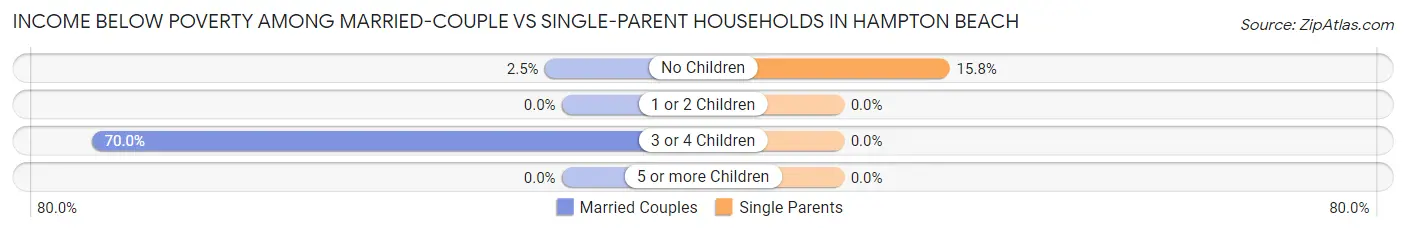
| Children | Married-Couple Families | Single-Parent Households |
| No Children | 12 (2.5%) | 6 (15.8%) |
| 1 or 2 Children | 0 (0.0%) | 0 (0.0%) |
| 3 or 4 Children | 14 (70.0%) | 0 (0.0%) |
| 5 or more Children | 0 (0.0%) | 0 (0.0%) |
| Total | 26 (4.5%) | 6 (7.1%) |
Race in Hampton Beach
The most populous races in Hampton Beach are White / Caucasian (2,538 | 95.8%), Hispanic or Latino (122 | 4.6%), and Two or more Races (68 | 2.6%).
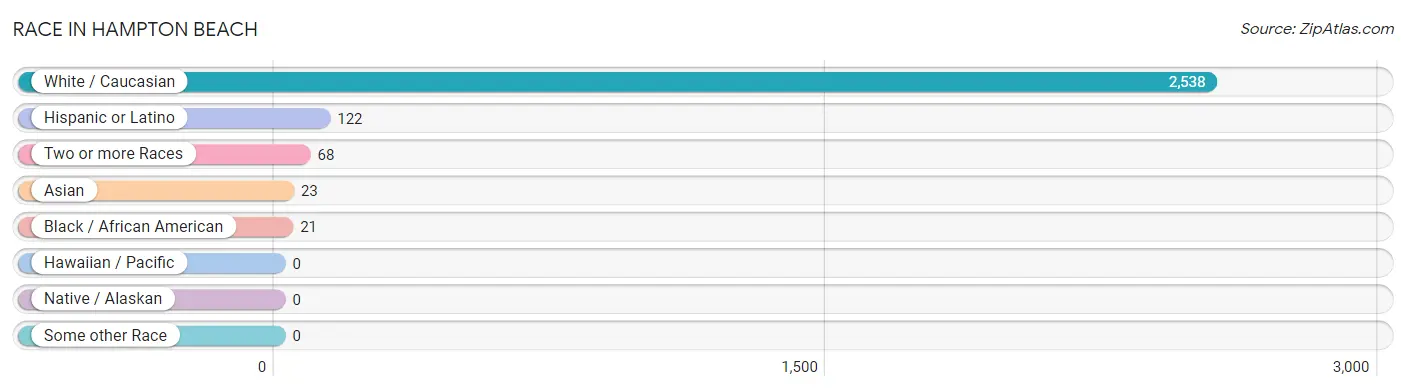
| Race | # Population | % Population |
| Asian | 23 | 0.9% |
| Black / African American | 21 | 0.8% |
| Hawaiian / Pacific | 0 | 0.0% |
| Hispanic or Latino | 122 | 4.6% |
| Native / Alaskan | 0 | 0.0% |
| White / Caucasian | 2,538 | 95.8% |
| Two or more Races | 68 | 2.6% |
| Some other Race | 0 | 0.0% |
| Total | 2,650 | 100.0% |
Ancestry in Hampton Beach
The most populous ancestries reported in Hampton Beach are Irish (971 | 36.6%), Italian (510 | 19.3%), French (441 | 16.6%), English (339 | 12.8%), and Polish (155 | 5.9%), together accounting for 91.2% of all Hampton Beach residents.
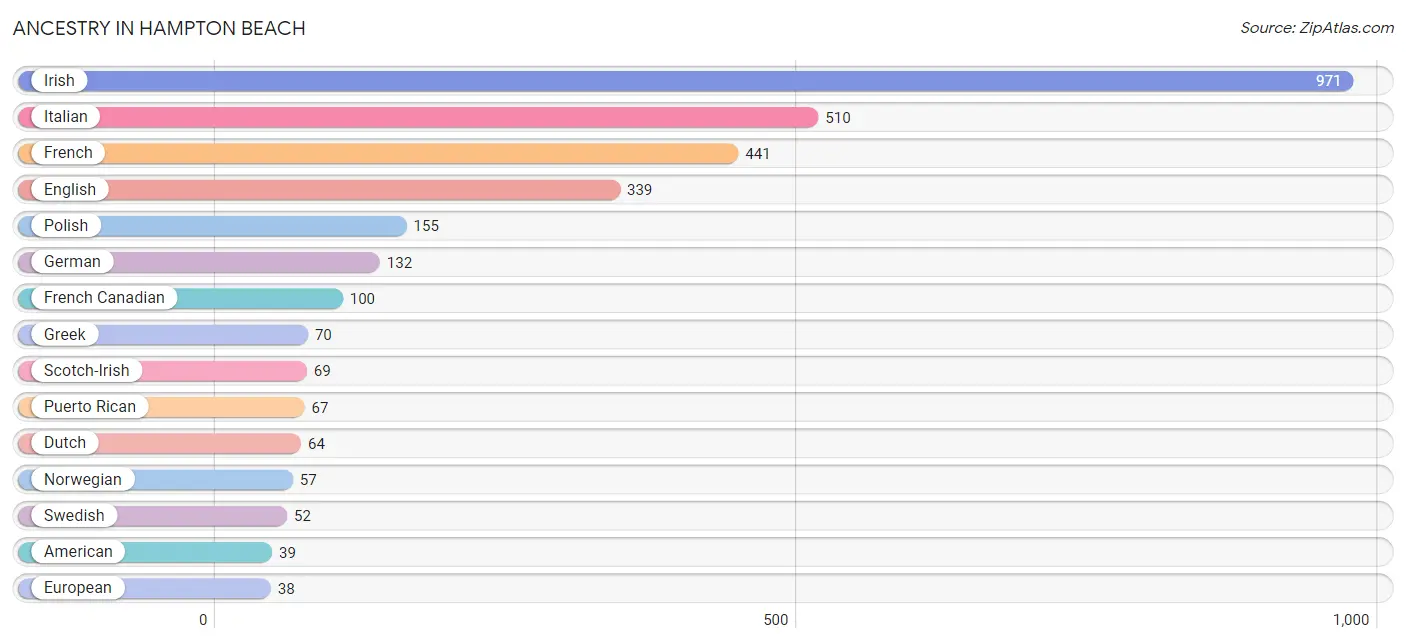
| Ancestry | # Population | % Population |
| American | 39 | 1.5% |
| Arab | 8 | 0.3% |
| Armenian | 12 | 0.4% |
| British | 25 | 0.9% |
| Burmese | 9 | 0.3% |
| Canadian | 5 | 0.2% |
| Central American | 5 | 0.2% |
| Cherokee | 20 | 0.7% |
| Colombian | 12 | 0.4% |
| Dominican | 8 | 0.3% |
| Dutch | 64 | 2.4% |
| Eastern European | 5 | 0.2% |
| Egyptian | 3 | 0.1% |
| English | 339 | 12.8% |
| European | 38 | 1.4% |
| Finnish | 15 | 0.6% |
| French | 441 | 16.6% |
| French Canadian | 100 | 3.8% |
| German | 132 | 5.0% |
| Greek | 70 | 2.6% |
| Indian (Asian) | 19 | 0.7% |
| Irish | 971 | 36.6% |
| Italian | 510 | 19.3% |
| Latvian | 4 | 0.2% |
| Lithuanian | 12 | 0.4% |
| Mexican | 30 | 1.1% |
| Nicaraguan | 5 | 0.2% |
| Northern European | 9 | 0.3% |
| Norwegian | 57 | 2.1% |
| Polish | 155 | 5.9% |
| Puerto Rican | 67 | 2.5% |
| Scotch-Irish | 69 | 2.6% |
| Scottish | 14 | 0.5% |
| South American | 12 | 0.4% |
| Swedish | 52 | 2.0% |
| Syrian | 5 | 0.2% |
| Ukrainian | 12 | 0.4% |
| Welsh | 10 | 0.4% | View All 38 Rows |
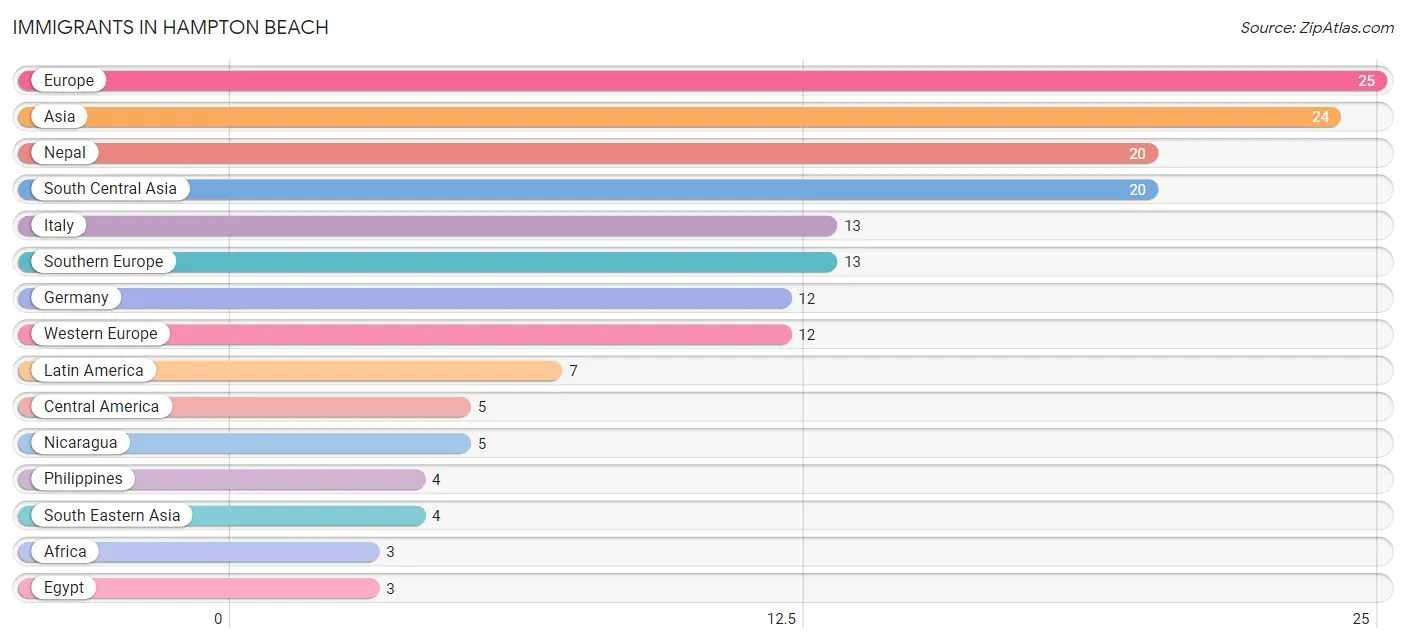
Immigrants in Hampton Beach
The most numerous immigrant groups reported in Hampton Beach came from Europe (25 | 0.9%), Asia (24 | 0.9%), Nepal (20 | 0.7%), South Central Asia (20 | 0.7%), and Italy (13 | 0.5%), together accounting for 3.8% of all Hampton Beach residents.
| Immigration Origin | # Population | % Population |
| Africa | 3 | 0.1% |
| Asia | 24 | 0.9% |
| Caribbean | 2 | 0.1% |
| Central America | 5 | 0.2% |
| Dominican Republic | 2 | 0.1% |
| Egypt | 3 | 0.1% |
| Europe | 25 | 0.9% |
| Germany | 12 | 0.4% |
| Italy | 13 | 0.5% |
| Latin America | 7 | 0.3% |
| Nepal | 20 | 0.7% |
| Nicaragua | 5 | 0.2% |
| Northern Africa | 3 | 0.1% |
| Philippines | 4 | 0.2% |
| South Central Asia | 20 | 0.7% |
| South Eastern Asia | 4 | 0.2% |
| Southern Europe | 13 | 0.5% |
| Western Europe | 12 | 0.4% | View All 18 Rows |
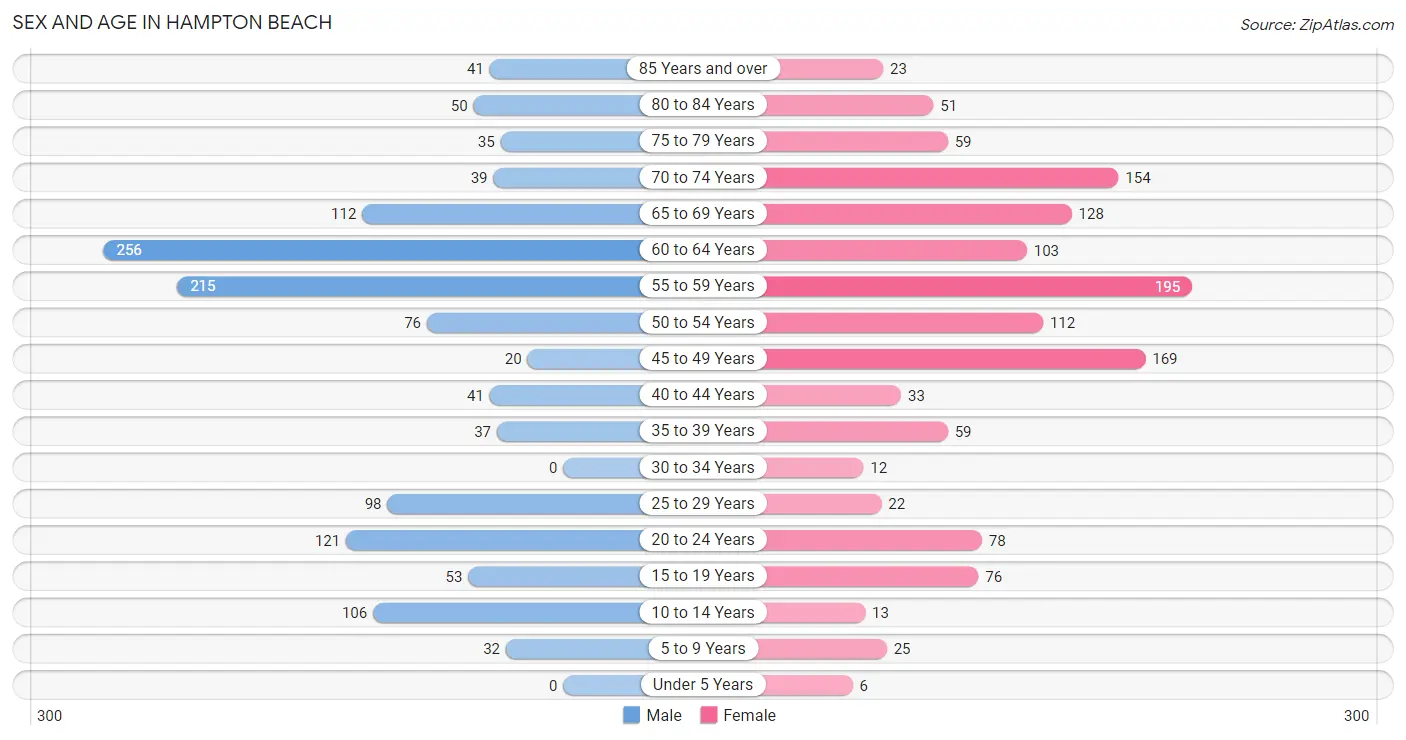
Sex and Age in Hampton Beach
Sex and Age in Hampton Beach
The most populous age groups in Hampton Beach are 60 to 64 Years (256 | 19.2%) for men and 55 to 59 Years (195 | 14.8%) for women.
| Age Bracket | Male | Female |
| Under 5 Years | 0 (0.0%) | 6 (0.5%) |
| 5 to 9 Years | 32 (2.4%) | 25 (1.9%) |
| 10 to 14 Years | 106 (8.0%) | 13 (1.0%) |
| 15 to 19 Years | 53 (4.0%) | 76 (5.8%) |
| 20 to 24 Years | 121 (9.1%) | 78 (5.9%) |
| 25 to 29 Years | 98 (7.4%) | 22 (1.7%) |
| 30 to 34 Years | 0 (0.0%) | 12 (0.9%) |
| 35 to 39 Years | 37 (2.8%) | 59 (4.5%) |
| 40 to 44 Years | 41 (3.1%) | 33 (2.5%) |
| 45 to 49 Years | 20 (1.5%) | 169 (12.8%) |
| 50 to 54 Years | 76 (5.7%) | 112 (8.5%) |
| 55 to 59 Years | 215 (16.1%) | 195 (14.8%) |
| 60 to 64 Years | 256 (19.2%) | 103 (7.8%) |
| 65 to 69 Years | 112 (8.4%) | 128 (9.7%) |
| 70 to 74 Years | 39 (2.9%) | 154 (11.7%) |
| 75 to 79 Years | 35 (2.6%) | 59 (4.5%) |
| 80 to 84 Years | 50 (3.7%) | 51 (3.9%) |
| 85 Years and over | 41 (3.1%) | 23 (1.8%) |
| Total | 1,332 (100.0%) | 1,318 (100.0%) |
Families and Households in Hampton Beach
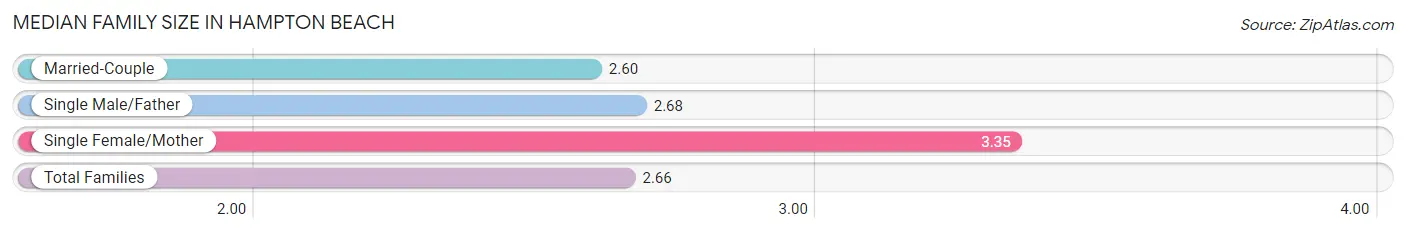
Median Family Size in Hampton Beach
The median family size in Hampton Beach is 2.66 persons per family, with single female/mother families (54 | 8.2%) accounting for the largest median family size of 3.35 persons per family. On the other hand, married-couple families (575 | 87.1%) represent the smallest median family size with 2.60 persons per family.
| Family Type | # Families | Family Size |
| Married-Couple | 575 (87.1%) | 2.60 |
| Single Male/Father | 31 (4.7%) | 2.68 |
| Single Female/Mother | 54 (8.2%) | 3.35 |
| Total Families | 660 (100.0%) | 2.66 |
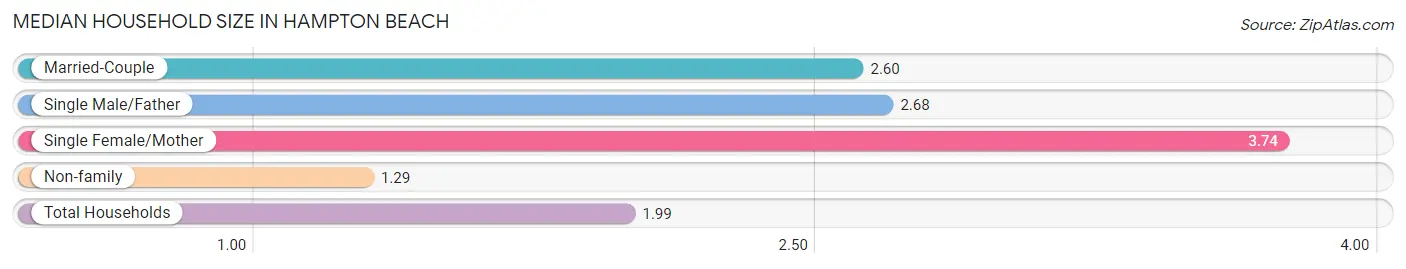
Median Household Size in Hampton Beach
The median household size in Hampton Beach is 1.99 persons per household, with single female/mother households (54 | 4.1%) accounting for the largest median household size of 3.74 persons per household. non-family households (674 | 50.5%) represent the smallest median household size with 1.29 persons per household.
| Household Type | # Households | Household Size |
| Married-Couple | 575 (43.1%) | 2.60 |
| Single Male/Father | 31 (2.3%) | 2.68 |
| Single Female/Mother | 54 (4.1%) | 3.74 |
| Non-family | 674 (50.5%) | 1.29 |
| Total Households | 1,334 (100.0%) | 1.99 |
Household Size by Marriage Status in Hampton Beach
Out of a total of 1,334 households in Hampton Beach, 660 (49.5%) are family households, while 674 (50.5%) are nonfamily households. The most numerous type of family households are 2-person households, comprising 425, and the most common type of nonfamily households are 1-person households, comprising 498.
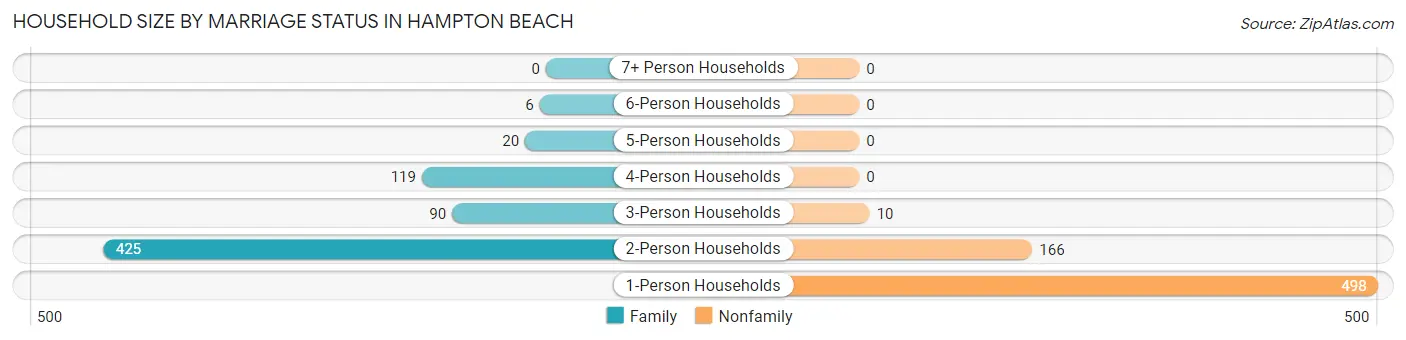
| Household Size | Family Households | Nonfamily Households |
| 1-Person Households | - | 498 (37.3%) |
| 2-Person Households | 425 (31.9%) | 166 (12.4%) |
| 3-Person Households | 90 (6.8%) | 10 (0.7%) |
| 4-Person Households | 119 (8.9%) | 0 (0.0%) |
| 5-Person Households | 20 (1.5%) | 0 (0.0%) |
| 6-Person Households | 6 (0.4%) | 0 (0.0%) |
| 7+ Person Households | 0 (0.0%) | 0 (0.0%) |
| Total | 660 (49.5%) | 674 (50.5%) |
Female Fertility in Hampton Beach
Fertility by Age in Hampton Beach
| Age Bracket | Women with Births | Births / 1,000 Women |
| 15 to 19 years | 0 (0.0%) | 0.0 |
| 20 to 34 years | 0 (0.0%) | 0.0 |
| 35 to 50 years | 0 (0.0%) | 0.0 |
| Total | 0 (0.0%) | 0.0 |
Fertility by Age by Marriage Status in Hampton Beach
| Age Bracket | Married | Unmarried |
| 15 to 19 years | 0 (0.0%) | 0 (0.0%) |
| 20 to 34 years | 0 (0.0%) | 0 (0.0%) |
| 35 to 50 years | 0 (0.0%) | 0 (0.0%) |
| Total | 0 (0.0%) | 0 (0.0%) |
Fertility by Education in Hampton Beach
| Educational Attainment | Women with Births | Births / 1,000 Women |
| Less than High School | 0 (0.0%) | 0.0 |
| High School Diploma | 0 (0.0%) | 0.0 |
| College or Associate's Degree | 0 (0.0%) | 0.0 |
| Bachelor's Degree | 0 (0.0%) | 0.0 |
| Graduate Degree | 0 (0.0%) | 0.0 |
| Total | 0 (0.0%) | 0.0 |
Fertility by Education by Marriage Status in Hampton Beach
| Educational Attainment | Married | Unmarried |
| Less than High School | 0 (0.0%) | 0 (0.0%) |
| High School Diploma | 0 (0.0%) | 0 (0.0%) |
| College or Associate's Degree | 0 (0.0%) | 0 (0.0%) |
| Bachelor's Degree | 0 (0.0%) | 0 (0.0%) |
| Graduate Degree | 0 (0.0%) | 0 (0.0%) |
| Total | 0 (0.0%) | 0 (0.0%) |
Employment Characteristics in Hampton Beach
Employment by Class of Employer in Hampton Beach
Among the 1,448 employed individuals in Hampton Beach, private company employees (941 | 65.0%), self-employed (not incorporated) (169 | 11.7%), and not-for-profit organizations (98 | 6.8%) make up the most common classes of employment.
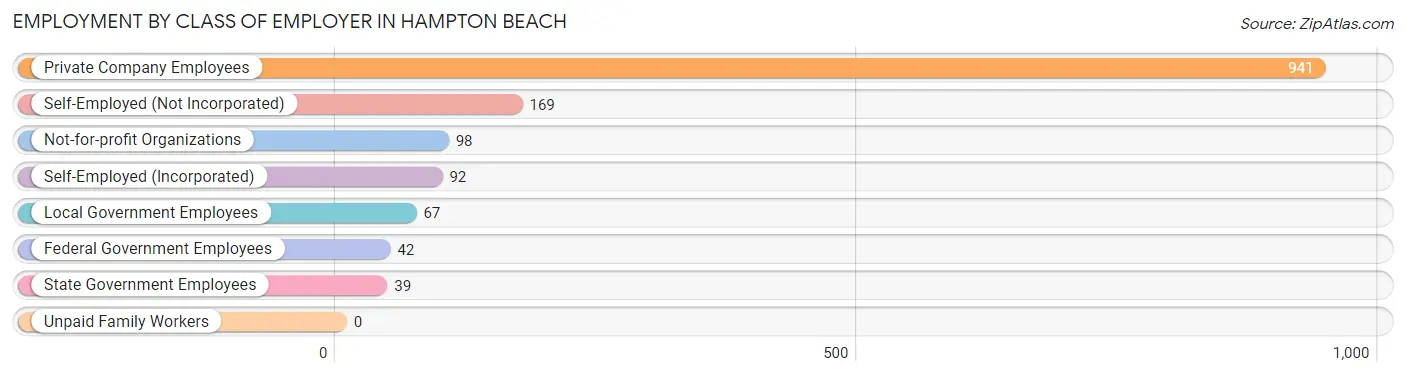
| Employer Class | # Employees | % Employees |
| Private Company Employees | 941 | 65.0% |
| Self-Employed (Incorporated) | 92 | 6.4% |
| Self-Employed (Not Incorporated) | 169 | 11.7% |
| Not-for-profit Organizations | 98 | 6.8% |
| Local Government Employees | 67 | 4.6% |
| State Government Employees | 39 | 2.7% |
| Federal Government Employees | 42 | 2.9% |
| Unpaid Family Workers | 0 | 0.0% |
| Total | 1,448 | 100.0% |
Employment Status by Age in Hampton Beach
According to the labor force statistics for Hampton Beach, out of the total population over 16 years of age (2,468), 64.9% or 1,602 individuals are in the labor force, with 6.7% or 107 of them unemployed. The age group with the highest labor force participation rate is 30 to 34 years, with 100.0% or 12 individuals in the labor force. Within the labor force, the 20 to 24 years age range has the highest percentage of unemployed individuals, with 12.7% or 23 of them being unemployed.
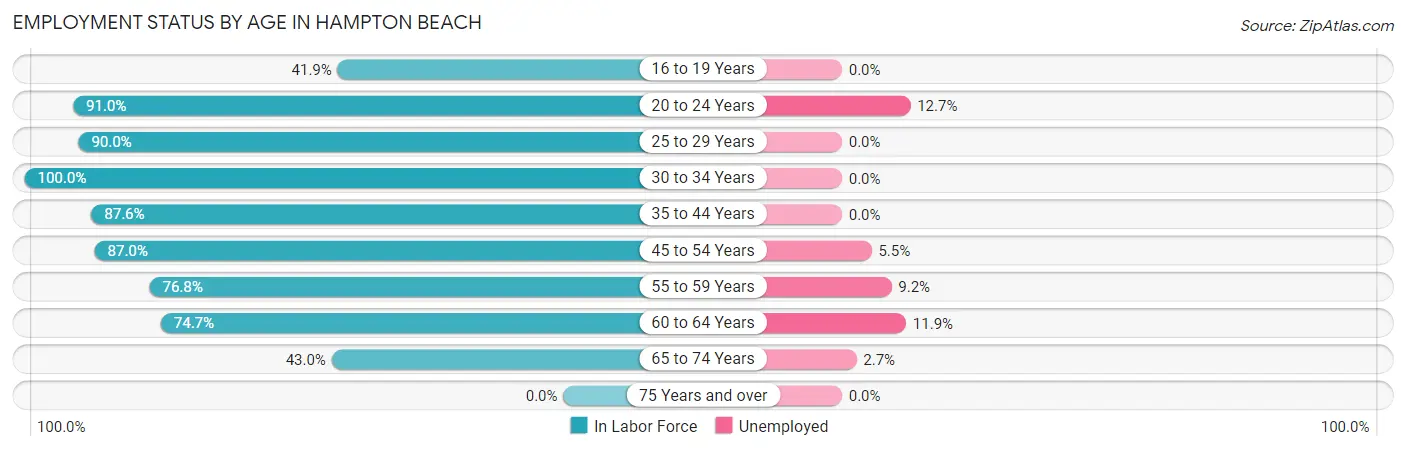
| Age Bracket | In Labor Force | Unemployed |
| 16 to 19 Years | 54 (41.9%) | 0 (0.0%) |
| 20 to 24 Years | 181 (91.0%) | 23 (12.7%) |
| 25 to 29 Years | 108 (90.0%) | 0 (0.0%) |
| 30 to 34 Years | 12 (100.0%) | 0 (0.0%) |
| 35 to 44 Years | 149 (87.6%) | 0 (0.0%) |
| 45 to 54 Years | 328 (87.0%) | 18 (5.5%) |
| 55 to 59 Years | 315 (76.8%) | 29 (9.2%) |
| 60 to 64 Years | 268 (74.7%) | 32 (11.9%) |
| 65 to 74 Years | 186 (43.0%) | 5 (2.7%) |
| 75 Years and over | 0 (0.0%) | 0 (0.0%) |
| Total | 1,602 (64.9%) | 107 (6.7%) |
Employment Status by Educational Attainment in Hampton Beach
According to labor force statistics for Hampton Beach, 81.5% of individuals (1,180) out of the total population between 25 and 64 years of age (1,448) are in the labor force, with 6.7% or 79 of them being unemployed. The group with the highest labor force participation rate are those with the educational attainment of bachelor's degree or higher, with 91.8% or 570 individuals in the labor force. Within the labor force, individuals with bachelor's degree or higher education have the highest percentage of unemployment, with 9.8% or 56 of them being unemployed.
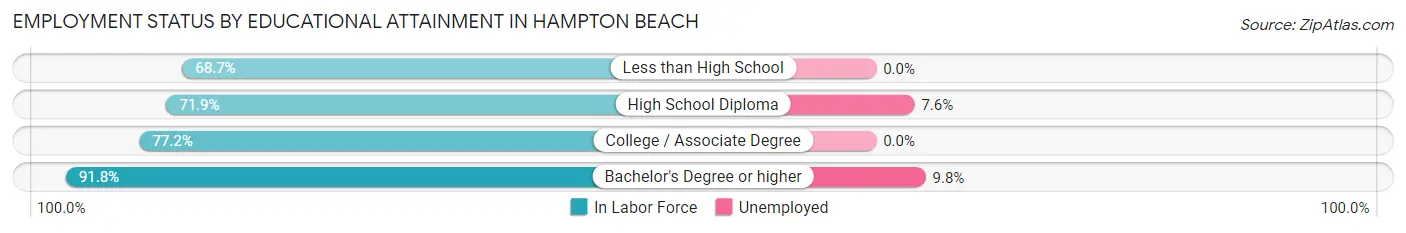
| Educational Attainment | In Labor Force | Unemployed |
| Less than High School | 46 (68.7%) | 0 (0.0%) |
| High School Diploma | 304 (71.9%) | 32 (7.6%) |
| College / Associate Degree | 260 (77.2%) | 0 (0.0%) |
| Bachelor's Degree or higher | 570 (91.8%) | 61 (9.8%) |
| Total | 1,180 (81.5%) | 97 (6.7%) |
Employment Occupations by Sex in Hampton Beach
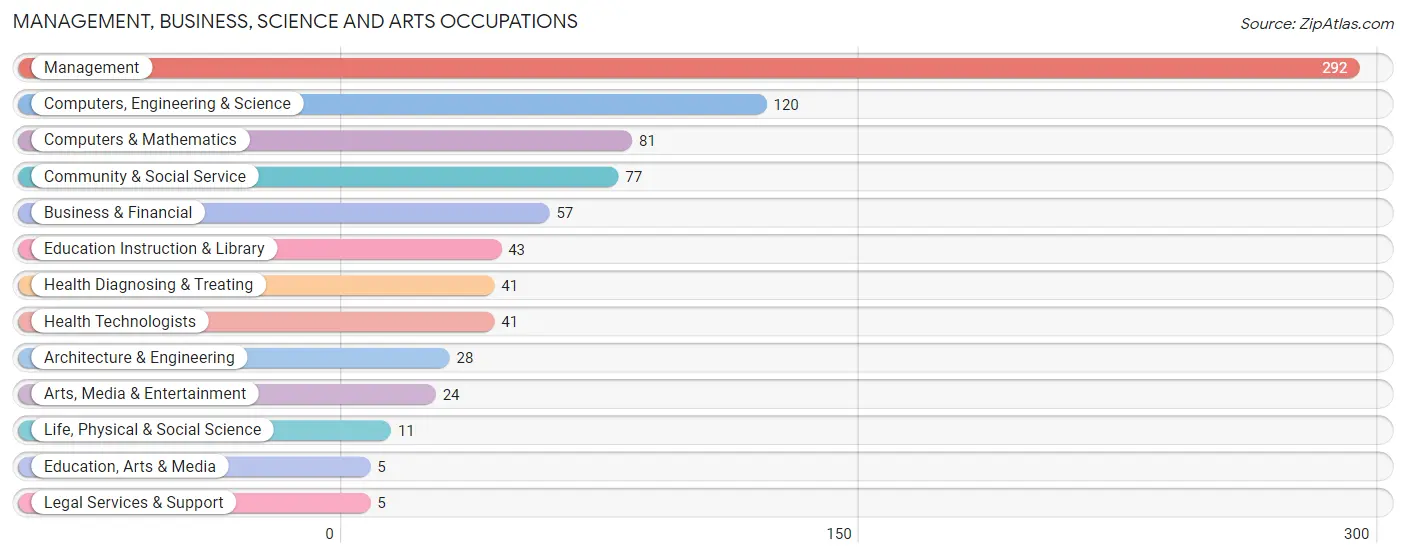
Management, Business, Science and Arts Occupations
The most common Management, Business, Science and Arts occupations in Hampton Beach are Management (292 | 19.5%), Computers, Engineering & Science (120 | 8.0%), Computers & Mathematics (81 | 5.4%), Community & Social Service (77 | 5.1%), and Business & Financial (57 | 3.8%).
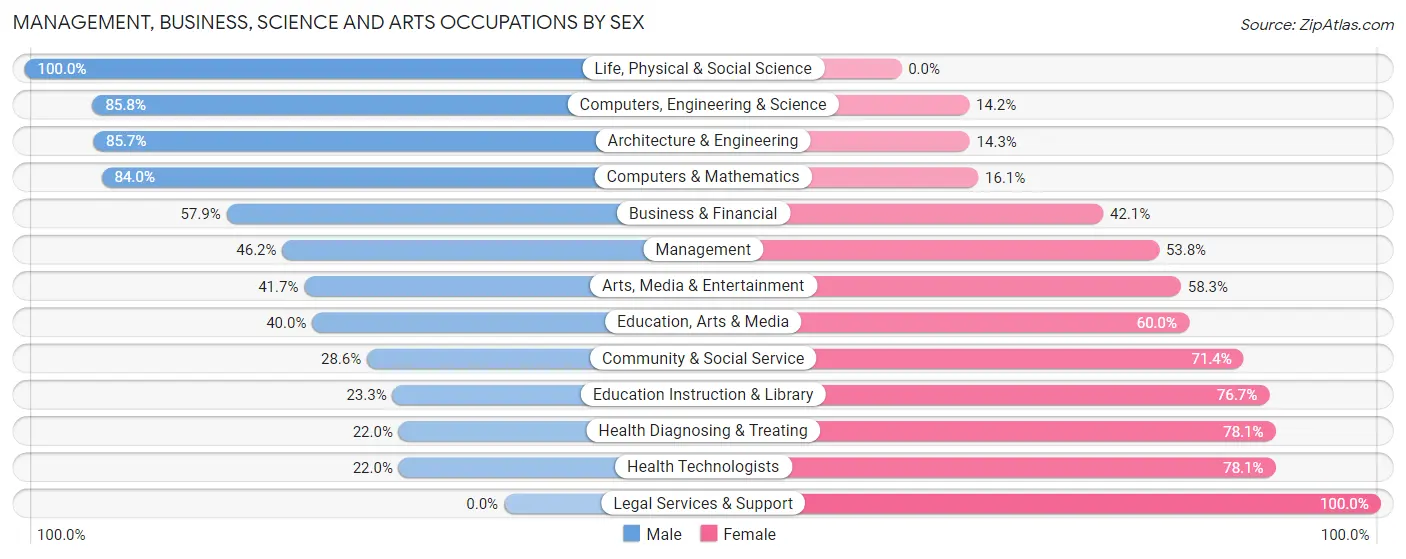
Management, Business, Science and Arts Occupations by Sex
Within the Management, Business, Science and Arts occupations in Hampton Beach, the most male-oriented occupations are Life, Physical & Social Science (100.0%), Computers, Engineering & Science (85.8%), and Architecture & Engineering (85.7%), while the most female-oriented occupations are Legal Services & Support (100.0%), Health Diagnosing & Treating (78.0%), and Health Technologists (78.0%).
| Occupation | Male | Female |
| Management | 135 (46.2%) | 157 (53.8%) |
| Business & Financial | 33 (57.9%) | 24 (42.1%) |
| Computers, Engineering & Science | 103 (85.8%) | 17 (14.2%) |
| Computers & Mathematics | 68 (84.0%) | 13 (16.1%) |
| Architecture & Engineering | 24 (85.7%) | 4 (14.3%) |
| Life, Physical & Social Science | 11 (100.0%) | 0 (0.0%) |
| Community & Social Service | 22 (28.6%) | 55 (71.4%) |
| Education, Arts & Media | 2 (40.0%) | 3 (60.0%) |
| Legal Services & Support | 0 (0.0%) | 5 (100.0%) |
| Education Instruction & Library | 10 (23.3%) | 33 (76.7%) |
| Arts, Media & Entertainment | 10 (41.7%) | 14 (58.3%) |
| Health Diagnosing & Treating | 9 (22.0%) | 32 (78.0%) |
| Health Technologists | 9 (22.0%) | 32 (78.0%) |
| Total (Category) | 302 (51.4%) | 285 (48.5%) |
| Total (Overall) | 816 (54.6%) | 678 (45.4%) |
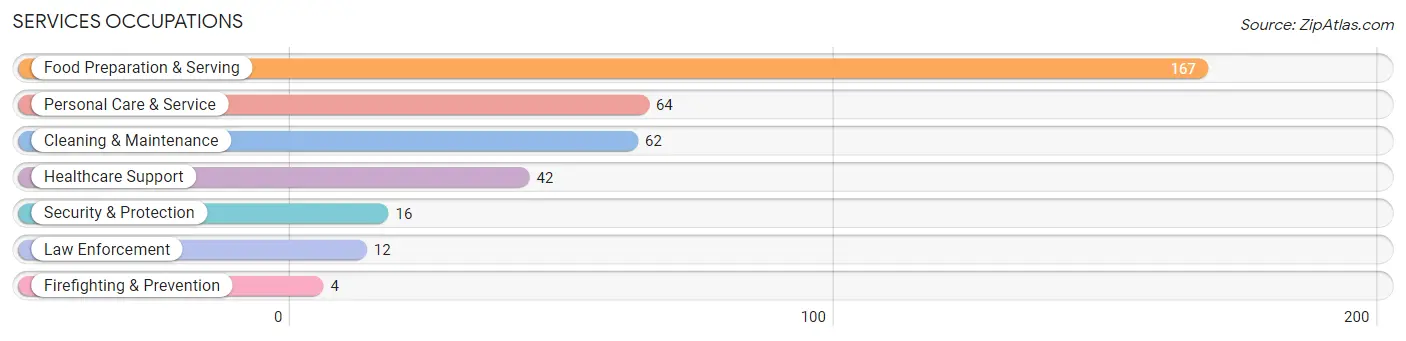
Services Occupations
The most common Services occupations in Hampton Beach are Food Preparation & Serving (167 | 11.2%), Personal Care & Service (64 | 4.3%), Cleaning & Maintenance (62 | 4.2%), Healthcare Support (42 | 2.8%), and Security & Protection (16 | 1.1%).
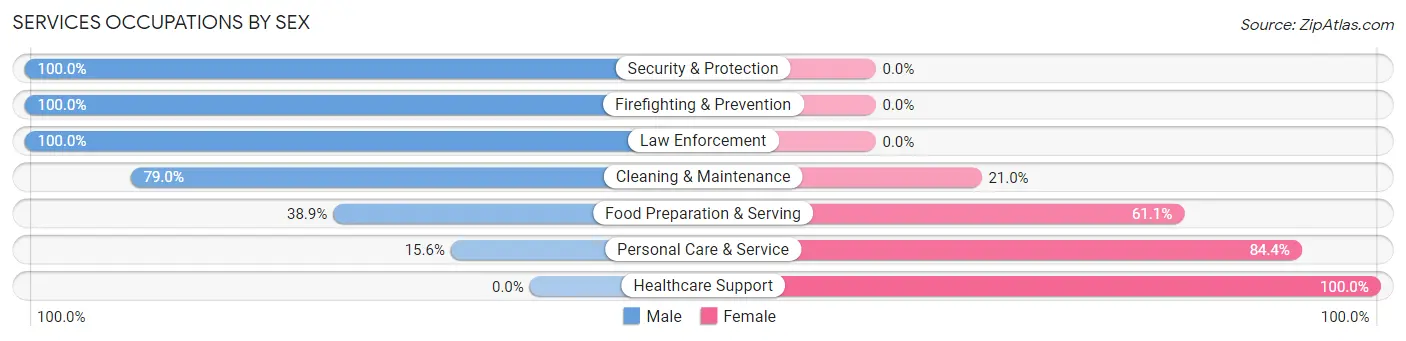
Services Occupations by Sex
Within the Services occupations in Hampton Beach, the most male-oriented occupations are Security & Protection (100.0%), Firefighting & Prevention (100.0%), and Law Enforcement (100.0%), while the most female-oriented occupations are Healthcare Support (100.0%), Personal Care & Service (84.4%), and Food Preparation & Serving (61.1%).
| Occupation | Male | Female |
| Healthcare Support | 0 (0.0%) | 42 (100.0%) |
| Security & Protection | 16 (100.0%) | 0 (0.0%) |
| Firefighting & Prevention | 4 (100.0%) | 0 (0.0%) |
| Law Enforcement | 12 (100.0%) | 0 (0.0%) |
| Food Preparation & Serving | 65 (38.9%) | 102 (61.1%) |
| Cleaning & Maintenance | 49 (79.0%) | 13 (21.0%) |
| Personal Care & Service | 10 (15.6%) | 54 (84.4%) |
| Total (Category) | 140 (39.9%) | 211 (60.1%) |
| Total (Overall) | 816 (54.6%) | 678 (45.4%) |
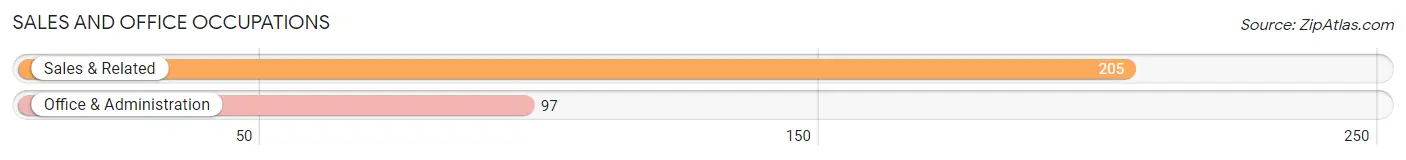
Sales and Office Occupations
The most common Sales and Office occupations in Hampton Beach are Sales & Related (205 | 13.7%), and Office & Administration (97 | 6.5%).
Sales and Office Occupations by Sex
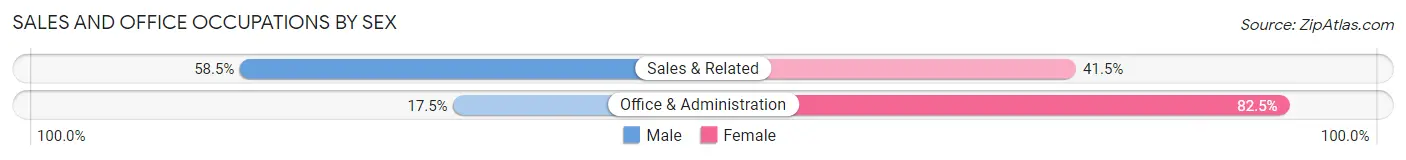
| Occupation | Male | Female |
| Sales & Related | 120 (58.5%) | 85 (41.5%) |
| Office & Administration | 17 (17.5%) | 80 (82.5%) |
| Total (Category) | 137 (45.4%) | 165 (54.6%) |
| Total (Overall) | 816 (54.6%) | 678 (45.4%) |
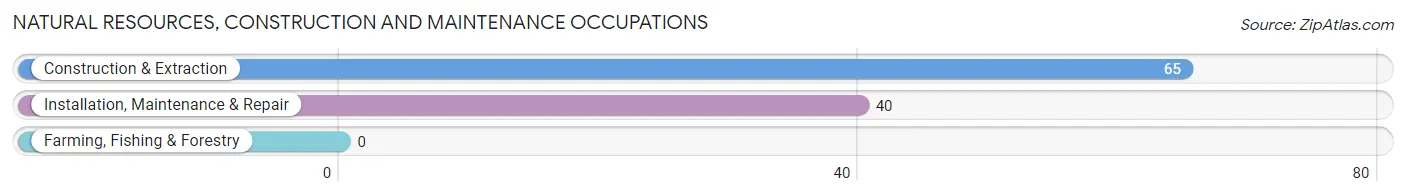
Natural Resources, Construction and Maintenance Occupations
The most common Natural Resources, Construction and Maintenance occupations in Hampton Beach are Construction & Extraction (65 | 4.3%), and Installation, Maintenance & Repair (40 | 2.7%).
Natural Resources, Construction and Maintenance Occupations by Sex
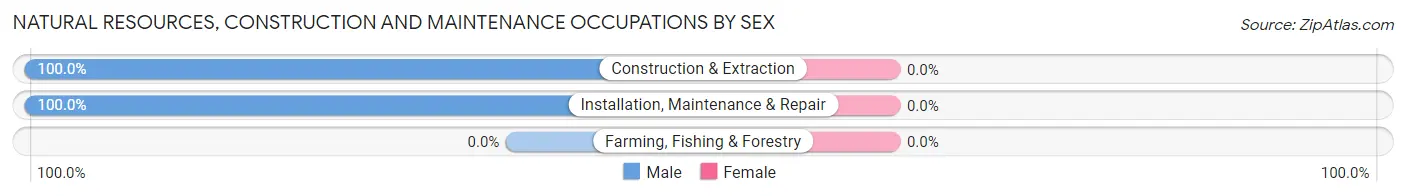
| Occupation | Male | Female |
| Farming, Fishing & Forestry | 0 (0.0%) | 0 (0.0%) |
| Construction & Extraction | 65 (100.0%) | 0 (0.0%) |
| Installation, Maintenance & Repair | 40 (100.0%) | 0 (0.0%) |
| Total (Category) | 105 (100.0%) | 0 (0.0%) |
| Total (Overall) | 816 (54.6%) | 678 (45.4%) |
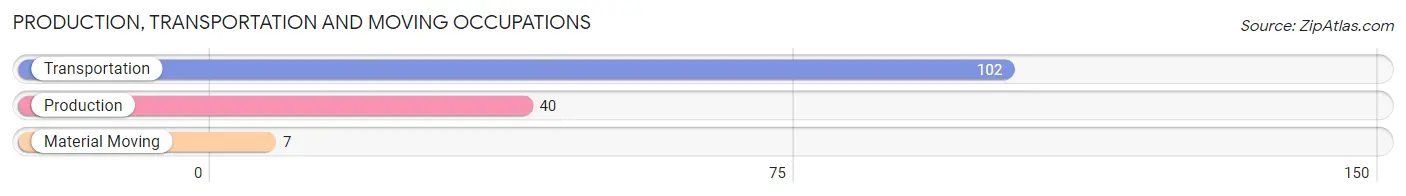
Production, Transportation and Moving Occupations
The most common Production, Transportation and Moving occupations in Hampton Beach are Transportation (102 | 6.8%), Production (40 | 2.7%), and Material Moving (7 | 0.5%).
Production, Transportation and Moving Occupations by Sex
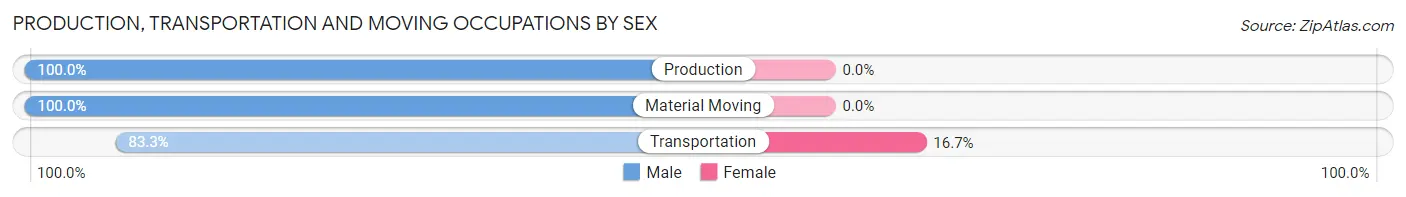
| Occupation | Male | Female |
| Production | 40 (100.0%) | 0 (0.0%) |
| Transportation | 85 (83.3%) | 17 (16.7%) |
| Material Moving | 7 (100.0%) | 0 (0.0%) |
| Total (Category) | 132 (88.6%) | 17 (11.4%) |
| Total (Overall) | 816 (54.6%) | 678 (45.4%) |
Employment Industries by Sex in Hampton Beach
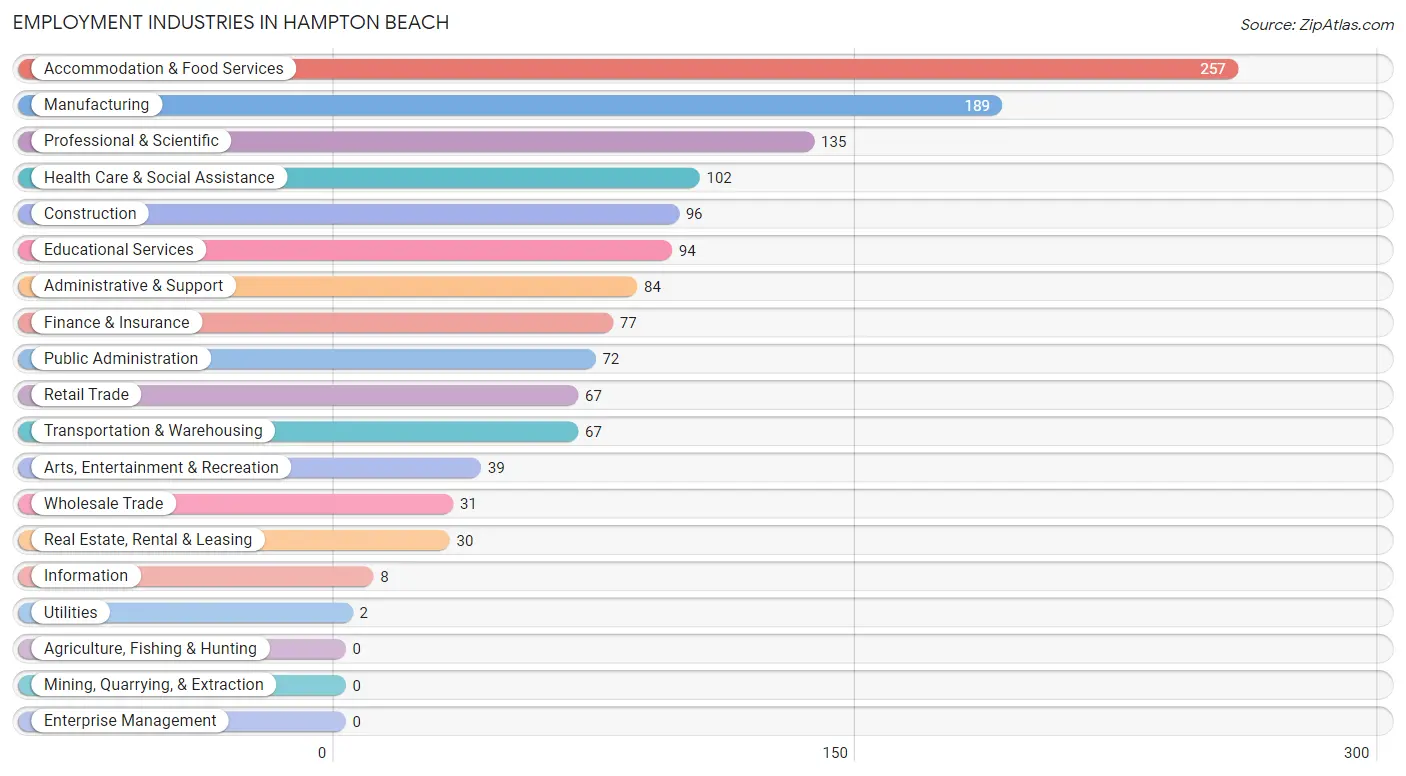
Employment Industries in Hampton Beach
The major employment industries in Hampton Beach include Accommodation & Food Services (257 | 17.2%), Manufacturing (189 | 12.7%), Professional & Scientific (135 | 9.0%), Health Care & Social Assistance (102 | 6.8%), and Construction (96 | 6.4%).
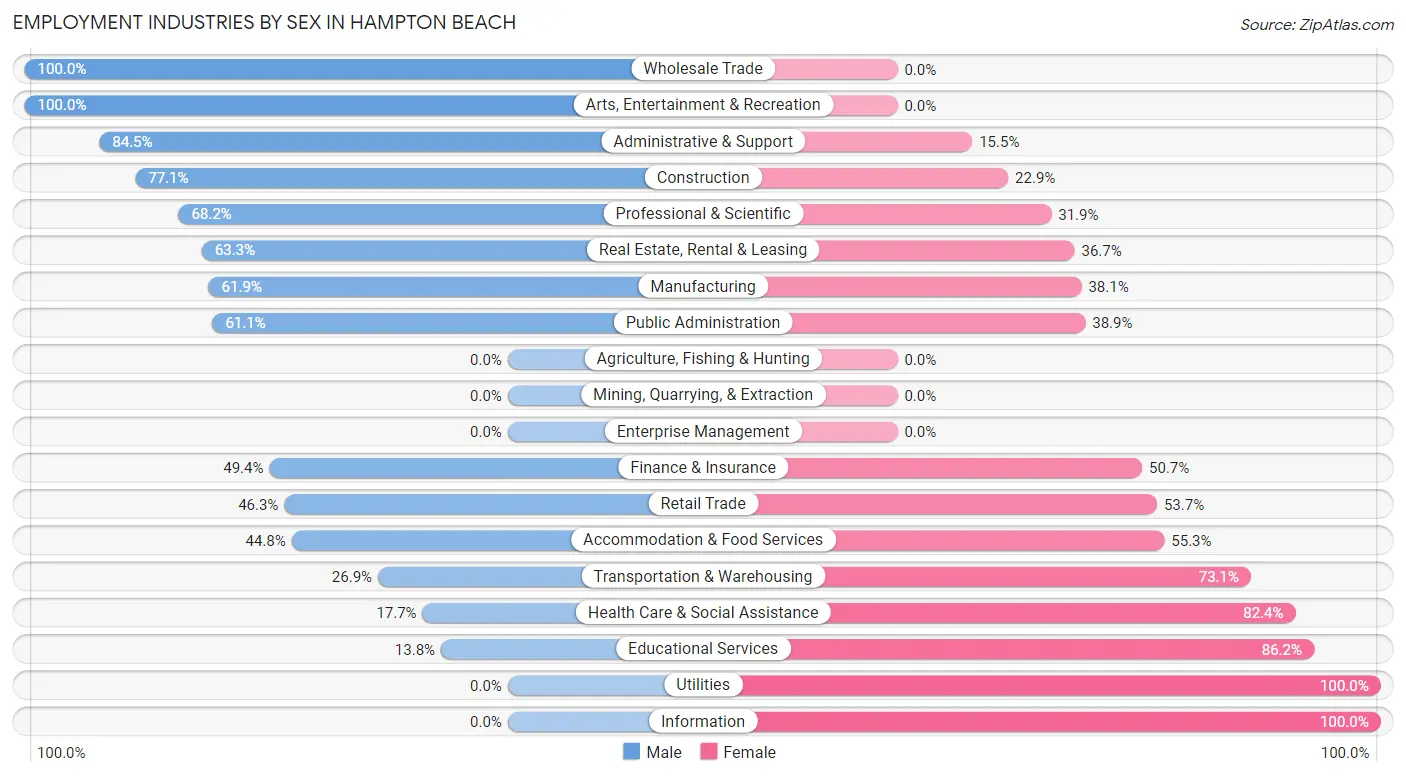
Employment Industries by Sex in Hampton Beach
The Hampton Beach industries that see more men than women are Wholesale Trade (100.0%), Arts, Entertainment & Recreation (100.0%), and Administrative & Support (84.5%), whereas the industries that tend to have a higher number of women are Utilities (100.0%), Information (100.0%), and Educational Services (86.2%).
| Industry | Male | Female |
| Agriculture, Fishing & Hunting | 0 (0.0%) | 0 (0.0%) |
| Mining, Quarrying, & Extraction | 0 (0.0%) | 0 (0.0%) |
| Construction | 74 (77.1%) | 22 (22.9%) |
| Manufacturing | 117 (61.9%) | 72 (38.1%) |
| Wholesale Trade | 31 (100.0%) | 0 (0.0%) |
| Retail Trade | 31 (46.3%) | 36 (53.7%) |
| Transportation & Warehousing | 18 (26.9%) | 49 (73.1%) |
| Utilities | 0 (0.0%) | 2 (100.0%) |
| Information | 0 (0.0%) | 8 (100.0%) |
| Finance & Insurance | 38 (49.3%) | 39 (50.6%) |
| Real Estate, Rental & Leasing | 19 (63.3%) | 11 (36.7%) |
| Professional & Scientific | 92 (68.1%) | 43 (31.9%) |
| Enterprise Management | 0 (0.0%) | 0 (0.0%) |
| Administrative & Support | 71 (84.5%) | 13 (15.5%) |
| Educational Services | 13 (13.8%) | 81 (86.2%) |
| Health Care & Social Assistance | 18 (17.6%) | 84 (82.4%) |
| Arts, Entertainment & Recreation | 39 (100.0%) | 0 (0.0%) |
| Accommodation & Food Services | 115 (44.8%) | 142 (55.2%) |
| Public Administration | 44 (61.1%) | 28 (38.9%) |
| Total | 816 (54.6%) | 678 (45.4%) |
Education in Hampton Beach
School Enrollment in Hampton Beach
The most common levels of schooling among the 298 students in Hampton Beach are high school (128 | 42.9%), elementary school (68 | 22.8%), and middle school (60 | 20.1%).
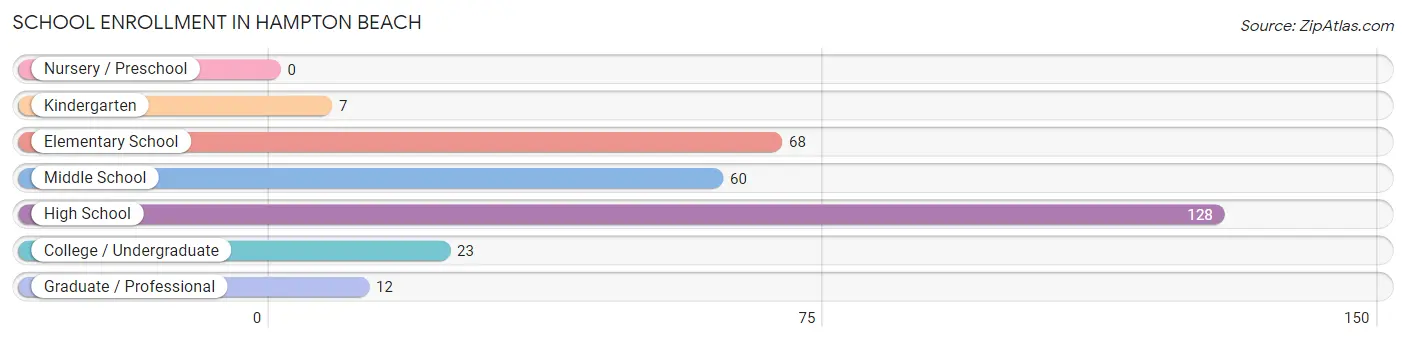
| School Level | # Students | % Students |
| Nursery / Preschool | 0 | 0.0% |
| Kindergarten | 7 | 2.4% |
| Elementary School | 68 | 22.8% |
| Middle School | 60 | 20.1% |
| High School | 128 | 42.9% |
| College / Undergraduate | 23 | 7.7% |
| Graduate / Professional | 12 | 4.0% |
| Total | 298 | 100.0% |
School Enrollment by Age by Funding Source in Hampton Beach
Out of a total of 298 students who are enrolled in schools in Hampton Beach, 17 (5.7%) attend a private institution, while the remaining 281 (94.3%) are enrolled in public schools. The age group of 35 years and over has the highest likelihood of being enrolled in private schools, with 11 (57.9% in the age bracket) enrolled. Conversely, the age group of 5 to 9 year old has the lowest likelihood of being enrolled in a private school, with 57 (100.0% in the age bracket) attending a public institution.
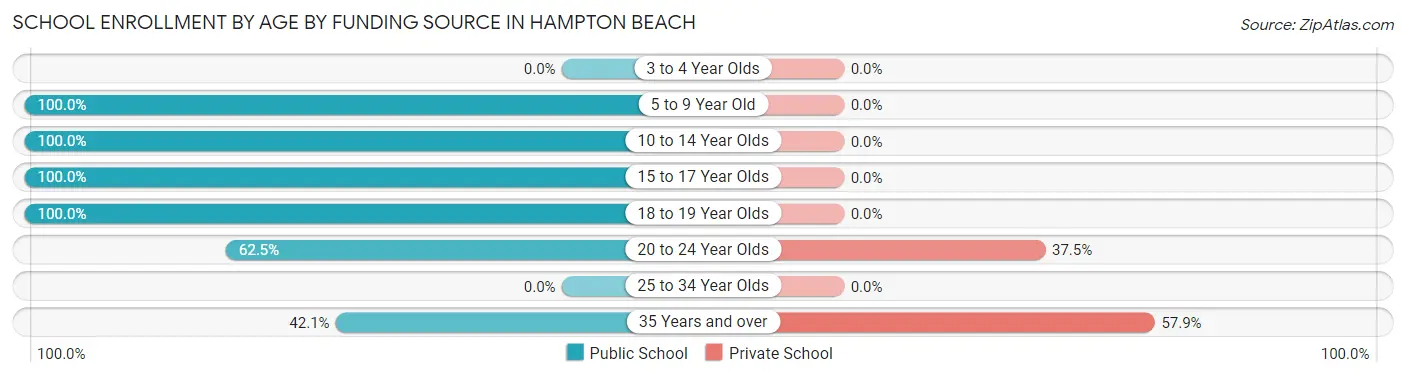
| Age Bracket | Public School | Private School |
| 3 to 4 Year Olds | 0 (0.0%) | 0 (0.0%) |
| 5 to 9 Year Old | 57 (100.0%) | 0 (0.0%) |
| 10 to 14 Year Olds | 102 (100.0%) | 0 (0.0%) |
| 15 to 17 Year Olds | 67 (100.0%) | 0 (0.0%) |
| 18 to 19 Year Olds | 37 (100.0%) | 0 (0.0%) |
| 20 to 24 Year Olds | 10 (62.5%) | 6 (37.5%) |
| 25 to 34 Year Olds | 0 (0.0%) | 0 (0.0%) |
| 35 Years and over | 8 (42.1%) | 11 (57.9%) |
| Total | 281 (94.3%) | 17 (5.7%) |
Educational Attainment by Field of Study in Hampton Beach
Business (215 | 24.1%), education (159 | 17.8%), science & technology (114 | 12.8%), arts & humanities (91 | 10.2%), and social sciences (80 | 9.0%) are the most common fields of study among 891 individuals in Hampton Beach who have obtained a bachelor's degree or higher.
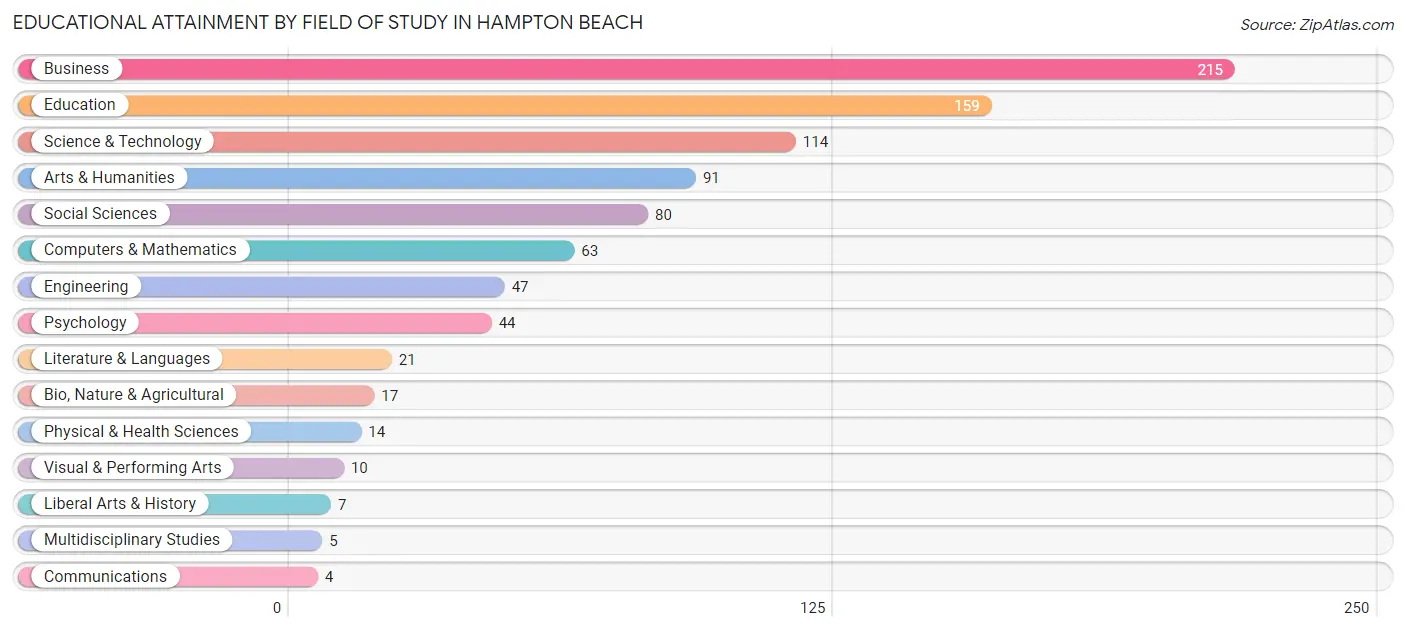
| Field of Study | # Graduates | % Graduates |
| Computers & Mathematics | 63 | 7.1% |
| Bio, Nature & Agricultural | 17 | 1.9% |
| Physical & Health Sciences | 14 | 1.6% |
| Psychology | 44 | 4.9% |
| Social Sciences | 80 | 9.0% |
| Engineering | 47 | 5.3% |
| Multidisciplinary Studies | 5 | 0.6% |
| Science & Technology | 114 | 12.8% |
| Business | 215 | 24.1% |
| Education | 159 | 17.8% |
| Literature & Languages | 21 | 2.4% |
| Liberal Arts & History | 7 | 0.8% |
| Visual & Performing Arts | 10 | 1.1% |
| Communications | 4 | 0.4% |
| Arts & Humanities | 91 | 10.2% |
| Total | 891 | 100.0% |
Transportation & Commute in Hampton Beach
Vehicle Availability by Sex in Hampton Beach
The most prevalent vehicle ownership categories in Hampton Beach are males with 2 vehicles (493, accounting for 62.3%) and females with 2 vehicles (248, making up 75.1%).
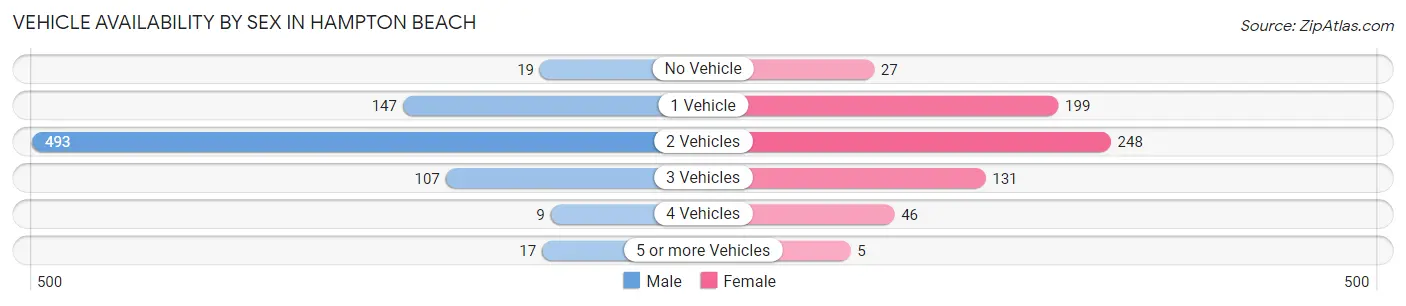
| Vehicles Available | Male | Female |
| No Vehicle | 19 (2.4%) | 27 (4.1%) |
| 1 Vehicle | 147 (18.6%) | 199 (30.3%) |
| 2 Vehicles | 493 (62.3%) | 248 (37.8%) |
| 3 Vehicles | 107 (13.5%) | 131 (20.0%) |
| 4 Vehicles | 9 (1.1%) | 46 (7.0%) |
| 5 or more Vehicles | 17 (2.1%) | 5 (0.8%) |
| Total | 792 (100.0%) | 656 (100.0%) |
Commute Time in Hampton Beach
The most frequently occuring commute durations in Hampton Beach are 20 to 24 minutes (237 commuters, 18.9%), 5 to 9 minutes (152 commuters, 12.1%), and 60 to 89 minutes (136 commuters, 10.8%).
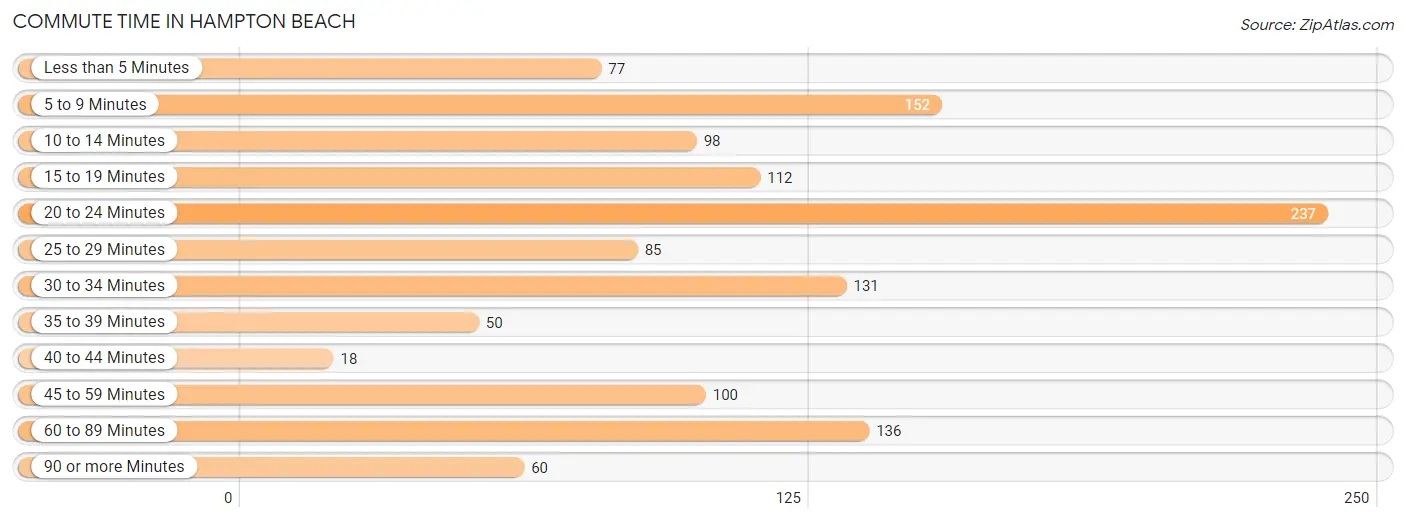
| Commute Time | # Commuters | % Commuters |
| Less than 5 Minutes | 77 | 6.1% |
| 5 to 9 Minutes | 152 | 12.1% |
| 10 to 14 Minutes | 98 | 7.8% |
| 15 to 19 Minutes | 112 | 8.9% |
| 20 to 24 Minutes | 237 | 18.9% |
| 25 to 29 Minutes | 85 | 6.8% |
| 30 to 34 Minutes | 131 | 10.4% |
| 35 to 39 Minutes | 50 | 4.0% |
| 40 to 44 Minutes | 18 | 1.4% |
| 45 to 59 Minutes | 100 | 8.0% |
| 60 to 89 Minutes | 136 | 10.8% |
| 90 or more Minutes | 60 | 4.8% |
Commute Time by Sex in Hampton Beach
The most common commute times in Hampton Beach are 20 to 24 minutes (147 commuters, 22.4%) for males and 20 to 24 minutes (90 commuters, 15.0%) for females.
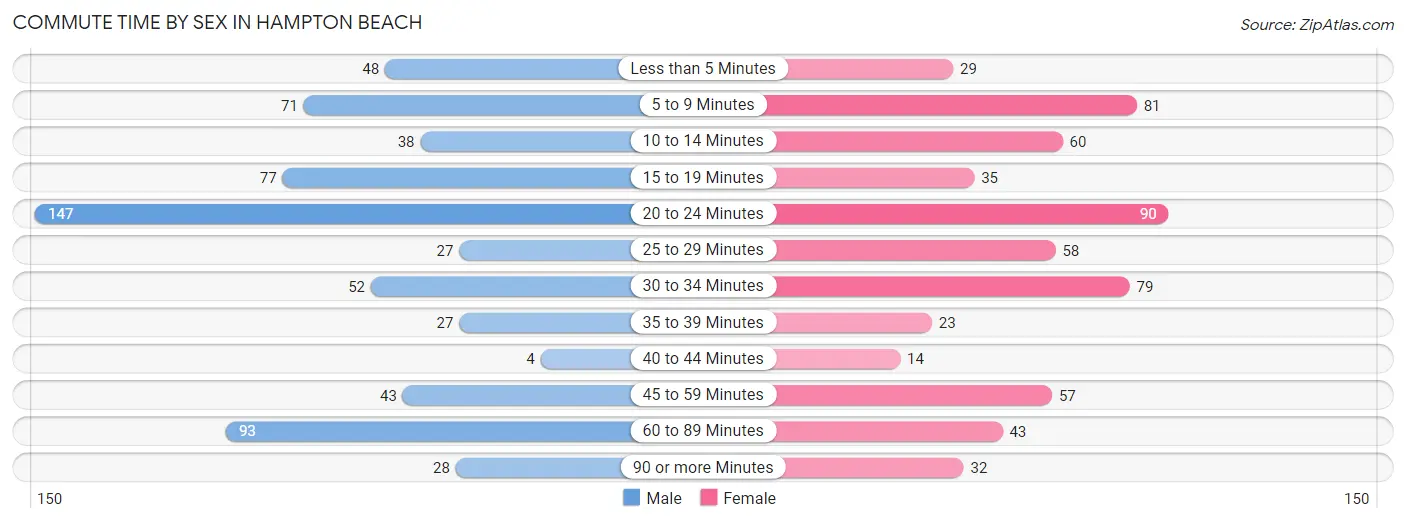
| Commute Time | Male | Female |
| Less than 5 Minutes | 48 (7.3%) | 29 (4.8%) |
| 5 to 9 Minutes | 71 (10.8%) | 81 (13.5%) |
| 10 to 14 Minutes | 38 (5.8%) | 60 (10.0%) |
| 15 to 19 Minutes | 77 (11.8%) | 35 (5.8%) |
| 20 to 24 Minutes | 147 (22.4%) | 90 (15.0%) |
| 25 to 29 Minutes | 27 (4.1%) | 58 (9.7%) |
| 30 to 34 Minutes | 52 (7.9%) | 79 (13.1%) |
| 35 to 39 Minutes | 27 (4.1%) | 23 (3.8%) |
| 40 to 44 Minutes | 4 (0.6%) | 14 (2.3%) |
| 45 to 59 Minutes | 43 (6.6%) | 57 (9.5%) |
| 60 to 89 Minutes | 93 (14.2%) | 43 (7.1%) |
| 90 or more Minutes | 28 (4.3%) | 32 (5.3%) |
Time of Departure to Work by Sex in Hampton Beach
The most frequent times of departure to work in Hampton Beach are 8:00 AM to 8:29 AM (98, 15.0%) for males and 7:30 AM to 7:59 AM (104, 17.3%) for females.
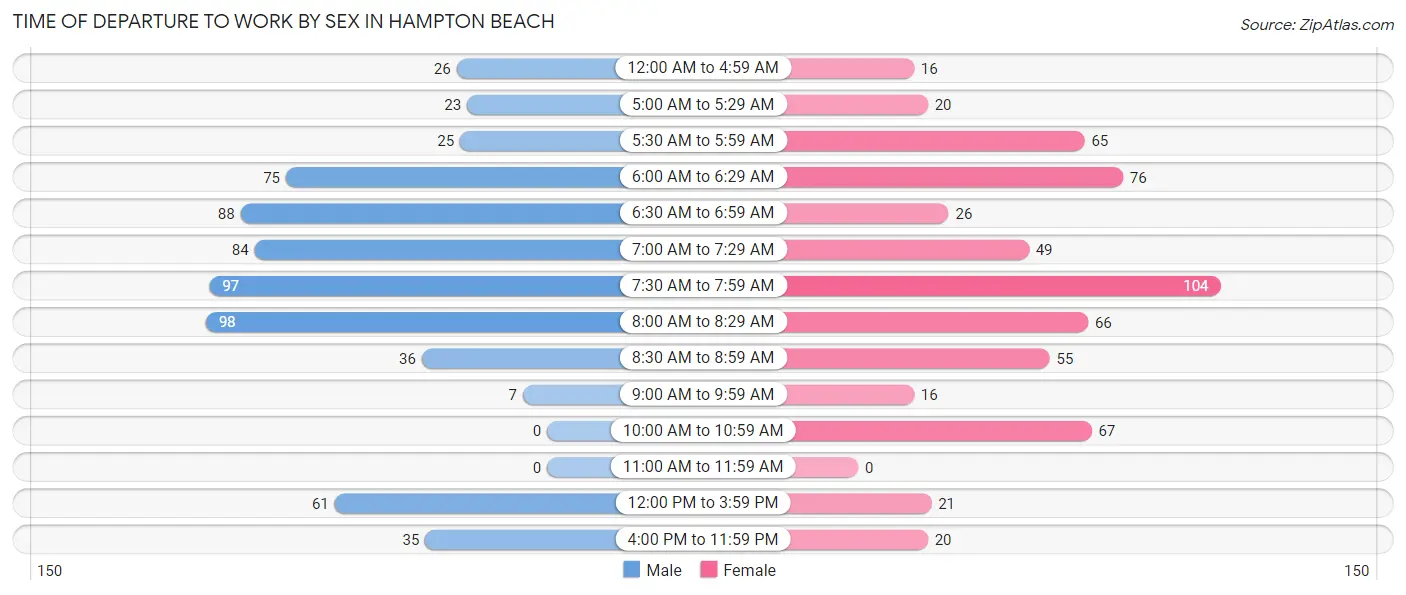
| Time of Departure | Male | Female |
| 12:00 AM to 4:59 AM | 26 (4.0%) | 16 (2.7%) |
| 5:00 AM to 5:29 AM | 23 (3.5%) | 20 (3.3%) |
| 5:30 AM to 5:59 AM | 25 (3.8%) | 65 (10.8%) |
| 6:00 AM to 6:29 AM | 75 (11.5%) | 76 (12.7%) |
| 6:30 AM to 6:59 AM | 88 (13.4%) | 26 (4.3%) |
| 7:00 AM to 7:29 AM | 84 (12.8%) | 49 (8.2%) |
| 7:30 AM to 7:59 AM | 97 (14.8%) | 104 (17.3%) |
| 8:00 AM to 8:29 AM | 98 (15.0%) | 66 (11.0%) |
| 8:30 AM to 8:59 AM | 36 (5.5%) | 55 (9.1%) |
| 9:00 AM to 9:59 AM | 7 (1.1%) | 16 (2.7%) |
| 10:00 AM to 10:59 AM | 0 (0.0%) | 67 (11.2%) |
| 11:00 AM to 11:59 AM | 0 (0.0%) | 0 (0.0%) |
| 12:00 PM to 3:59 PM | 61 (9.3%) | 21 (3.5%) |
| 4:00 PM to 11:59 PM | 35 (5.3%) | 20 (3.3%) |
| Total | 655 (100.0%) | 601 (100.0%) |
Housing Occupancy in Hampton Beach
Occupancy by Ownership in Hampton Beach
Of the total 1,334 dwellings in Hampton Beach, owner-occupied units account for 854 (64.0%), while renter-occupied units make up 480 (36.0%).
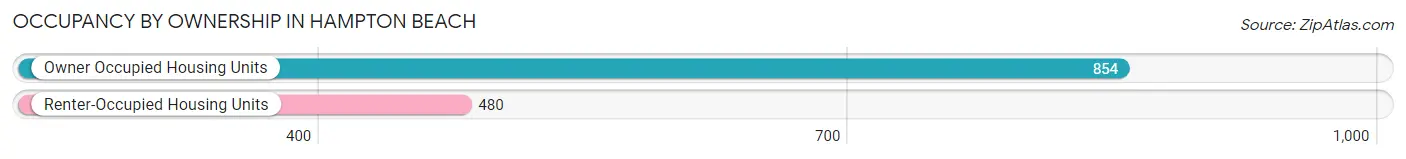
| Occupancy | # Housing Units | % Housing Units |
| Owner Occupied Housing Units | 854 | 64.0% |
| Renter-Occupied Housing Units | 480 | 36.0% |
| Total Occupied Housing Units | 1,334 | 100.0% |
Occupancy by Household Size in Hampton Beach
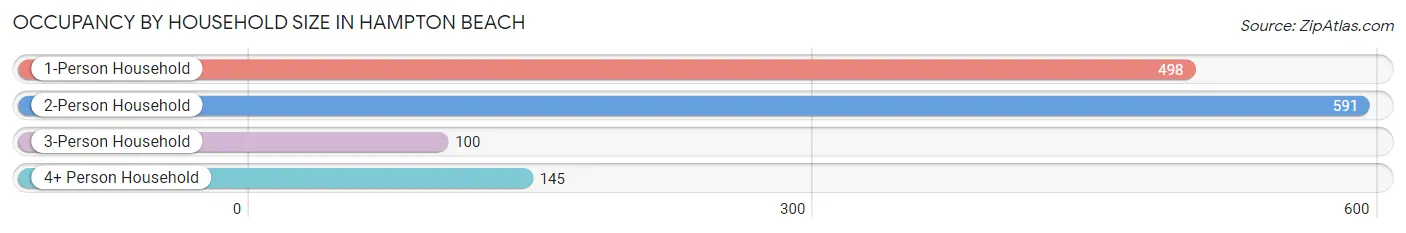
| Household Size | # Housing Units | % Housing Units |
| 1-Person Household | 498 | 37.3% |
| 2-Person Household | 591 | 44.3% |
| 3-Person Household | 100 | 7.5% |
| 4+ Person Household | 145 | 10.9% |
| Total Housing Units | 1,334 | 100.0% |
Occupancy by Ownership by Household Size in Hampton Beach
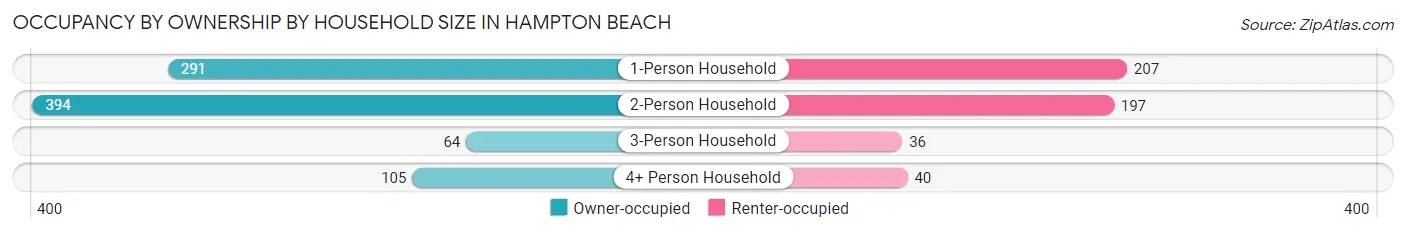
| Household Size | Owner-occupied | Renter-occupied |
| 1-Person Household | 291 (58.4%) | 207 (41.6%) |
| 2-Person Household | 394 (66.7%) | 197 (33.3%) |
| 3-Person Household | 64 (64.0%) | 36 (36.0%) |
| 4+ Person Household | 105 (72.4%) | 40 (27.6%) |
| Total Housing Units | 854 (64.0%) | 480 (36.0%) |
Occupancy by Educational Attainment in Hampton Beach
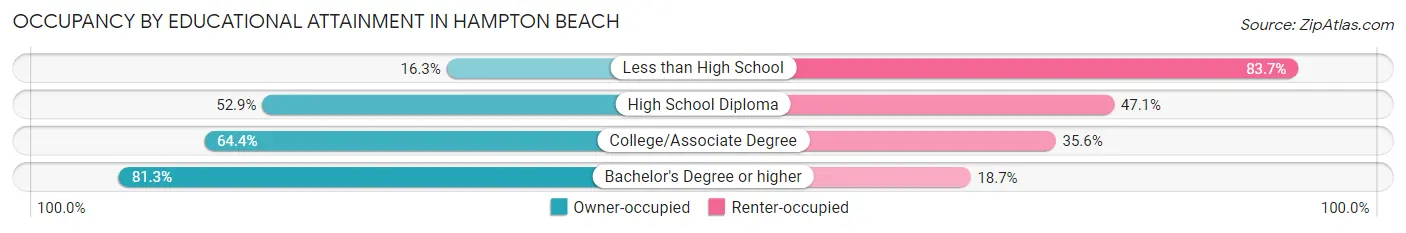
| Household Size | Owner-occupied | Renter-occupied |
| Less than High School | 8 (16.3%) | 41 (83.7%) |
| High School Diploma | 248 (52.9%) | 221 (47.1%) |
| College/Associate Degree | 250 (64.4%) | 138 (35.6%) |
| Bachelor's Degree or higher | 348 (81.3%) | 80 (18.7%) |
Occupancy by Age of Householder in Hampton Beach
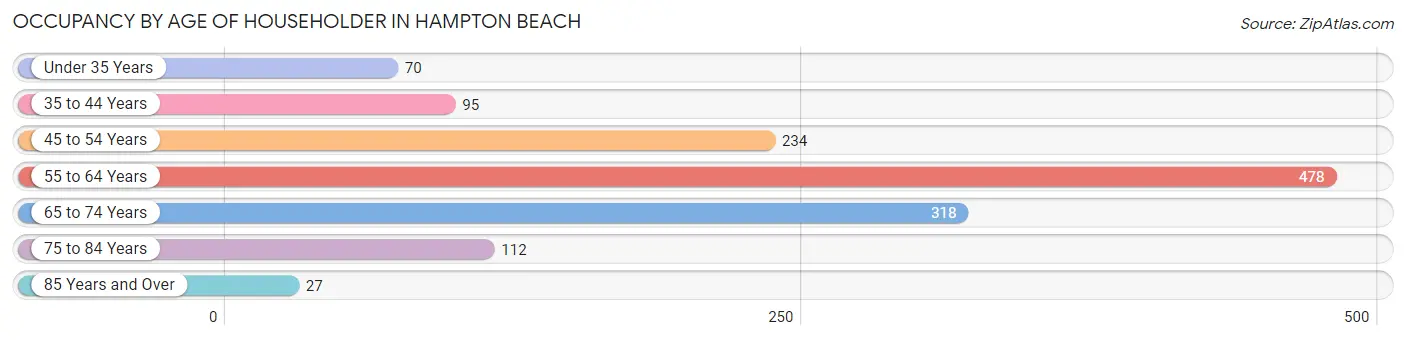
| Age Bracket | # Households | % Households |
| Under 35 Years | 70 | 5.2% |
| 35 to 44 Years | 95 | 7.1% |
| 45 to 54 Years | 234 | 17.5% |
| 55 to 64 Years | 478 | 35.8% |
| 65 to 74 Years | 318 | 23.8% |
| 75 to 84 Years | 112 | 8.4% |
| 85 Years and Over | 27 | 2.0% |
| Total | 1,334 | 100.0% |
Housing Finances in Hampton Beach
Median Income by Occupancy in Hampton Beach
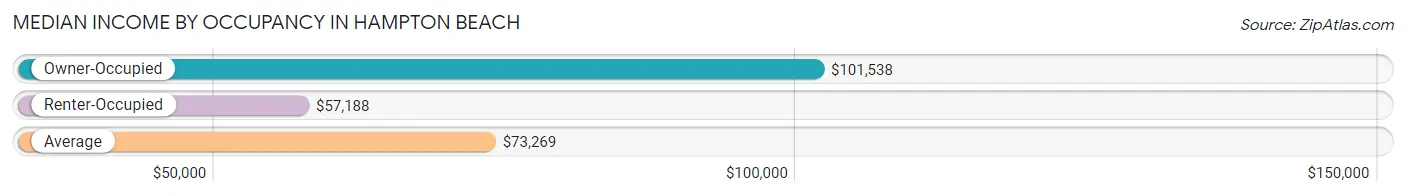
| Occupancy Type | # Households | Median Income |
| Owner-Occupied | 854 (64.0%) | $101,538 |
| Renter-Occupied | 480 (36.0%) | $57,188 |
| Average | 1,334 (100.0%) | $73,269 |
Occupancy by Householder Income Bracket in Hampton Beach
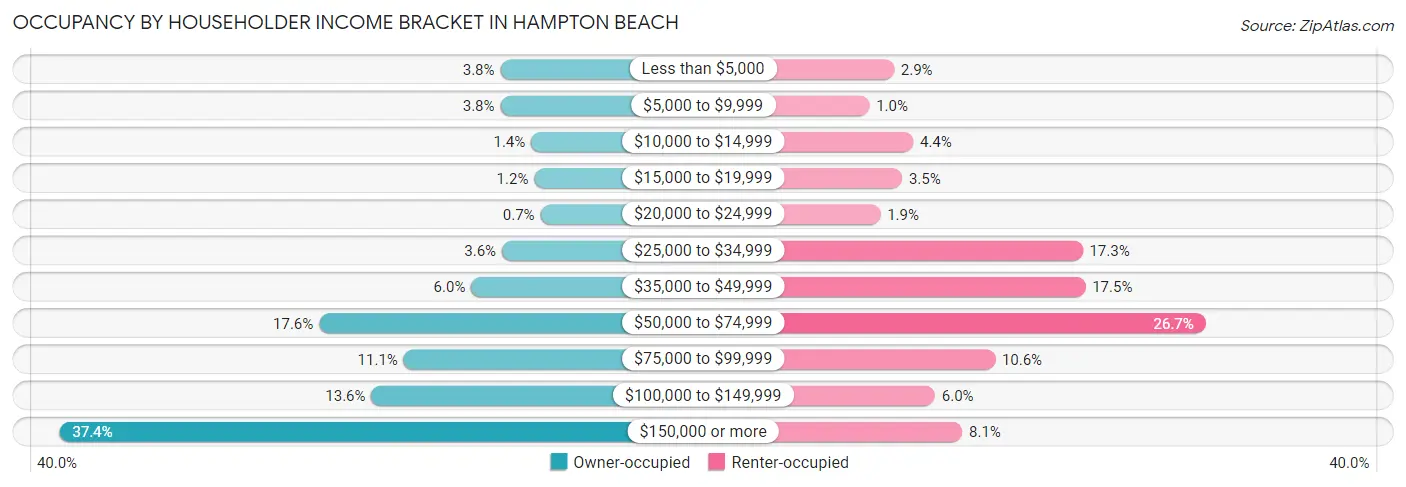
| Income Bracket | Owner-occupied | Renter-occupied |
| Less than $5,000 | 32 (3.7%) | 14 (2.9%) |
| $5,000 to $9,999 | 32 (3.7%) | 5 (1.0%) |
| $10,000 to $14,999 | 12 (1.4%) | 21 (4.4%) |
| $15,000 to $19,999 | 10 (1.2%) | 17 (3.5%) |
| $20,000 to $24,999 | 6 (0.7%) | 9 (1.9%) |
| $25,000 to $34,999 | 31 (3.6%) | 83 (17.3%) |
| $35,000 to $49,999 | 51 (6.0%) | 84 (17.5%) |
| $50,000 to $74,999 | 150 (17.6%) | 128 (26.7%) |
| $75,000 to $99,999 | 95 (11.1%) | 51 (10.6%) |
| $100,000 to $149,999 | 116 (13.6%) | 29 (6.0%) |
| $150,000 or more | 319 (37.3%) | 39 (8.1%) |
| Total | 854 (100.0%) | 480 (100.0%) |
Monthly Housing Cost Tiers in Hampton Beach
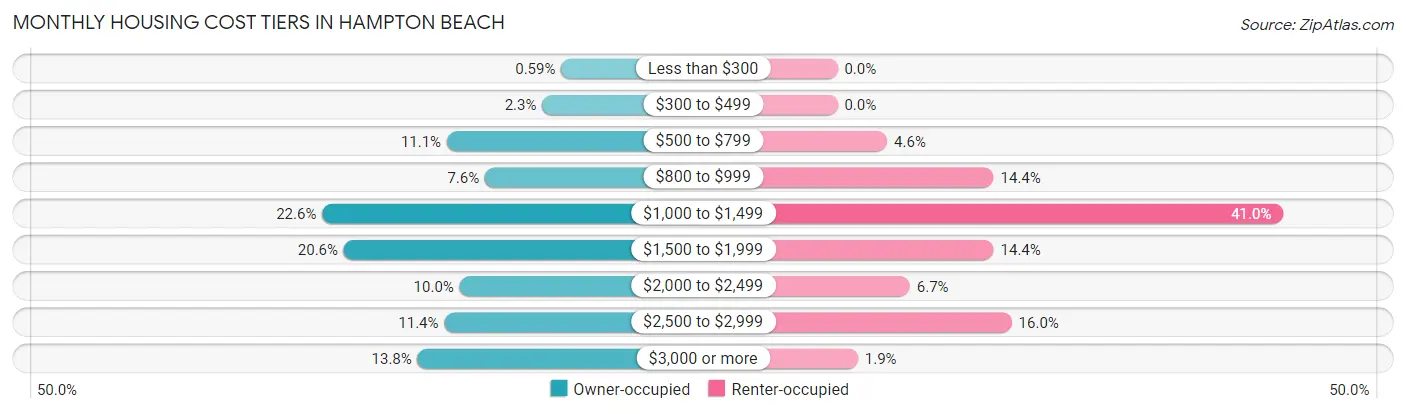
| Monthly Cost | Owner-occupied | Renter-occupied |
| Less than $300 | 5 (0.6%) | 0 (0.0%) |
| $300 to $499 | 20 (2.3%) | 0 (0.0%) |
| $500 to $799 | 95 (11.1%) | 22 (4.6%) |
| $800 to $999 | 65 (7.6%) | 69 (14.4%) |
| $1,000 to $1,499 | 193 (22.6%) | 197 (41.0%) |
| $1,500 to $1,999 | 176 (20.6%) | 69 (14.4%) |
| $2,000 to $2,499 | 85 (10.0%) | 32 (6.7%) |
| $2,500 to $2,999 | 97 (11.4%) | 77 (16.0%) |
| $3,000 or more | 118 (13.8%) | 9 (1.9%) |
| Total | 854 (100.0%) | 480 (100.0%) |
Physical Housing Characteristics in Hampton Beach
Housing Structures in Hampton Beach
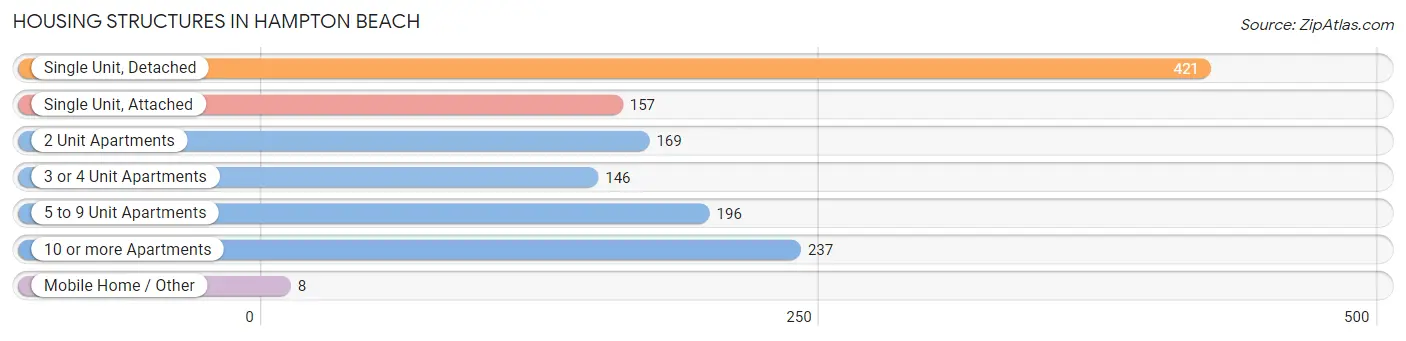
| Structure Type | # Housing Units | % Housing Units |
| Single Unit, Detached | 421 | 31.6% |
| Single Unit, Attached | 157 | 11.8% |
| 2 Unit Apartments | 169 | 12.7% |
| 3 or 4 Unit Apartments | 146 | 10.9% |
| 5 to 9 Unit Apartments | 196 | 14.7% |
| 10 or more Apartments | 237 | 17.8% |
| Mobile Home / Other | 8 | 0.6% |
| Total | 1,334 | 100.0% |
Housing Structures by Occupancy in Hampton Beach
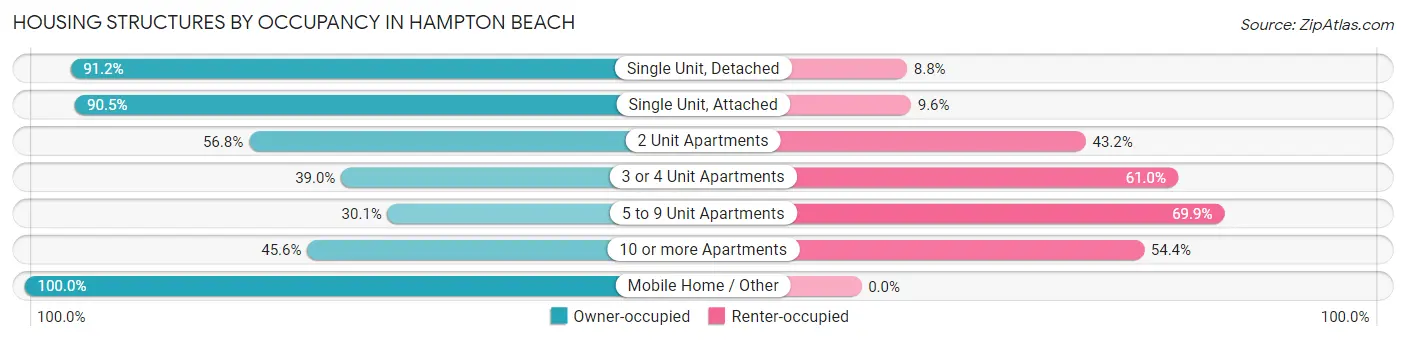
| Structure Type | Owner-occupied | Renter-occupied |
| Single Unit, Detached | 384 (91.2%) | 37 (8.8%) |
| Single Unit, Attached | 142 (90.4%) | 15 (9.6%) |
| 2 Unit Apartments | 96 (56.8%) | 73 (43.2%) |
| 3 or 4 Unit Apartments | 57 (39.0%) | 89 (61.0%) |
| 5 to 9 Unit Apartments | 59 (30.1%) | 137 (69.9%) |
| 10 or more Apartments | 108 (45.6%) | 129 (54.4%) |
| Mobile Home / Other | 8 (100.0%) | 0 (0.0%) |
| Total | 854 (64.0%) | 480 (36.0%) |
Housing Structures by Number of Rooms in Hampton Beach
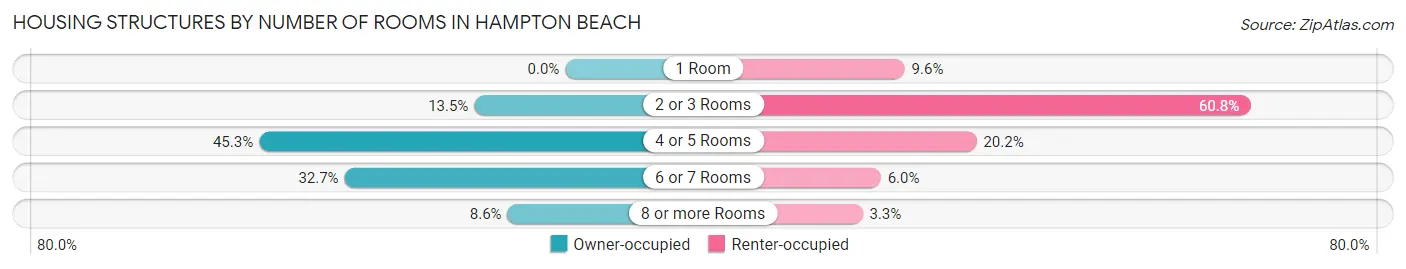
| Number of Rooms | Owner-occupied | Renter-occupied |
| 1 Room | 0 (0.0%) | 46 (9.6%) |
| 2 or 3 Rooms | 115 (13.5%) | 292 (60.8%) |
| 4 or 5 Rooms | 387 (45.3%) | 97 (20.2%) |
| 6 or 7 Rooms | 279 (32.7%) | 29 (6.0%) |
| 8 or more Rooms | 73 (8.6%) | 16 (3.3%) |
| Total | 854 (100.0%) | 480 (100.0%) |
Housing Structure by Heating Type in Hampton Beach
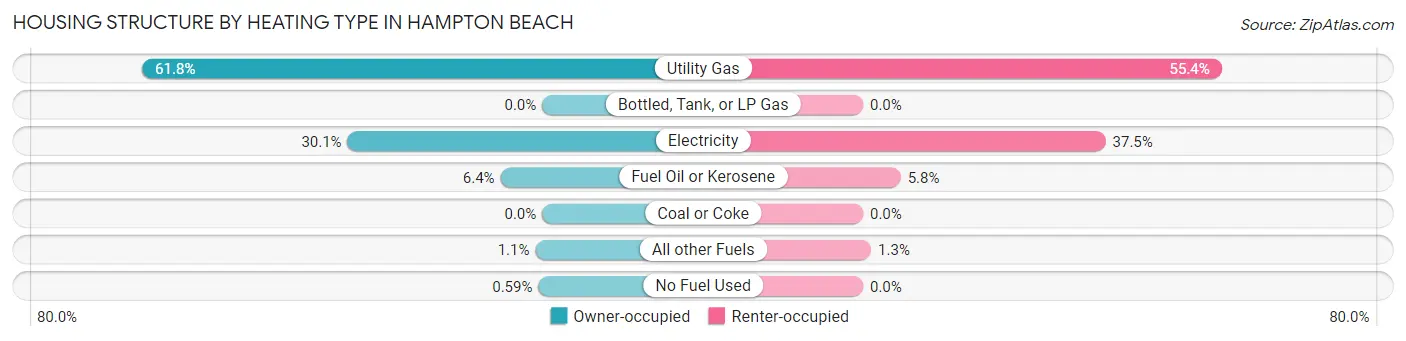
| Heating Type | Owner-occupied | Renter-occupied |
| Utility Gas | 528 (61.8%) | 266 (55.4%) |
| Bottled, Tank, or LP Gas | 0 (0.0%) | 0 (0.0%) |
| Electricity | 257 (30.1%) | 180 (37.5%) |
| Fuel Oil or Kerosene | 55 (6.4%) | 28 (5.8%) |
| Coal or Coke | 0 (0.0%) | 0 (0.0%) |
| All other Fuels | 9 (1.1%) | 6 (1.3%) |
| No Fuel Used | 5 (0.6%) | 0 (0.0%) |
| Total | 854 (100.0%) | 480 (100.0%) |
Household Vehicle Usage in Hampton Beach
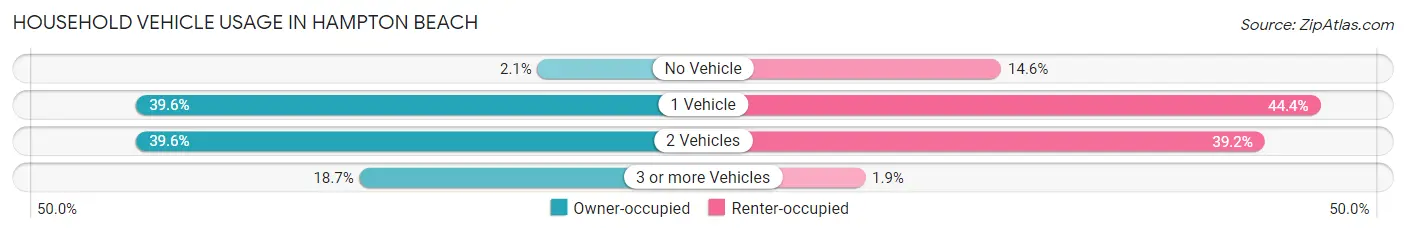
| Vehicles per Household | Owner-occupied | Renter-occupied |
| No Vehicle | 18 (2.1%) | 70 (14.6%) |
| 1 Vehicle | 338 (39.6%) | 213 (44.4%) |
| 2 Vehicles | 338 (39.6%) | 188 (39.2%) |
| 3 or more Vehicles | 160 (18.7%) | 9 (1.9%) |
| Total | 854 (100.0%) | 480 (100.0%) |
Real Estate & Mortgages in Hampton Beach
Real Estate and Mortgage Overview in Hampton Beach
| Characteristic | Without Mortgage | With Mortgage |
| Housing Units | 405 | 449 |
| Median Property Value | $426,100 | $442,100 |
| Median Household Income | $63,438 | $260 |
| Monthly Housing Costs | $1,048 | $101 |
| Real Estate Taxes | $5,982 | $0 |
Property Value by Mortgage Status in Hampton Beach
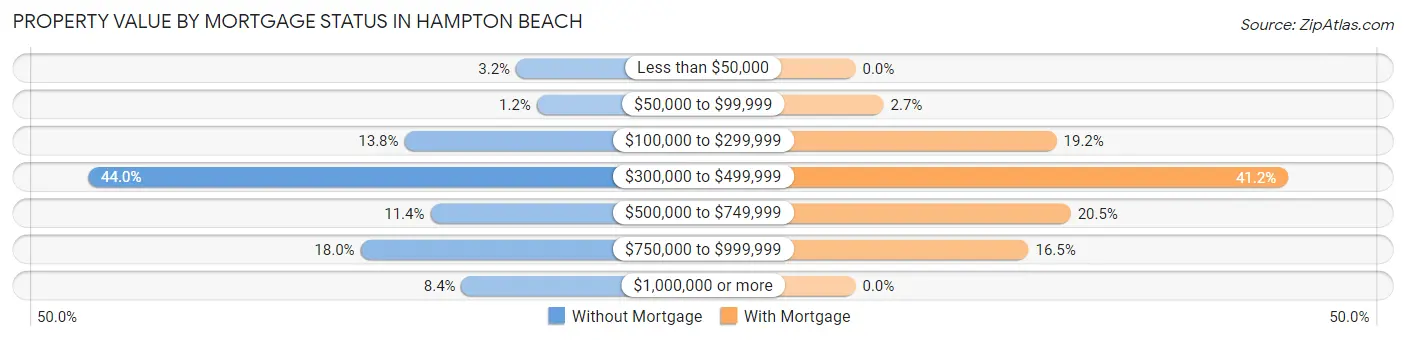
| Property Value | Without Mortgage | With Mortgage |
| Less than $50,000 | 13 (3.2%) | 0 (0.0%) |
| $50,000 to $99,999 | 5 (1.2%) | 12 (2.7%) |
| $100,000 to $299,999 | 56 (13.8%) | 86 (19.2%) |
| $300,000 to $499,999 | 178 (44.0%) | 185 (41.2%) |
| $500,000 to $749,999 | 46 (11.4%) | 92 (20.5%) |
| $750,000 to $999,999 | 73 (18.0%) | 74 (16.5%) |
| $1,000,000 or more | 34 (8.4%) | 0 (0.0%) |
| Total | 405 (100.0%) | 449 (100.0%) |
Household Income by Mortgage Status in Hampton Beach
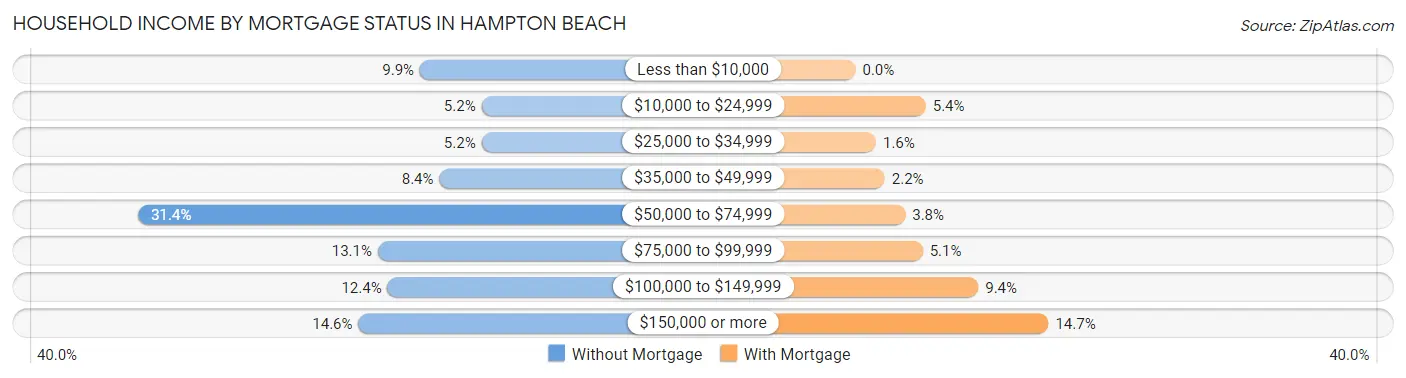
| Household Income | Without Mortgage | With Mortgage |
| Less than $10,000 | 40 (9.9%) | 0 (0.0%) |
| $10,000 to $24,999 | 21 (5.2%) | 24 (5.3%) |
| $25,000 to $34,999 | 21 (5.2%) | 7 (1.6%) |
| $35,000 to $49,999 | 34 (8.4%) | 10 (2.2%) |
| $50,000 to $74,999 | 127 (31.4%) | 17 (3.8%) |
| $75,000 to $99,999 | 53 (13.1%) | 23 (5.1%) |
| $100,000 to $149,999 | 50 (12.3%) | 42 (9.3%) |
| $150,000 or more | 59 (14.6%) | 66 (14.7%) |
| Total | 405 (100.0%) | 449 (100.0%) |
Property Value to Household Income Ratio in Hampton Beach
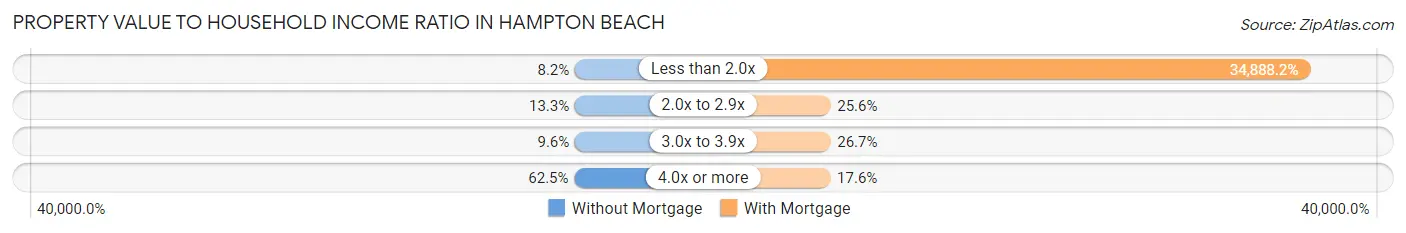
| Value-to-Income Ratio | Without Mortgage | With Mortgage |
| Less than 2.0x | 33 (8.2%) | 156,648 (34,888.2%) |
| 2.0x to 2.9x | 54 (13.3%) | 115 (25.6%) |
| 3.0x to 3.9x | 39 (9.6%) | 120 (26.7%) |
| 4.0x or more | 253 (62.5%) | 79 (17.6%) |
| Total | 405 (100.0%) | 449 (100.0%) |
Real Estate Taxes by Mortgage Status in Hampton Beach
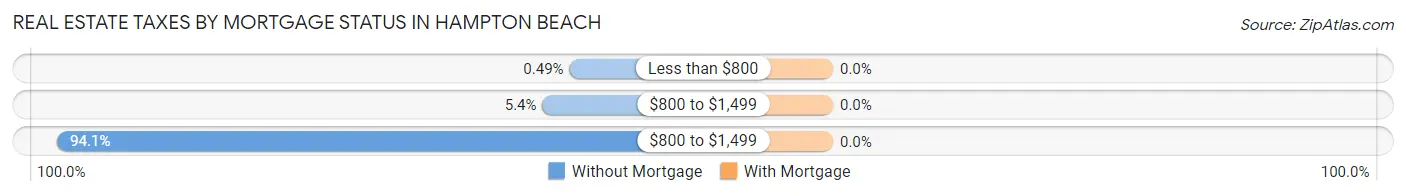
| Property Taxes | Without Mortgage | With Mortgage |
| Less than $800 | 2 (0.5%) | 0 (0.0%) |
| $800 to $1,499 | 22 (5.4%) | 0 (0.0%) |
| $800 to $1,499 | 381 (94.1%) | 0 (0.0%) |
| Total | 405 (100.0%) | 449 (100.0%) |
Health & Disability in Hampton Beach
Health Insurance Coverage by Age in Hampton Beach
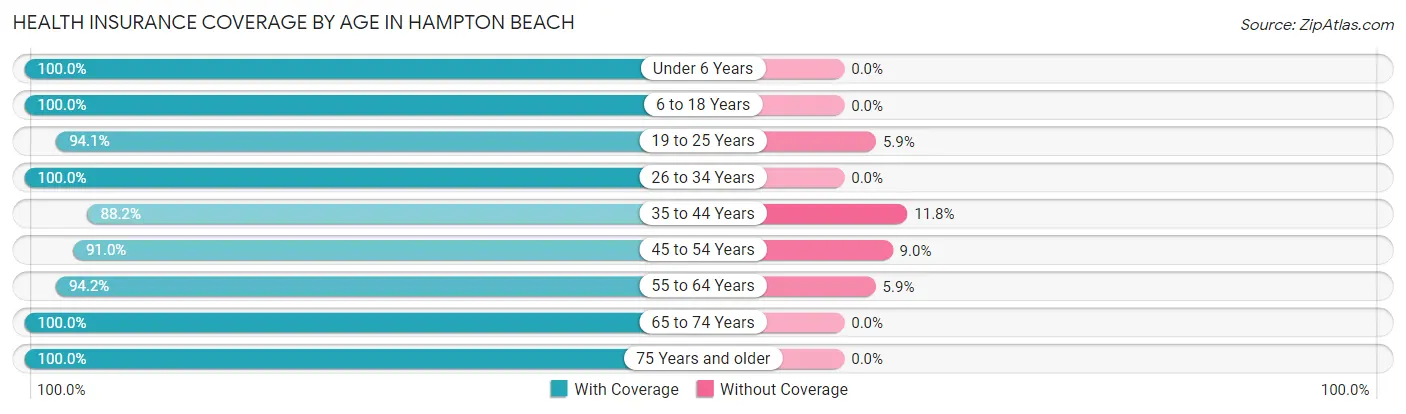
| Age Bracket | With Coverage | Without Coverage |
| Under 6 Years | 6 (100.0%) | 0 (0.0%) |
| 6 to 18 Years | 297 (100.0%) | 0 (0.0%) |
| 19 to 25 Years | 207 (94.1%) | 13 (5.9%) |
| 26 to 34 Years | 119 (100.0%) | 0 (0.0%) |
| 35 to 44 Years | 150 (88.2%) | 20 (11.8%) |
| 45 to 54 Years | 343 (91.0%) | 34 (9.0%) |
| 55 to 64 Years | 724 (94.2%) | 45 (5.9%) |
| 65 to 74 Years | 433 (100.0%) | 0 (0.0%) |
| 75 Years and older | 259 (100.0%) | 0 (0.0%) |
| Total | 2,538 (95.8%) | 112 (4.2%) |
Health Insurance Coverage by Citizenship Status in Hampton Beach
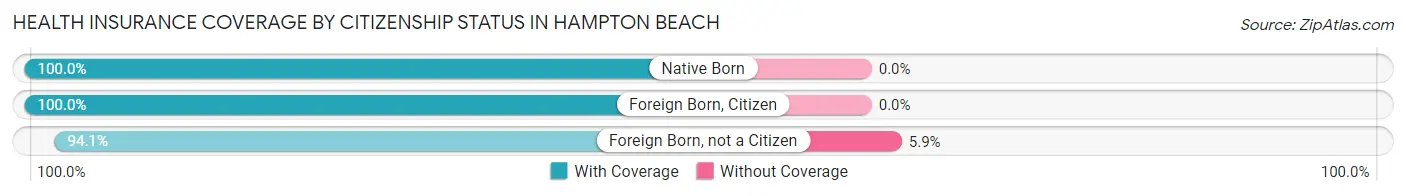
| Citizenship Status | With Coverage | Without Coverage |
| Native Born | 6 (100.0%) | 0 (0.0%) |
| Foreign Born, Citizen | 297 (100.0%) | 0 (0.0%) |
| Foreign Born, not a Citizen | 207 (94.1%) | 13 (5.9%) |
Health Insurance Coverage by Household Income in Hampton Beach
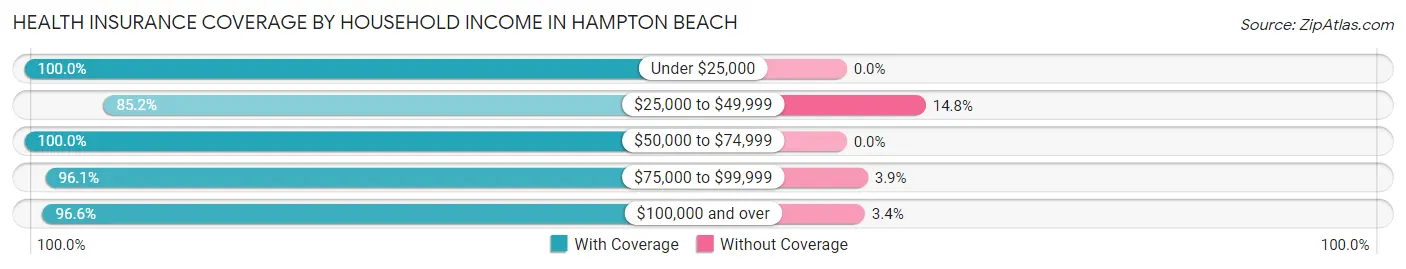
| Household Income | With Coverage | Without Coverage |
| Under $25,000 | 189 (100.0%) | 0 (0.0%) |
| $25,000 to $49,999 | 334 (85.2%) | 58 (14.8%) |
| $50,000 to $74,999 | 528 (100.0%) | 0 (0.0%) |
| $75,000 to $99,999 | 318 (96.1%) | 13 (3.9%) |
| $100,000 and over | 1,169 (96.6%) | 41 (3.4%) |
Public vs Private Health Insurance Coverage by Age in Hampton Beach
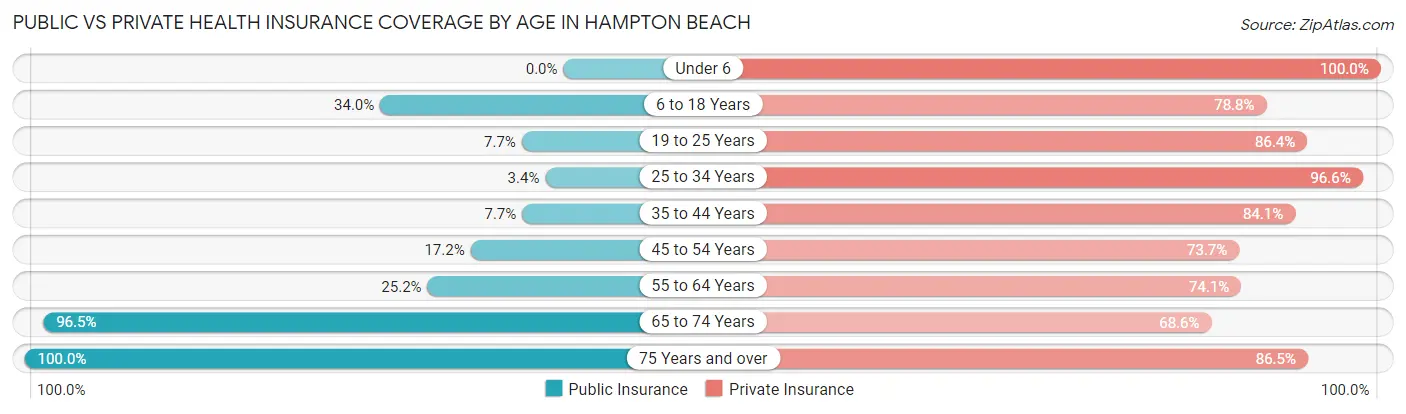
| Age Bracket | Public Insurance | Private Insurance |
| Under 6 | 0 (0.0%) | 6 (100.0%) |
| 6 to 18 Years | 101 (34.0%) | 234 (78.8%) |
| 19 to 25 Years | 17 (7.7%) | 190 (86.4%) |
| 25 to 34 Years | 4 (3.4%) | 115 (96.6%) |
| 35 to 44 Years | 13 (7.6%) | 143 (84.1%) |
| 45 to 54 Years | 65 (17.2%) | 278 (73.7%) |
| 55 to 64 Years | 194 (25.2%) | 570 (74.1%) |
| 65 to 74 Years | 418 (96.5%) | 297 (68.6%) |
| 75 Years and over | 259 (100.0%) | 224 (86.5%) |
| Total | 1,071 (40.4%) | 2,057 (77.6%) |
Disability Status by Sex by Age in Hampton Beach
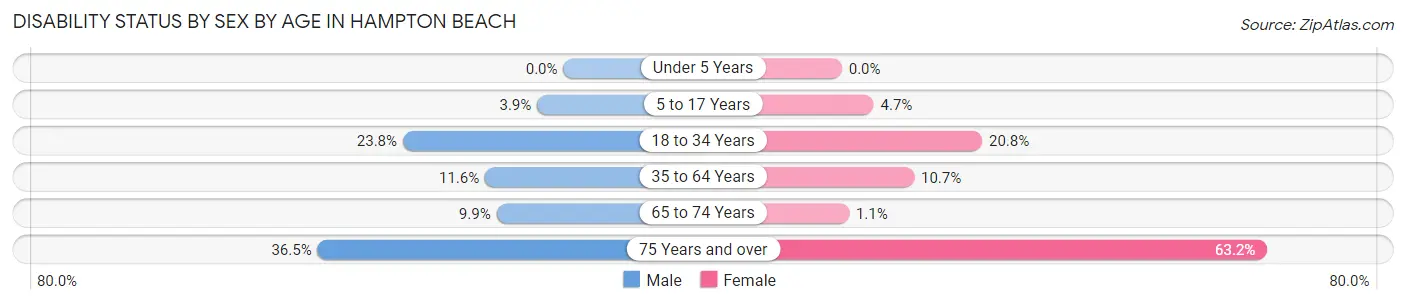
| Age Bracket | Male | Female |
| Under 5 Years | 0 (0.0%) | 0 (0.0%) |
| 5 to 17 Years | 6 (3.9%) | 5 (4.7%) |
| 18 to 34 Years | 61 (23.8%) | 25 (20.8%) |
| 35 to 64 Years | 75 (11.6%) | 72 (10.7%) |
| 65 to 74 Years | 15 (9.9%) | 3 (1.1%) |
| 75 Years and over | 46 (36.5%) | 84 (63.2%) |
Disability Class by Sex by Age in Hampton Beach
Disability Class: Hearing Difficulty
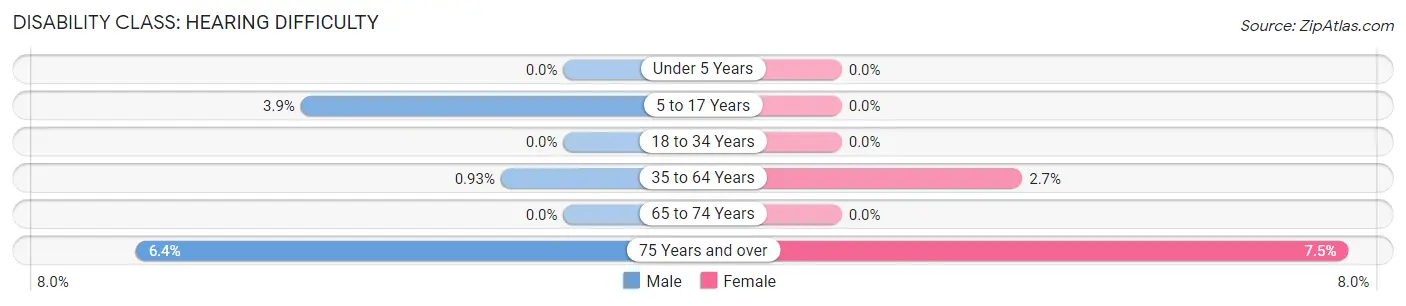
| Age Bracket | Male | Female |
| Under 5 Years | 0 (0.0%) | 0 (0.0%) |
| 5 to 17 Years | 6 (3.9%) | 0 (0.0%) |
| 18 to 34 Years | 0 (0.0%) | 0 (0.0%) |
| 35 to 64 Years | 6 (0.9%) | 18 (2.7%) |
| 65 to 74 Years | 0 (0.0%) | 0 (0.0%) |
| 75 Years and over | 8 (6.4%) | 10 (7.5%) |
Disability Class: Vision Difficulty
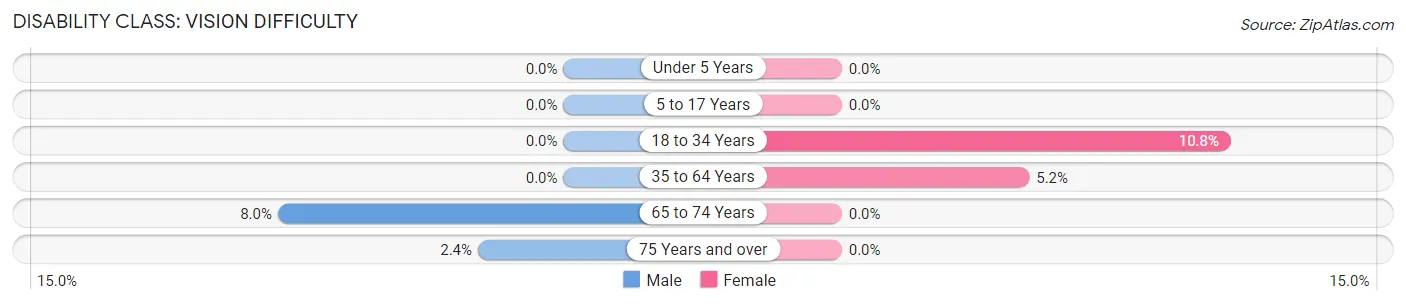
| Age Bracket | Male | Female |
| Under 5 Years | 0 (0.0%) | 0 (0.0%) |
| 5 to 17 Years | 0 (0.0%) | 0 (0.0%) |
| 18 to 34 Years | 0 (0.0%) | 13 (10.8%) |
| 35 to 64 Years | 0 (0.0%) | 35 (5.2%) |
| 65 to 74 Years | 12 (8.0%) | 0 (0.0%) |
| 75 Years and over | 3 (2.4%) | 0 (0.0%) |
Disability Class: Cognitive Difficulty
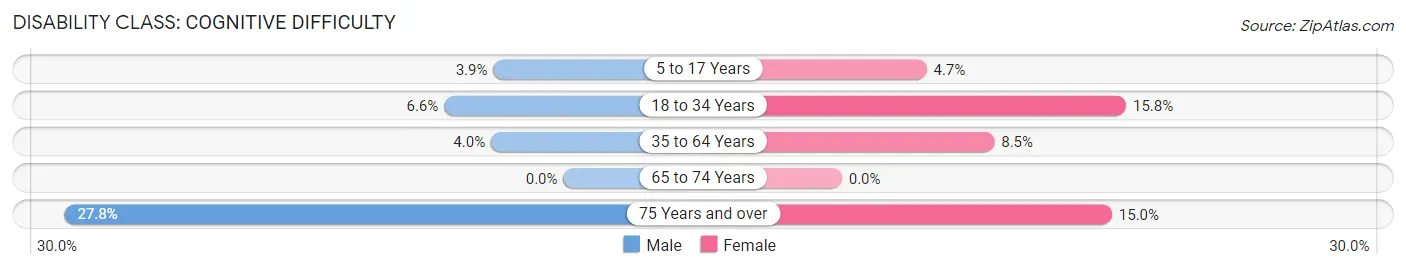
| Age Bracket | Male | Female |
| 5 to 17 Years | 6 (3.9%) | 5 (4.7%) |
| 18 to 34 Years | 17 (6.6%) | 19 (15.8%) |
| 35 to 64 Years | 26 (4.0%) | 57 (8.5%) |
| 65 to 74 Years | 0 (0.0%) | 0 (0.0%) |
| 75 Years and over | 35 (27.8%) | 20 (15.0%) |
Disability Class: Ambulatory Difficulty
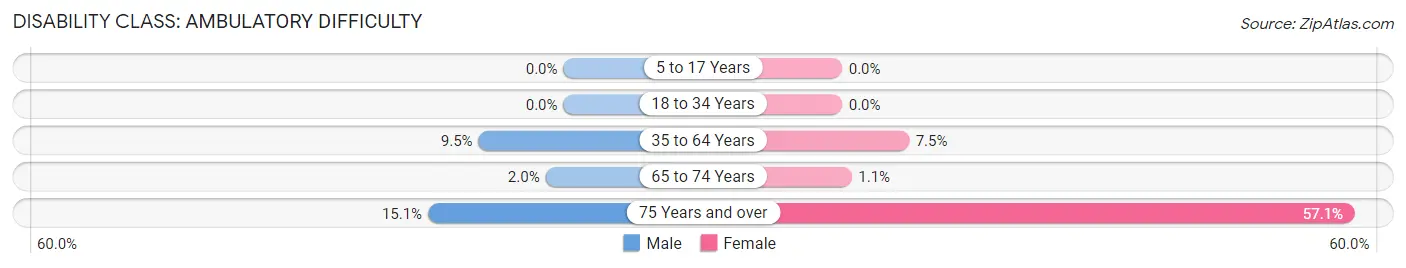
| Age Bracket | Male | Female |
| 5 to 17 Years | 0 (0.0%) | 0 (0.0%) |
| 18 to 34 Years | 0 (0.0%) | 0 (0.0%) |
| 35 to 64 Years | 61 (9.5%) | 50 (7.4%) |
| 65 to 74 Years | 3 (2.0%) | 3 (1.1%) |
| 75 Years and over | 19 (15.1%) | 76 (57.1%) |
Disability Class: Self-Care Difficulty
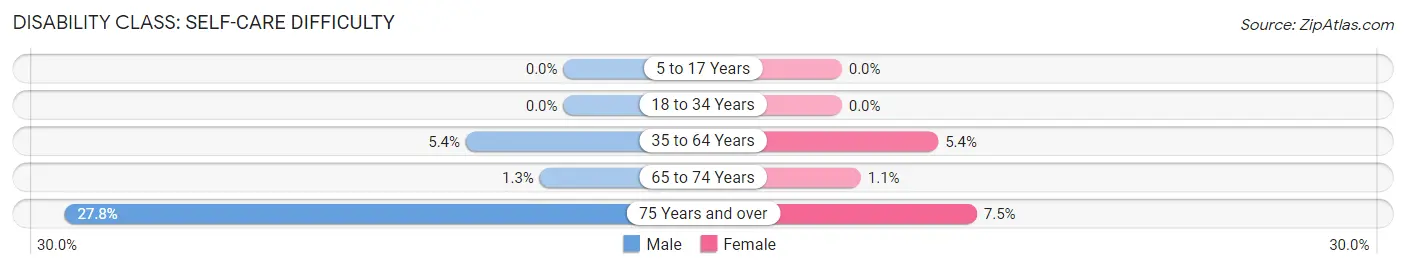
| Age Bracket | Male | Female |
| 5 to 17 Years | 0 (0.0%) | 0 (0.0%) |
| 18 to 34 Years | 0 (0.0%) | 0 (0.0%) |
| 35 to 64 Years | 35 (5.4%) | 36 (5.4%) |
| 65 to 74 Years | 2 (1.3%) | 3 (1.1%) |
| 75 Years and over | 35 (27.8%) | 10 (7.5%) |
Technology Access in Hampton Beach
Computing Device Access in Hampton Beach
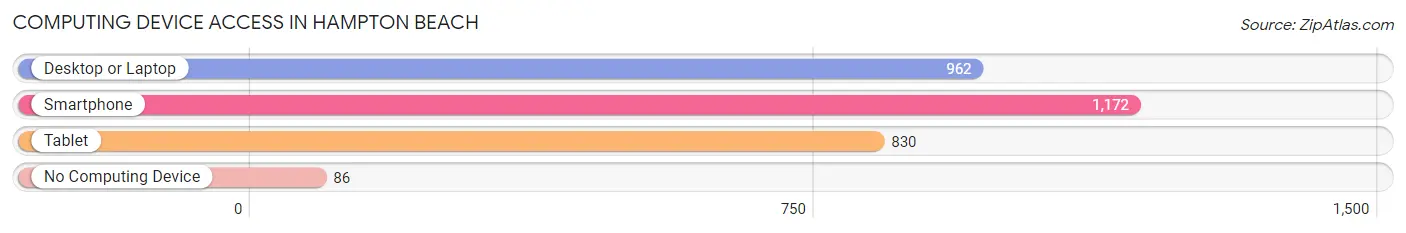
| Device Type | # Households | % Households |
| Desktop or Laptop | 962 | 72.1% |
| Smartphone | 1,172 | 87.9% |
| Tablet | 830 | 62.2% |
| No Computing Device | 86 | 6.5% |
| Total | 1,334 | 100.0% |
Internet Access in Hampton Beach
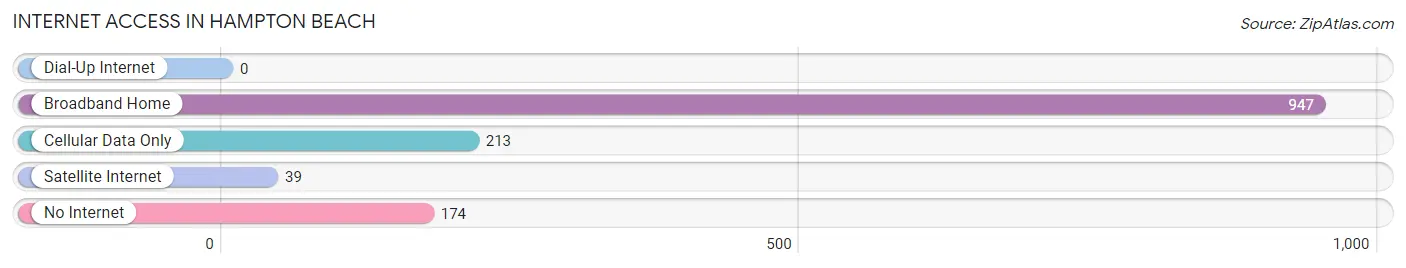
| Internet Type | # Households | % Households |
| Dial-Up Internet | 0 | 0.0% |
| Broadband Home | 947 | 71.0% |
| Cellular Data Only | 213 | 16.0% |
| Satellite Internet | 39 | 2.9% |
| No Internet | 174 | 13.0% |
| Total | 1,334 | 100.0% |
Hampton Beach Summary
Hampton Beach, New Hampshire is a popular beach destination located in the southeastern corner of the state. It is situated along the Atlantic Ocean, just north of the Massachusetts border. The town is known for its beautiful beaches, boardwalk, and lively nightlife. It is a popular summer destination for tourists from all over the country.
Geography
Hampton Beach is located in Rockingham County, New Hampshire. It is situated along the Atlantic Ocean, just north of the Massachusetts border. The town is bordered by the towns of Seabrook to the north, North Hampton to the west, and Rye to the south. The town covers an area of 4.2 square miles, with a population of 2,275 as of the 2010 census.
The town is situated on a barrier island, with the Atlantic Ocean to the east and Hampton Harbor to the west. The harbor is a popular spot for fishing, boating, and other recreational activities. The town is also home to several beaches, including North Beach, South Beach, and Hampton Beach State Park.
Climate
Hampton Beach has a humid continental climate, with warm summers and cold winters. The average high temperature in the summer is around 80 degrees Fahrenheit, while the average low temperature in the winter is around 20 degrees Fahrenheit. The town receives an average of 43 inches of precipitation per year, with the majority of it falling in the summer months.
Demographics
As of the 2010 census, the population of Hampton Beach was 2,275. The racial makeup of the town was 97.2% White, 0.7% African American, 0.3% Native American, 0.4% Asian, 0.1% Pacific Islander, 0.3% from other races, and 1.0% from two or more races. Hispanic or Latino of any race were 1.2% of the population.
The median household income in Hampton Beach was $50,972, and the median family income was $60,972. The per capita income for the town was $27,972. About 5.2% of families and 8.2% of the population were below the poverty line, including 10.2% of those under age 18 and 4.2% of those age 65 or over.
Economy
The economy of Hampton Beach is largely driven by tourism. The town is home to several popular attractions, including the Hampton Beach State Park, the Hampton Beach Casino Ballroom, and the Hampton Beach Boardwalk. The town also has a variety of restaurants, shops, and other businesses that cater to tourists.
In addition to tourism, Hampton Beach is also home to a variety of other businesses. These include seafood processing plants, boat builders, and other businesses related to the fishing industry. The town is also home to a number of small businesses, such as retail stores, restaurants, and other services.
Conclusion
Hampton Beach, New Hampshire is a popular beach destination located in the southeastern corner of the state. It is situated along the Atlantic Ocean, just north of the Massachusetts border. The town is known for its beautiful beaches, boardwalk, and lively nightlife. It is a popular summer destination for tourists from all over the country. The town has a humid continental climate, with warm summers and cold winters. As of the 2010 census, the population of Hampton Beach was 2,275. The economy of Hampton Beach is largely driven by tourism, with a variety of attractions, restaurants, shops, and other businesses catering to tourists. In addition to tourism, the town is also home to a variety of other businesses, such as seafood processing plants, boat builders, and other businesses related to the fishing industry.
Common Questions
What is Per Capita Income in Hampton Beach?
Per Capita income in Hampton Beach is $58,718.
What is the Median Family Income in Hampton Beach?
Median Family Income in Hampton Beach is $128,125.
What is the Median Household income in Hampton Beach?
Median Household Income in Hampton Beach is $73,269.
What is Income or Wage Gap in Hampton Beach?
Income or Wage Gap in Hampton Beach is 25.5%.
Women in Hampton Beach earn 74.5 cents for every dollar earned by a man.
What is Inequality or Gini Index in Hampton Beach?
Inequality or Gini Index in Hampton Beach is 0.48.
What is the Total Population of Hampton Beach?
Total Population of Hampton Beach is 2,650.
What is the Total Male Population of Hampton Beach?
Total Male Population of Hampton Beach is 1,332.
What is the Total Female Population of Hampton Beach?
Total Female Population of Hampton Beach is 1,318.
What is the Ratio of Males per 100 Females in Hampton Beach?
There are 101.06 Males per 100 Females in Hampton Beach.
What is the Ratio of Females per 100 Males in Hampton Beach?
There are 98.95 Females per 100 Males in Hampton Beach.
What is the Median Population Age in Hampton Beach?
Median Population Age in Hampton Beach is 57.7 Years.
What is the Average Family Size in Hampton Beach
Average Family Size in Hampton Beach is 2.7 People.
What is the Average Household Size in Hampton Beach
Average Household Size in Hampton Beach is 2.0 People.
How Large is the Labor Force in Hampton Beach?
There are 1,602 People in the Labor Forcein in Hampton Beach.
What is the Percentage of People in the Labor Force in Hampton Beach?
64.9% of People are in the Labor Force in Hampton Beach.
What is the Unemployment Rate in Hampton Beach?
Unemployment Rate in Hampton Beach is 6.7%.