Fairmont, NE Map & Demographics
Fairmont Map
Fairmont Overview
$32,397
PER CAPITA INCOME
$73,750
AVG FAMILY INCOME
$53,917
AVG HOUSEHOLD INCOME
36.0%
WAGE / INCOME GAP [ % ]
64.0¢/ $1
WAGE / INCOME GAP [ $ ]
0.37
INEQUALITY / GINI INDEX
621
TOTAL POPULATION
303
MALE POPULATION
318
FEMALE POPULATION
95.28
MALES / 100 FEMALES
104.95
FEMALES / 100 MALES
58.9
MEDIAN AGE
2.6
AVG FAMILY SIZE
2.0
AVG HOUSEHOLD SIZE
244
LABOR FORCE [ PEOPLE ]
45.4%
PERCENT IN LABOR FORCE
3.3%
UNEMPLOYMENT RATE
Fairmont Zip Codes
Fairmont Area Codes
Income in Fairmont
Income Overview in Fairmont
Per Capita Income in Fairmont is $32,397, while median incomes of families and households are $73,750 and $53,917 respectively.
| Characteristic | Number | Measure |
| Per Capita Income | 621 | $32,397 |
| Median Family Income | 157 | $73,750 |
| Mean Family Income | 157 | $77,142 |
| Median Household Income | 297 | $53,917 |
| Mean Household Income | 297 | $66,381 |
| Income Deficit | 157 | $0 |
| Wage / Income Gap (%) | 621 | 35.97% |
| Wage / Income Gap ($) | 621 | 64.03¢ per $1 |
| Gini / Inequality Index | 621 | 0.37 |
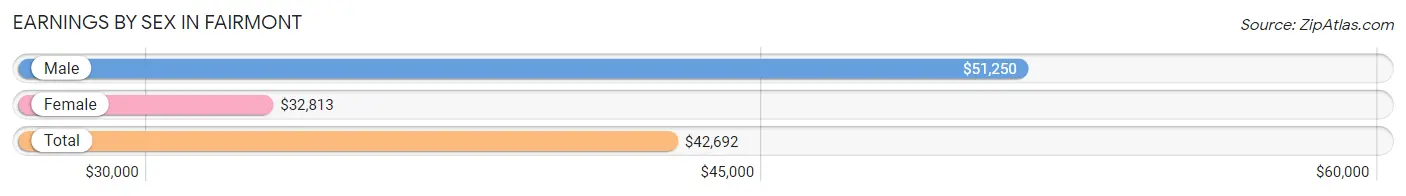
Earnings by Sex in Fairmont
Average Earnings in Fairmont are $42,692, $51,250 for men and $32,813 for women, a difference of 36.0%.
| Sex | Number | Average Earnings |
| Male | 121 (44.8%) | $51,250 |
| Female | 149 (55.2%) | $32,813 |
| Total | 270 (100.0%) | $42,692 |
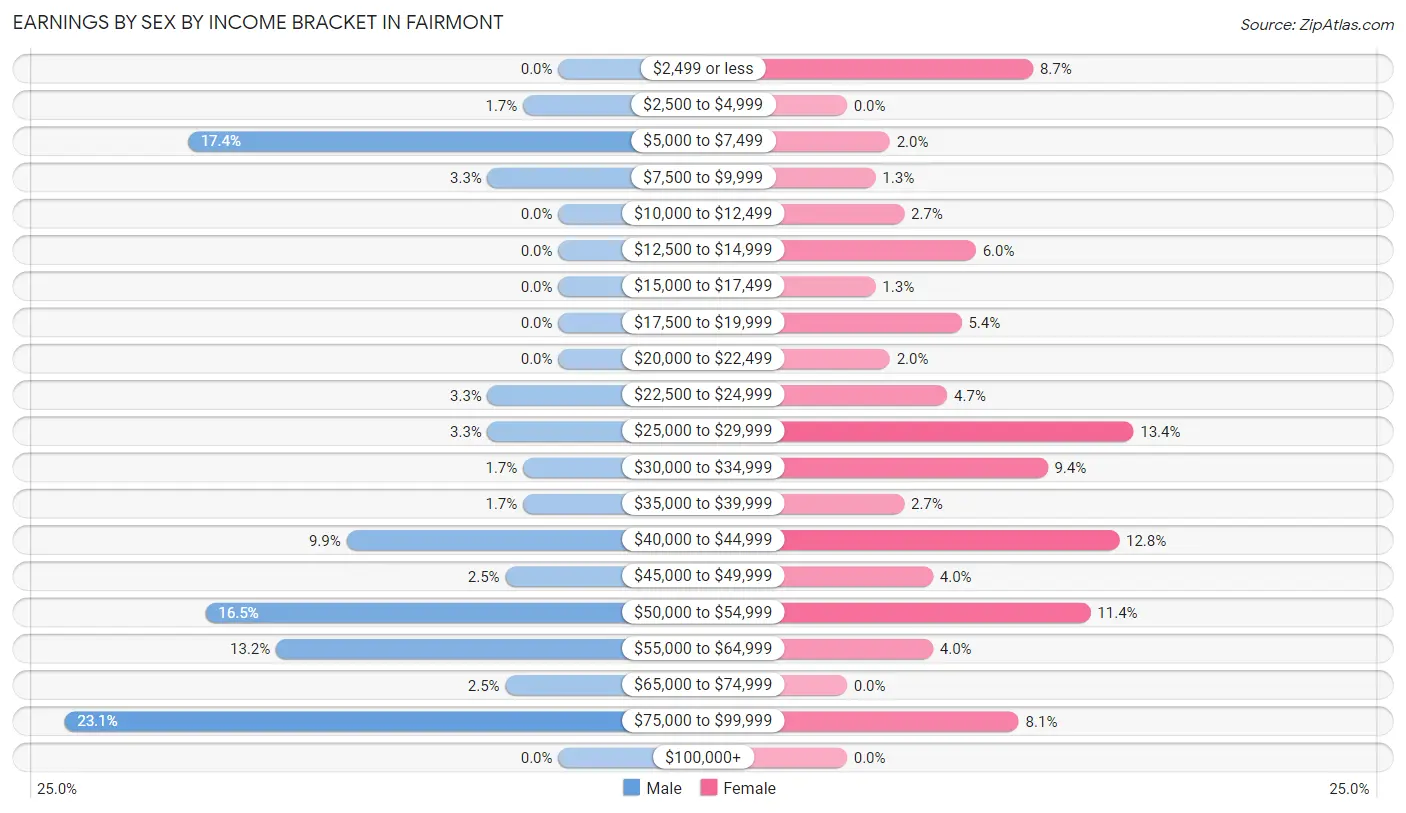
Earnings by Sex by Income Bracket in Fairmont
The most common earnings brackets in Fairmont are $75,000 to $99,999 for men (28 | 23.1%) and $25,000 to $29,999 for women (20 | 13.4%).
| Income | Male | Female |
| $2,499 or less | 0 (0.0%) | 13 (8.7%) |
| $2,500 to $4,999 | 2 (1.7%) | 0 (0.0%) |
| $5,000 to $7,499 | 21 (17.4%) | 3 (2.0%) |
| $7,500 to $9,999 | 4 (3.3%) | 2 (1.3%) |
| $10,000 to $12,499 | 0 (0.0%) | 4 (2.7%) |
| $12,500 to $14,999 | 0 (0.0%) | 9 (6.0%) |
| $15,000 to $17,499 | 0 (0.0%) | 2 (1.3%) |
| $17,500 to $19,999 | 0 (0.0%) | 8 (5.4%) |
| $20,000 to $22,499 | 0 (0.0%) | 3 (2.0%) |
| $22,500 to $24,999 | 4 (3.3%) | 7 (4.7%) |
| $25,000 to $29,999 | 4 (3.3%) | 20 (13.4%) |
| $30,000 to $34,999 | 2 (1.7%) | 14 (9.4%) |
| $35,000 to $39,999 | 2 (1.7%) | 4 (2.7%) |
| $40,000 to $44,999 | 12 (9.9%) | 19 (12.8%) |
| $45,000 to $49,999 | 3 (2.5%) | 6 (4.0%) |
| $50,000 to $54,999 | 20 (16.5%) | 17 (11.4%) |
| $55,000 to $64,999 | 16 (13.2%) | 6 (4.0%) |
| $65,000 to $74,999 | 3 (2.5%) | 0 (0.0%) |
| $75,000 to $99,999 | 28 (23.1%) | 12 (8.1%) |
| $100,000+ | 0 (0.0%) | 0 (0.0%) |
| Total | 121 (100.0%) | 149 (100.0%) |
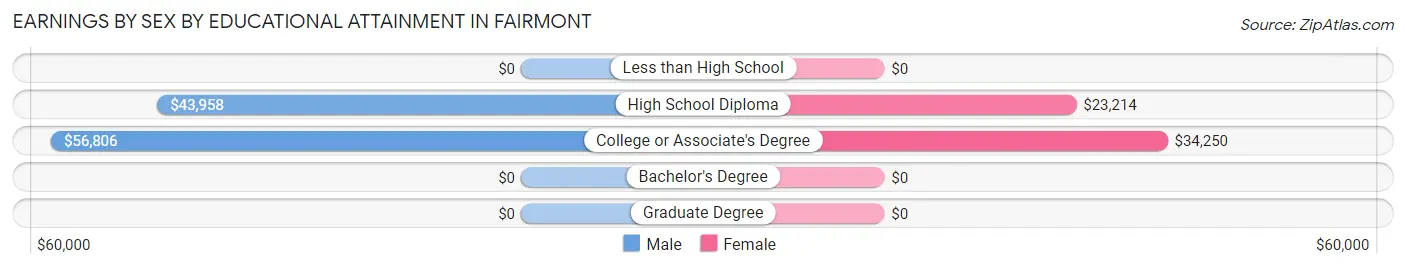
Earnings by Sex by Educational Attainment in Fairmont
Average earnings in Fairmont are $51,442 for men and $32,813 for women, a difference of 36.2%. Men with an educational attainment of college or associate's degree enjoy the highest average annual earnings of $56,806, while those with high school diploma education earn the least with $43,958. Women with an educational attainment of college or associate's degree earn the most with the average annual earnings of $34,250, while those with high school diploma education have the smallest earnings of $23,214.
| Educational Attainment | Male Income | Female Income |
| Less than High School | - | - |
| High School Diploma | $43,958 | $23,214 |
| College or Associate's Degree | $56,806 | $34,250 |
| Bachelor's Degree | - | - |
| Graduate Degree | - | - |
| Total | $51,442 | $32,813 |
Family Income in Fairmont
Family Income Brackets in Fairmont
According to the Fairmont family income data, there are 41 families falling into the $50,000 to $74,999 income range, which is the most common income bracket and makes up 26.1% of all families.
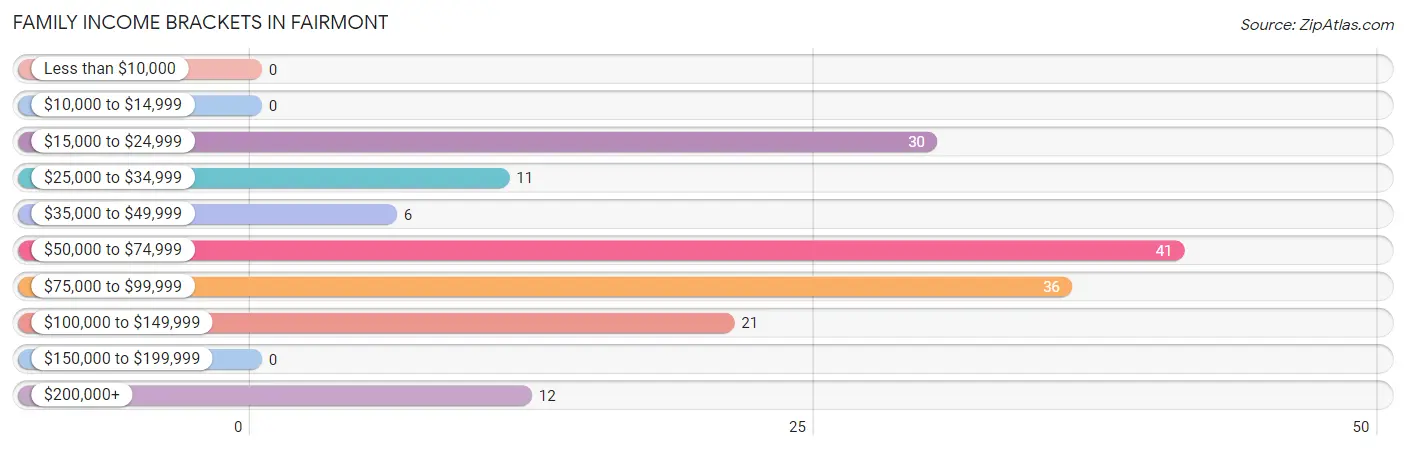
| Income Bracket | # Families | % Families |
| Less than $10,000 | 0 | 0.0% |
| $10,000 to $14,999 | 0 | 0.0% |
| $15,000 to $24,999 | 30 | 19.1% |
| $25,000 to $34,999 | 11 | 7.0% |
| $35,000 to $49,999 | 6 | 3.8% |
| $50,000 to $74,999 | 41 | 26.1% |
| $75,000 to $99,999 | 36 | 22.9% |
| $100,000 to $149,999 | 21 | 13.4% |
| $150,000 to $199,999 | 0 | 0.0% |
| $200,000+ | 12 | 7.6% |
Family Income by Famaliy Size in Fairmont
3-person families (19 | 12.1%) account for the highest median family income in Fairmont with $86,875 per family, while 2-person families (111 | 70.7%) have the highest median income of $36,744 per family member.
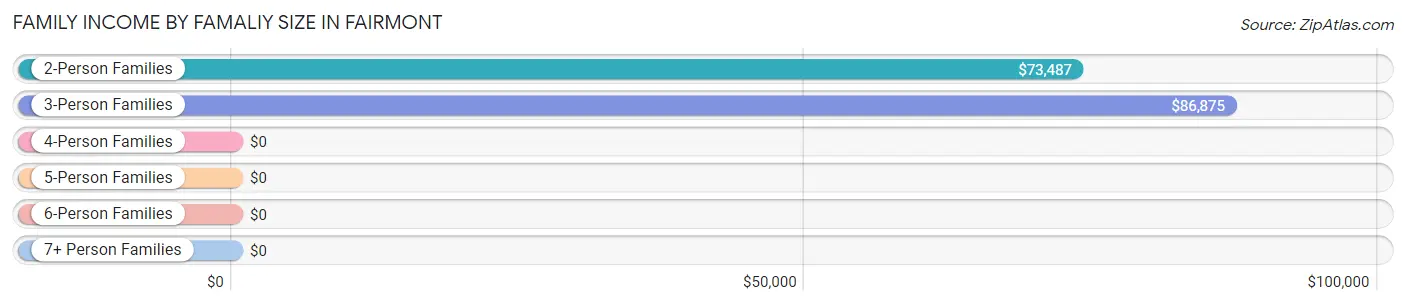
| Income Bracket | # Families | Median Income |
| 2-Person Families | 111 (70.7%) | $73,487 |
| 3-Person Families | 19 (12.1%) | $86,875 |
| 4-Person Families | 17 (10.8%) | $0 |
| 5-Person Families | 6 (3.8%) | $0 |
| 6-Person Families | 0 (0.0%) | $0 |
| 7+ Person Families | 4 (2.5%) | $0 |
| Total | 157 (100.0%) | $73,750 |
Family Income by Number of Earners in Fairmont
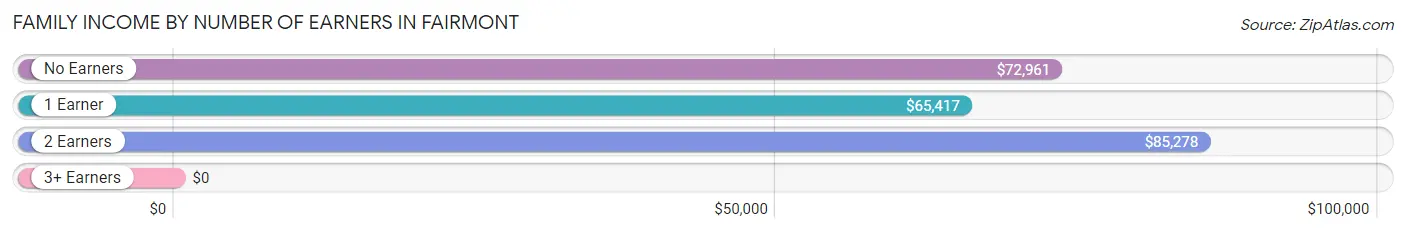
| Number of Earners | # Families | Median Income |
| No Earners | 65 (41.4%) | $72,961 |
| 1 Earner | 14 (8.9%) | $65,417 |
| 2 Earners | 78 (49.7%) | $85,278 |
| 3+ Earners | 0 (0.0%) | $0 |
| Total | 157 (100.0%) | $73,750 |
Household Income in Fairmont
Household Income Brackets in Fairmont
With 68 households falling in the category, the $25,000 to $34,999 income range is the most frequent in Fairmont, accounting for 22.9% of all households.
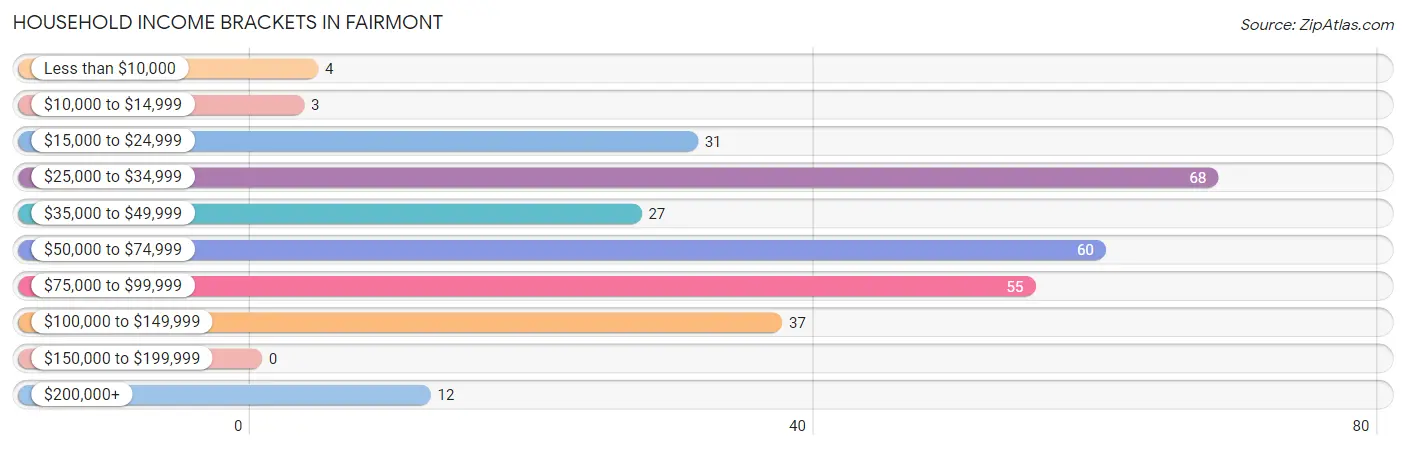
| Income Bracket | # Households | % Households |
| Less than $10,000 | 4 | 1.3% |
| $10,000 to $14,999 | 3 | 1.0% |
| $15,000 to $24,999 | 31 | 10.4% |
| $25,000 to $34,999 | 68 | 22.9% |
| $35,000 to $49,999 | 27 | 9.1% |
| $50,000 to $74,999 | 60 | 20.2% |
| $75,000 to $99,999 | 55 | 18.5% |
| $100,000 to $149,999 | 37 | 12.5% |
| $150,000 to $199,999 | 0 | 0.0% |
| $200,000+ | 12 | 4.0% |
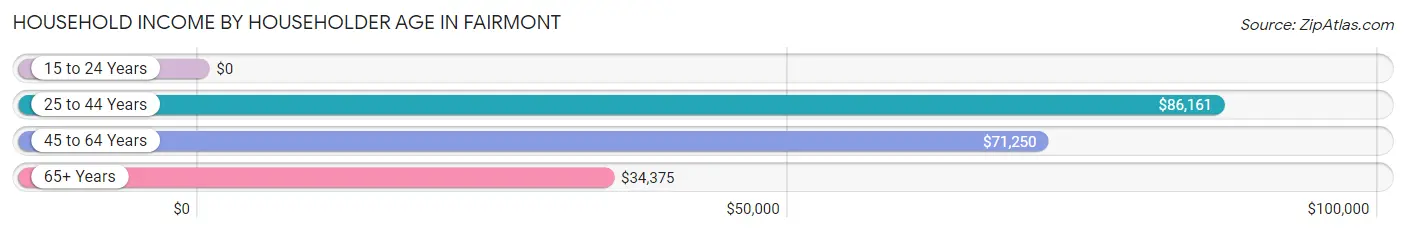
Household Income by Householder Age in Fairmont
The median household income in Fairmont is $53,917, with the highest median household income of $86,161 found in the 25 to 44 years age bracket for the primary householder. A total of 57 households (19.2%) fall into this category.
| Income Bracket | # Households | Median Income |
| 15 to 24 Years | 0 (0.0%) | $0 |
| 25 to 44 Years | 57 (19.2%) | $86,161 |
| 45 to 64 Years | 91 (30.6%) | $71,250 |
| 65+ Years | 149 (50.2%) | $34,375 |
| Total | 297 (100.0%) | $53,917 |
Poverty in Fairmont
Income Below Poverty by Sex and Age in Fairmont
With 14.1% poverty level for males and 18.3% for females among the residents of Fairmont, 65 to 74 year old males and 6 to 11 year old females are the most vulnerable to poverty, with 24 males (40.0%) and 7 females (63.6%) in their respective age groups living below the poverty level.
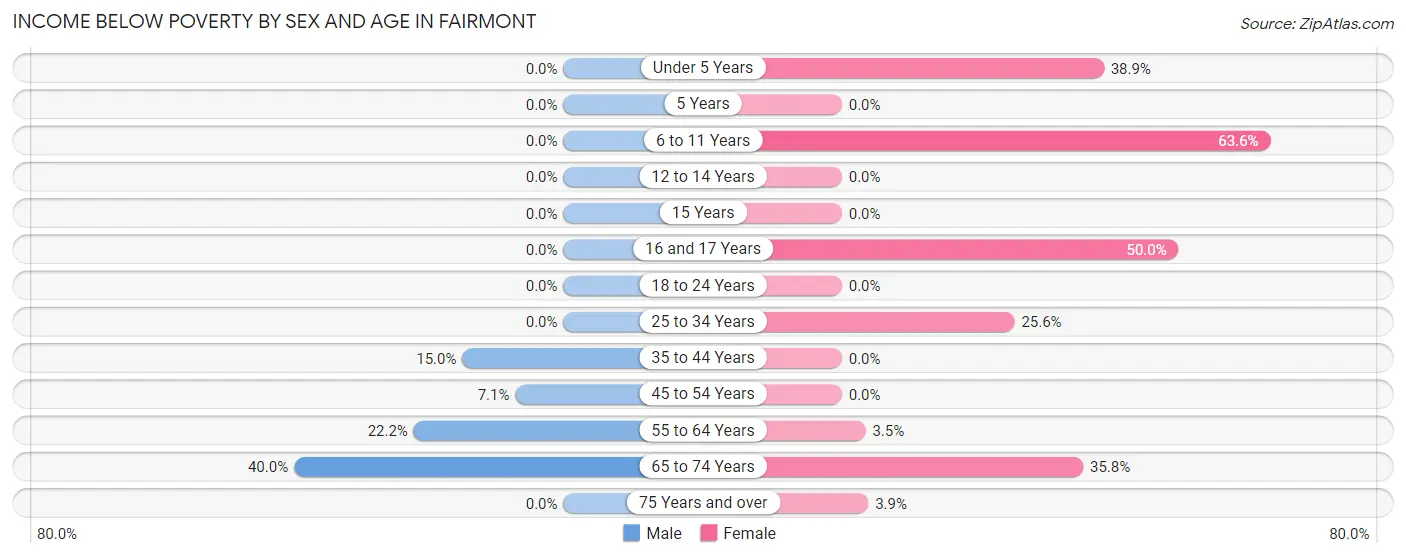
| Age Bracket | Male | Female |
| Under 5 Years | 0 (0.0%) | 7 (38.9%) |
| 5 Years | 0 (0.0%) | 0 (0.0%) |
| 6 to 11 Years | 0 (0.0%) | 7 (63.6%) |
| 12 to 14 Years | 0 (0.0%) | 0 (0.0%) |
| 15 Years | 0 (0.0%) | 0 (0.0%) |
| 16 and 17 Years | 0 (0.0%) | 3 (50.0%) |
| 18 to 24 Years | 0 (0.0%) | 0 (0.0%) |
| 25 to 34 Years | 0 (0.0%) | 10 (25.6%) |
| 35 to 44 Years | 6 (15.0%) | 0 (0.0%) |
| 45 to 54 Years | 2 (7.1%) | 0 (0.0%) |
| 55 to 64 Years | 8 (22.2%) | 2 (3.5%) |
| 65 to 74 Years | 24 (40.0%) | 24 (35.8%) |
| 75 Years and over | 0 (0.0%) | 2 (3.9%) |
| Total | 40 (14.1%) | 55 (18.3%) |
Income Above Poverty by Sex and Age in Fairmont
According to the poverty statistics in Fairmont, males aged under 5 years and females aged 12 to 14 years are the age groups that are most secure financially, with 100.0% of males and 100.0% of females in these age groups living above the poverty line.
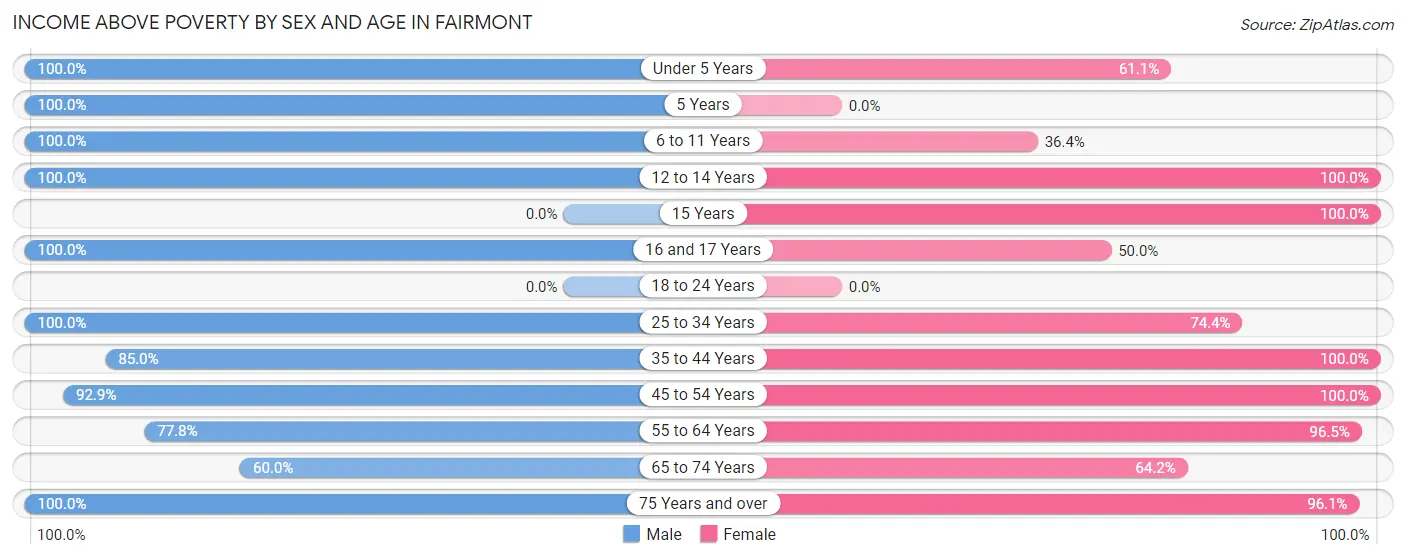
| Age Bracket | Male | Female |
| Under 5 Years | 18 (100.0%) | 11 (61.1%) |
| 5 Years | 5 (100.0%) | 0 (0.0%) |
| 6 to 11 Years | 10 (100.0%) | 4 (36.4%) |
| 12 to 14 Years | 7 (100.0%) | 9 (100.0%) |
| 15 Years | 0 (0.0%) | 5 (100.0%) |
| 16 and 17 Years | 7 (100.0%) | 3 (50.0%) |
| 18 to 24 Years | 0 (0.0%) | 0 (0.0%) |
| 25 to 34 Years | 30 (100.0%) | 29 (74.4%) |
| 35 to 44 Years | 34 (85.0%) | 10 (100.0%) |
| 45 to 54 Years | 26 (92.9%) | 27 (100.0%) |
| 55 to 64 Years | 28 (77.8%) | 55 (96.5%) |
| 65 to 74 Years | 36 (60.0%) | 43 (64.2%) |
| 75 Years and over | 42 (100.0%) | 49 (96.1%) |
| Total | 243 (85.9%) | 245 (81.7%) |
Income Below Poverty Among Married-Couple Families in Fairmont
The poverty statistics for married-couple families in Fairmont show that 20.6% or 29 of the total 141 families live below the poverty line. Families with no children have the highest poverty rate of 22.8%, comprising of 23 families. On the other hand, families with 3 or 4 children have the lowest poverty rate of 0.0%, which includes 0 families.
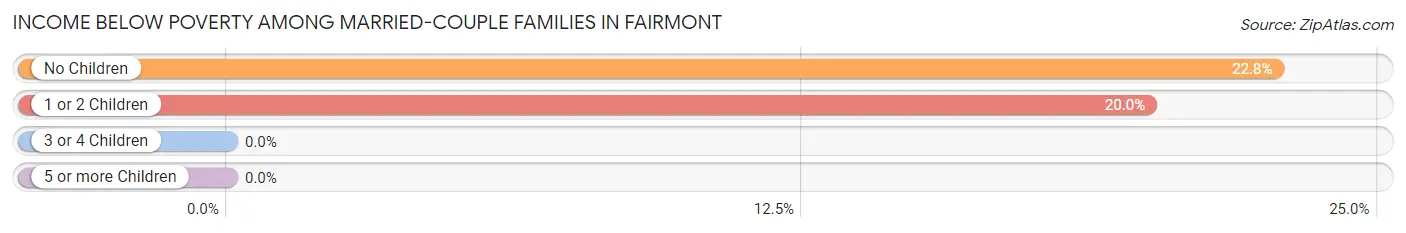
| Children | Above Poverty | Below Poverty |
| No Children | 78 (77.2%) | 23 (22.8%) |
| 1 or 2 Children | 24 (80.0%) | 6 (20.0%) |
| 3 or 4 Children | 6 (100.0%) | 0 (0.0%) |
| 5 or more Children | 4 (100.0%) | 0 (0.0%) |
| Total | 112 (79.4%) | 29 (20.6%) |
Income Below Poverty Among Single-Parent Households in Fairmont
| Children | Single Father | Single Mother |
| No Children | 0 (0.0%) | 0 (0.0%) |
| 1 or 2 Children | 0 (0.0%) | 0 (0.0%) |
| 3 or 4 Children | 0 (0.0%) | 0 (0.0%) |
| 5 or more Children | 0 (0.0%) | 0 (0.0%) |
| Total | 0 (0.0%) | 0 (0.0%) |
Income Below Poverty Among Married-Couple vs Single-Parent Households in Fairmont
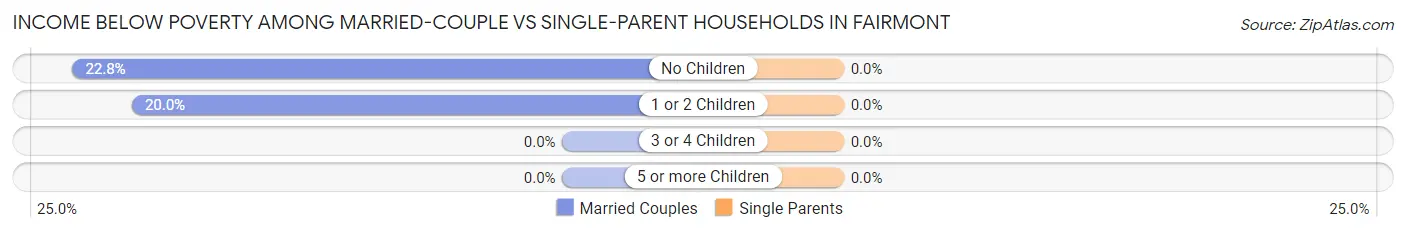
| Children | Married-Couple Families | Single-Parent Households |
| No Children | 23 (22.8%) | 0 (0.0%) |
| 1 or 2 Children | 6 (20.0%) | 0 (0.0%) |
| 3 or 4 Children | 0 (0.0%) | 0 (0.0%) |
| 5 or more Children | 0 (0.0%) | 0 (0.0%) |
| Total | 29 (20.6%) | 0 (0.0%) |
Race in Fairmont
The most populous races in Fairmont are White / Caucasian (611 | 98.4%), Two or more Races (10 | 1.6%), and Hispanic or Latino (7 | 1.1%).
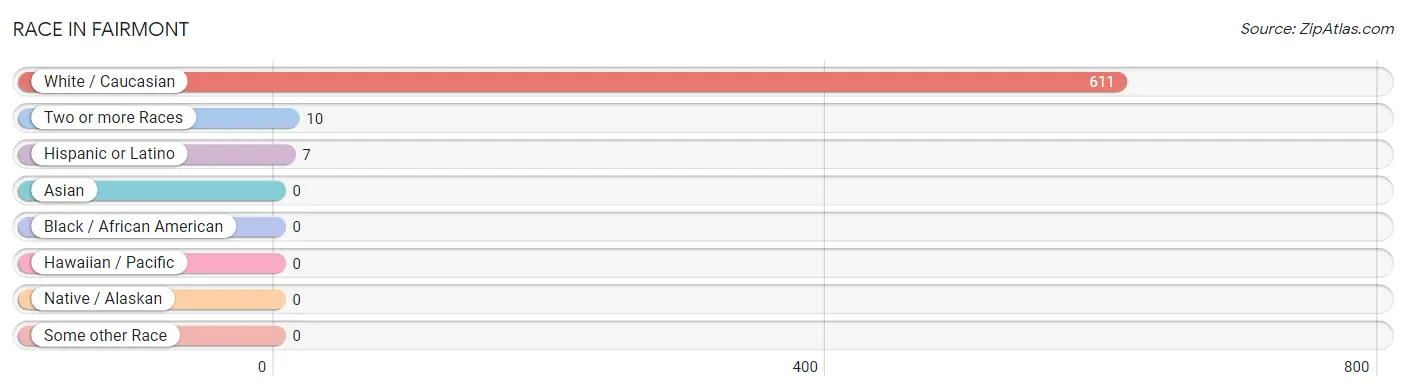
| Race | # Population | % Population |
| Asian | 0 | 0.0% |
| Black / African American | 0 | 0.0% |
| Hawaiian / Pacific | 0 | 0.0% |
| Hispanic or Latino | 7 | 1.1% |
| Native / Alaskan | 0 | 0.0% |
| White / Caucasian | 611 | 98.4% |
| Two or more Races | 10 | 1.6% |
| Some other Race | 0 | 0.0% |
| Total | 621 | 100.0% |
Ancestry in Fairmont
The most populous ancestries reported in Fairmont are German (274 | 44.1%), Irish (110 | 17.7%), English (62 | 10.0%), Czech (48 | 7.7%), and Swedish (30 | 4.8%), together accounting for 84.4% of all Fairmont residents.
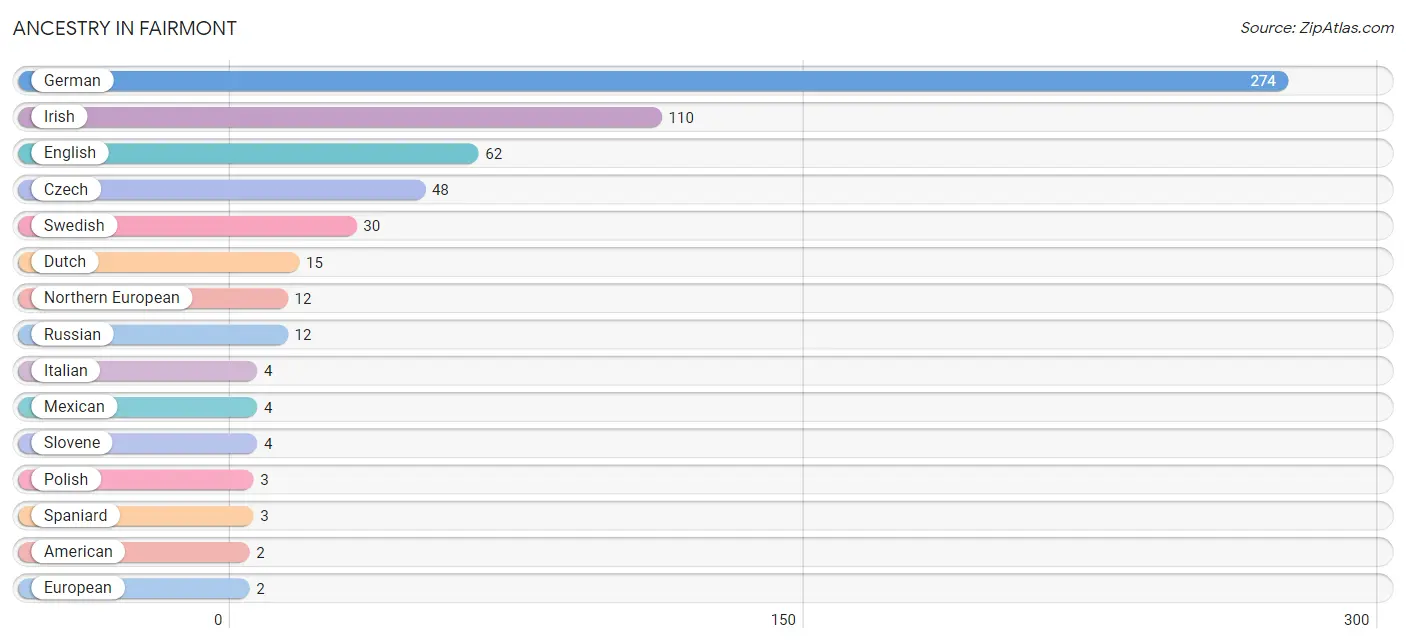
| Ancestry | # Population | % Population |
| American | 2 | 0.3% |
| Czech | 48 | 7.7% |
| Dutch | 15 | 2.4% |
| English | 62 | 10.0% |
| European | 2 | 0.3% |
| German | 274 | 44.1% |
| Irish | 110 | 17.7% |
| Italian | 4 | 0.6% |
| Mexican | 4 | 0.6% |
| Northern European | 12 | 1.9% |
| Norwegian | 2 | 0.3% |
| Pennsylvania German | 2 | 0.3% |
| Polish | 3 | 0.5% |
| Russian | 12 | 1.9% |
| Scottish | 2 | 0.3% |
| Sioux | 2 | 0.3% |
| Slovene | 4 | 0.6% |
| Spaniard | 3 | 0.5% |
| Swedish | 30 | 4.8% |
| Welsh | 2 | 0.3% | View All 20 Rows |
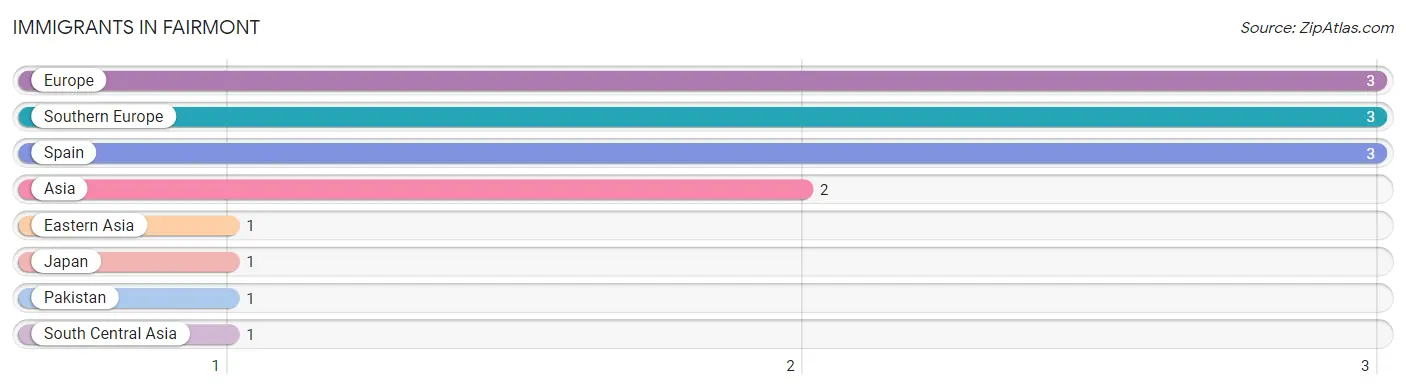
Immigrants in Fairmont
The most numerous immigrant groups reported in Fairmont came from Europe (3 | 0.5%), Southern Europe (3 | 0.5%), Spain (3 | 0.5%), Asia (2 | 0.3%), and Eastern Asia (1 | 0.2%), together accounting for 1.9% of all Fairmont residents.
| Immigration Origin | # Population | % Population |
| Asia | 2 | 0.3% |
| Eastern Asia | 1 | 0.2% |
| Europe | 3 | 0.5% |
| Japan | 1 | 0.2% |
| Pakistan | 1 | 0.2% |
| South Central Asia | 1 | 0.2% |
| Southern Europe | 3 | 0.5% |
| Spain | 3 | 0.5% | View All 8 Rows |
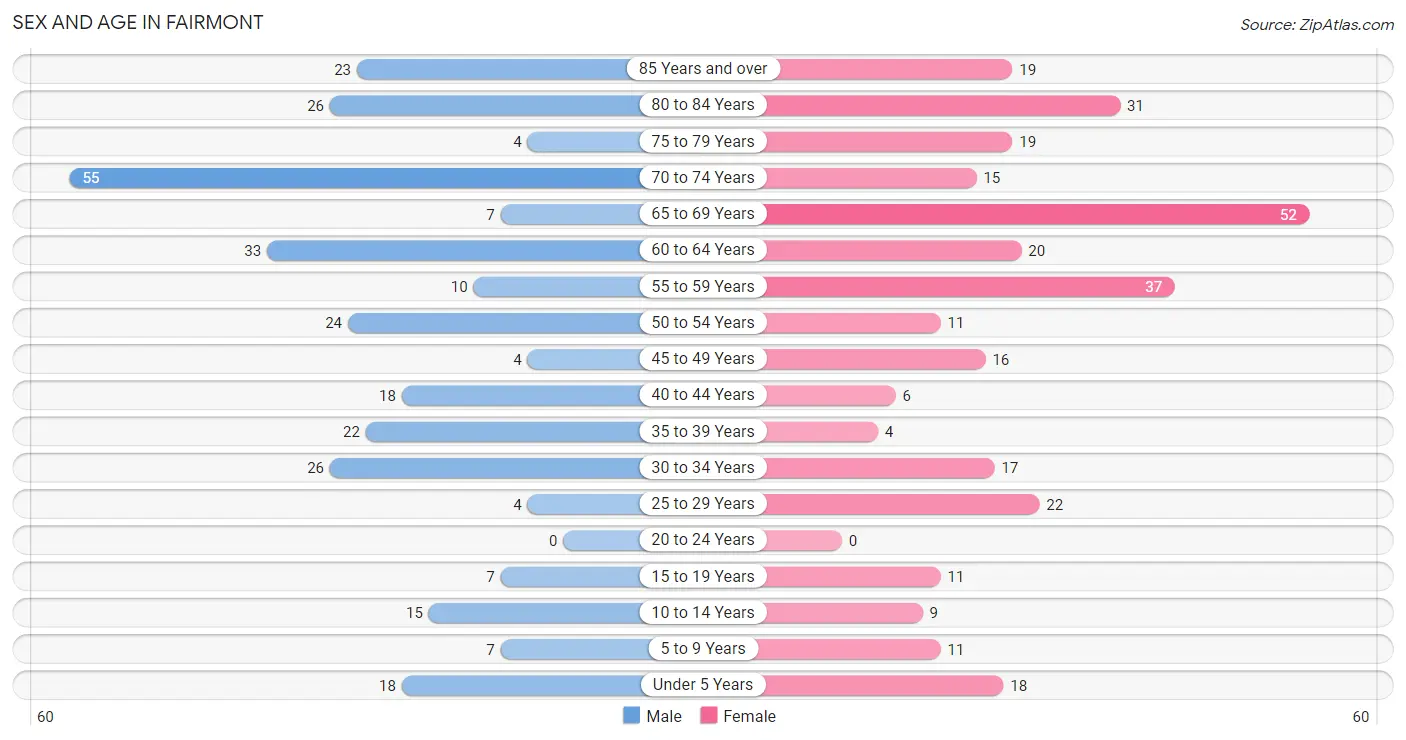
Sex and Age in Fairmont
Sex and Age in Fairmont
The most populous age groups in Fairmont are 70 to 74 Years (55 | 18.1%) for men and 65 to 69 Years (52 | 16.4%) for women.
| Age Bracket | Male | Female |
| Under 5 Years | 18 (5.9%) | 18 (5.7%) |
| 5 to 9 Years | 7 (2.3%) | 11 (3.5%) |
| 10 to 14 Years | 15 (5.0%) | 9 (2.8%) |
| 15 to 19 Years | 7 (2.3%) | 11 (3.5%) |
| 20 to 24 Years | 0 (0.0%) | 0 (0.0%) |
| 25 to 29 Years | 4 (1.3%) | 22 (6.9%) |
| 30 to 34 Years | 26 (8.6%) | 17 (5.3%) |
| 35 to 39 Years | 22 (7.3%) | 4 (1.3%) |
| 40 to 44 Years | 18 (5.9%) | 6 (1.9%) |
| 45 to 49 Years | 4 (1.3%) | 16 (5.0%) |
| 50 to 54 Years | 24 (7.9%) | 11 (3.5%) |
| 55 to 59 Years | 10 (3.3%) | 37 (11.6%) |
| 60 to 64 Years | 33 (10.9%) | 20 (6.3%) |
| 65 to 69 Years | 7 (2.3%) | 52 (16.4%) |
| 70 to 74 Years | 55 (18.1%) | 15 (4.7%) |
| 75 to 79 Years | 4 (1.3%) | 19 (6.0%) |
| 80 to 84 Years | 26 (8.6%) | 31 (9.8%) |
| 85 Years and over | 23 (7.6%) | 19 (6.0%) |
| Total | 303 (100.0%) | 318 (100.0%) |
Families and Households in Fairmont
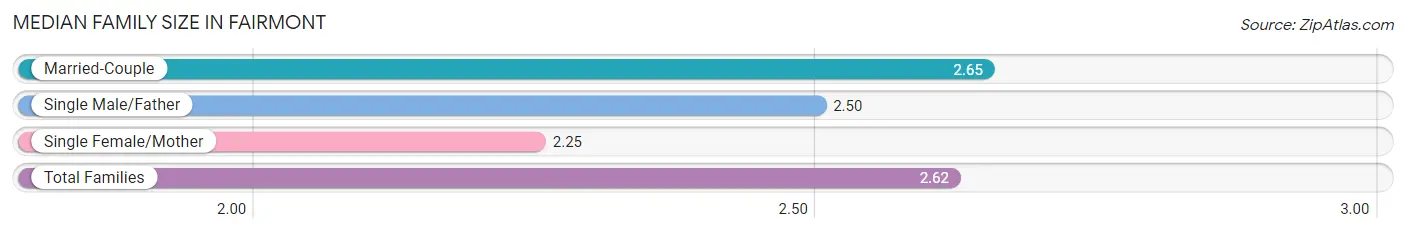
Median Family Size in Fairmont
The median family size in Fairmont is 2.62 persons per family, with married-couple families (141 | 89.8%) accounting for the largest median family size of 2.65 persons per family. On the other hand, single female/mother families (12 | 7.6%) represent the smallest median family size with 2.25 persons per family.
| Family Type | # Families | Family Size |
| Married-Couple | 141 (89.8%) | 2.65 |
| Single Male/Father | 4 (2.5%) | 2.50 |
| Single Female/Mother | 12 (7.6%) | 2.25 |
| Total Families | 157 (100.0%) | 2.62 |
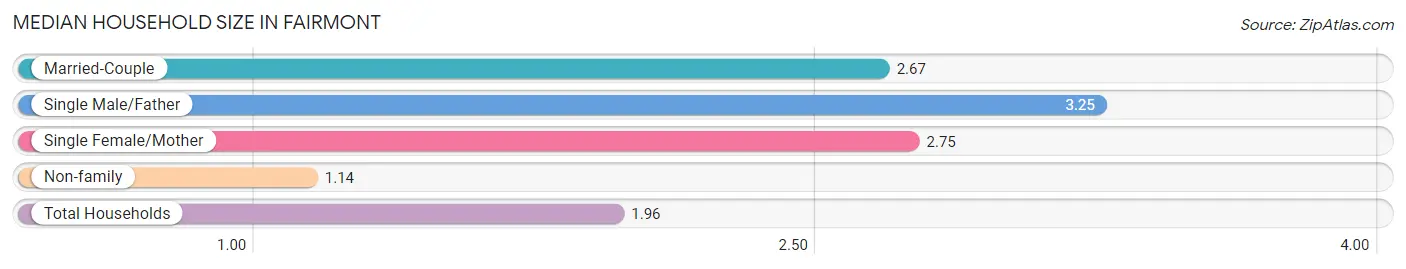
Median Household Size in Fairmont
The median household size in Fairmont is 1.96 persons per household, with single male/father households (4 | 1.3%) accounting for the largest median household size of 3.25 persons per household. non-family households (140 | 47.1%) represent the smallest median household size with 1.14 persons per household.
| Household Type | # Households | Household Size |
| Married-Couple | 141 (47.5%) | 2.67 |
| Single Male/Father | 4 (1.3%) | 3.25 |
| Single Female/Mother | 12 (4.0%) | 2.75 |
| Non-family | 140 (47.1%) | 1.14 |
| Total Households | 297 (100.0%) | 1.96 |
Household Size by Marriage Status in Fairmont
Out of a total of 297 households in Fairmont, 157 (52.9%) are family households, while 140 (47.1%) are nonfamily households. The most numerous type of family households are 2-person households, comprising 101, and the most common type of nonfamily households are 1-person households, comprising 117.
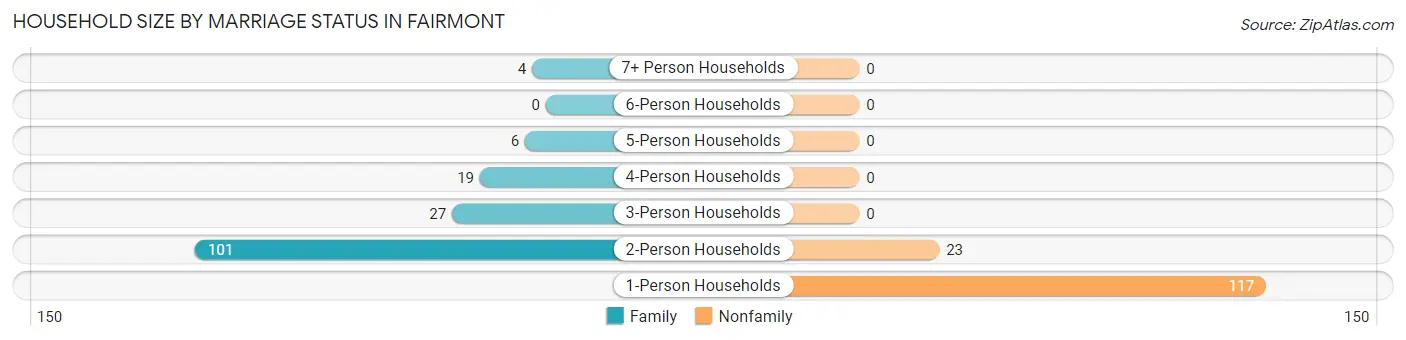
| Household Size | Family Households | Nonfamily Households |
| 1-Person Households | - | 117 (39.4%) |
| 2-Person Households | 101 (34.0%) | 23 (7.7%) |
| 3-Person Households | 27 (9.1%) | 0 (0.0%) |
| 4-Person Households | 19 (6.4%) | 0 (0.0%) |
| 5-Person Households | 6 (2.0%) | 0 (0.0%) |
| 6-Person Households | 0 (0.0%) | 0 (0.0%) |
| 7+ Person Households | 4 (1.3%) | 0 (0.0%) |
| Total | 157 (52.9%) | 140 (47.1%) |
Female Fertility in Fairmont
Fertility by Age in Fairmont
Average fertility rate in Fairmont is 118.0 births per 1,000 women. Women in the age bracket of 20 to 34 years have the highest fertility rate with 231.0 births per 1,000 women. Women in the age bracket of 20 to 34 years acount for 100.0% of all women with births.
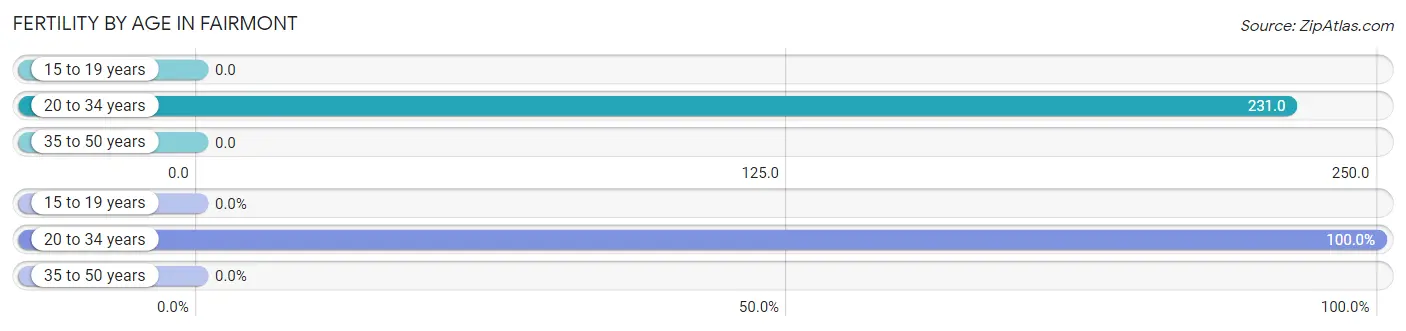
| Age Bracket | Women with Births | Births / 1,000 Women |
| 15 to 19 years | 0 (0.0%) | 0.0 |
| 20 to 34 years | 9 (100.0%) | 231.0 |
| 35 to 50 years | 0 (0.0%) | 0.0 |
| Total | 9 (100.0%) | 118.0 |
Fertility by Age by Marriage Status in Fairmont
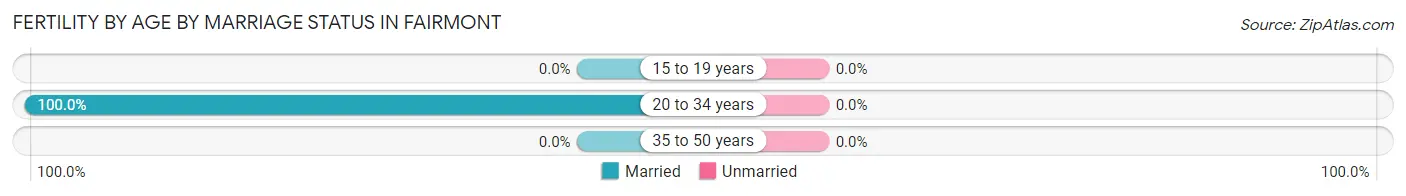
| Age Bracket | Married | Unmarried |
| 15 to 19 years | 0 (0.0%) | 0 (0.0%) |
| 20 to 34 years | 9 (100.0%) | 0 (0.0%) |
| 35 to 50 years | 0 (0.0%) | 0 (0.0%) |
| Total | 9 (100.0%) | 0 (0.0%) |
Fertility by Education in Fairmont
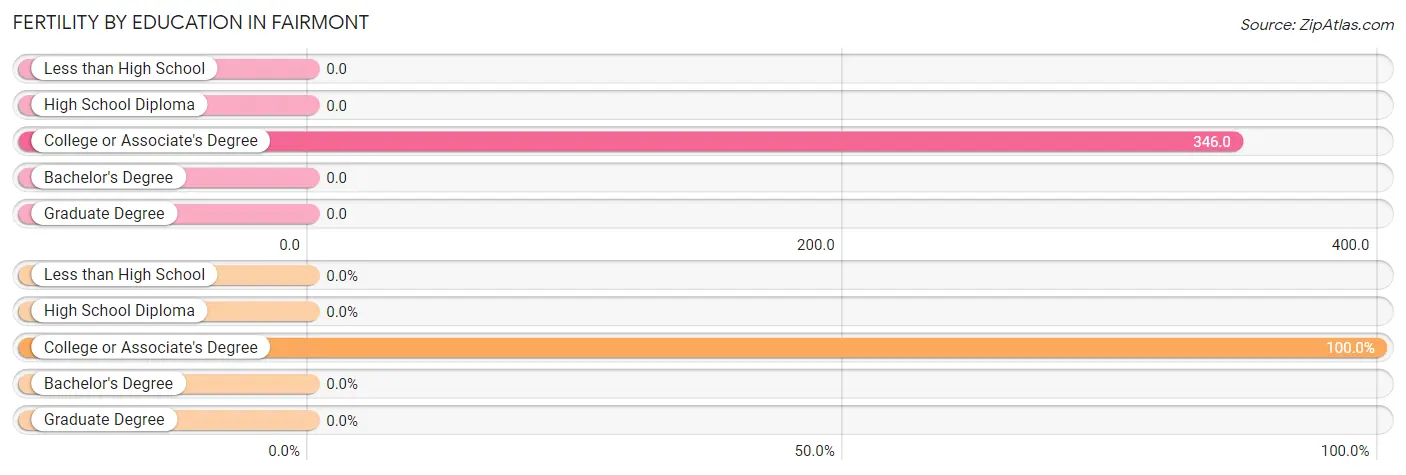
| Educational Attainment | Women with Births | Births / 1,000 Women |
| Less than High School | 0 (0.0%) | 0.0 |
| High School Diploma | 0 (0.0%) | 0.0 |
| College or Associate's Degree | 9 (100.0%) | 346.0 |
| Bachelor's Degree | 0 (0.0%) | 0.0 |
| Graduate Degree | 0 (0.0%) | 0.0 |
| Total | 9 (100.0%) | 118.0 |
Fertility by Education by Marriage Status in Fairmont
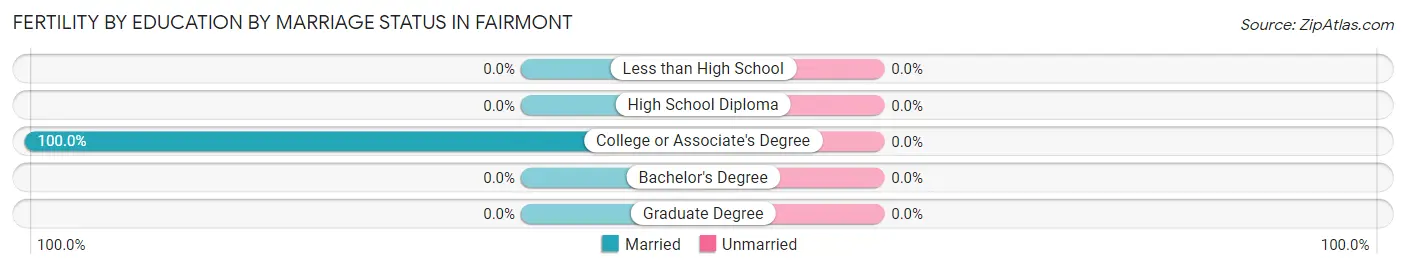
| Educational Attainment | Married | Unmarried |
| Less than High School | 0 (0.0%) | 0 (0.0%) |
| High School Diploma | 0 (0.0%) | 0 (0.0%) |
| College or Associate's Degree | 9 (100.0%) | 0 (0.0%) |
| Bachelor's Degree | 0 (0.0%) | 0 (0.0%) |
| Graduate Degree | 0 (0.0%) | 0 (0.0%) |
| Total | 9 (100.0%) | 0 (0.0%) |
Employment Characteristics in Fairmont
Employment by Class of Employer in Fairmont
Among the 230 employed individuals in Fairmont, private company employees (134 | 58.3%), not-for-profit organizations (31 | 13.5%), and self-employed (not incorporated) (28 | 12.2%) make up the most common classes of employment.
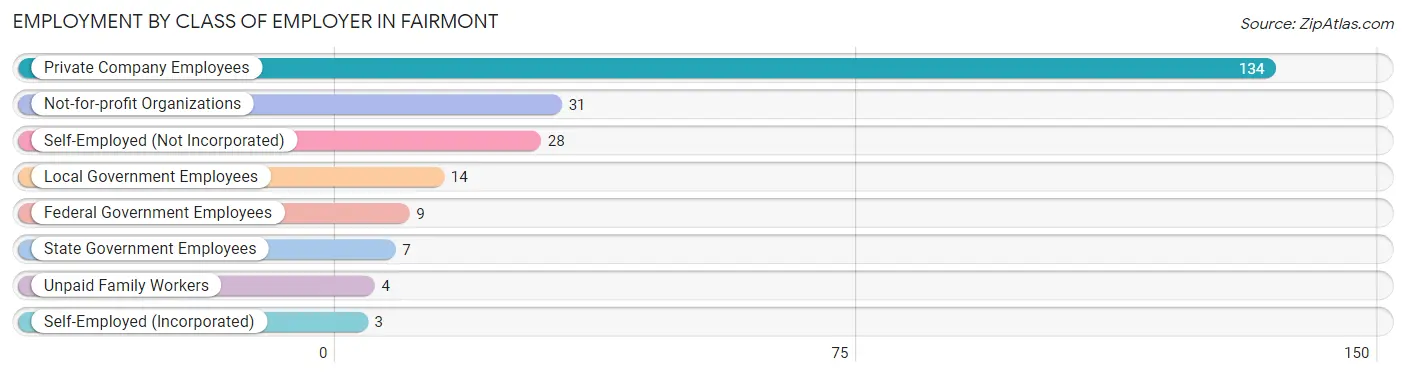
| Employer Class | # Employees | % Employees |
| Private Company Employees | 134 | 58.3% |
| Self-Employed (Incorporated) | 3 | 1.3% |
| Self-Employed (Not Incorporated) | 28 | 12.2% |
| Not-for-profit Organizations | 31 | 13.5% |
| Local Government Employees | 14 | 6.1% |
| State Government Employees | 7 | 3.0% |
| Federal Government Employees | 9 | 3.9% |
| Unpaid Family Workers | 4 | 1.7% |
| Total | 230 | 100.0% |
Employment Status by Age in Fairmont
According to the labor force statistics for Fairmont, out of the total population over 16 years of age (538), 45.4% or 244 individuals are in the labor force, with 3.3% or 8 of them unemployed. The age group with the highest labor force participation rate is 25 to 29 years, with 100.0% or 26 individuals in the labor force. Within the labor force, the 25 to 29 years age range has the highest percentage of unemployed individuals, with 30.8% or 8 of them being unemployed.
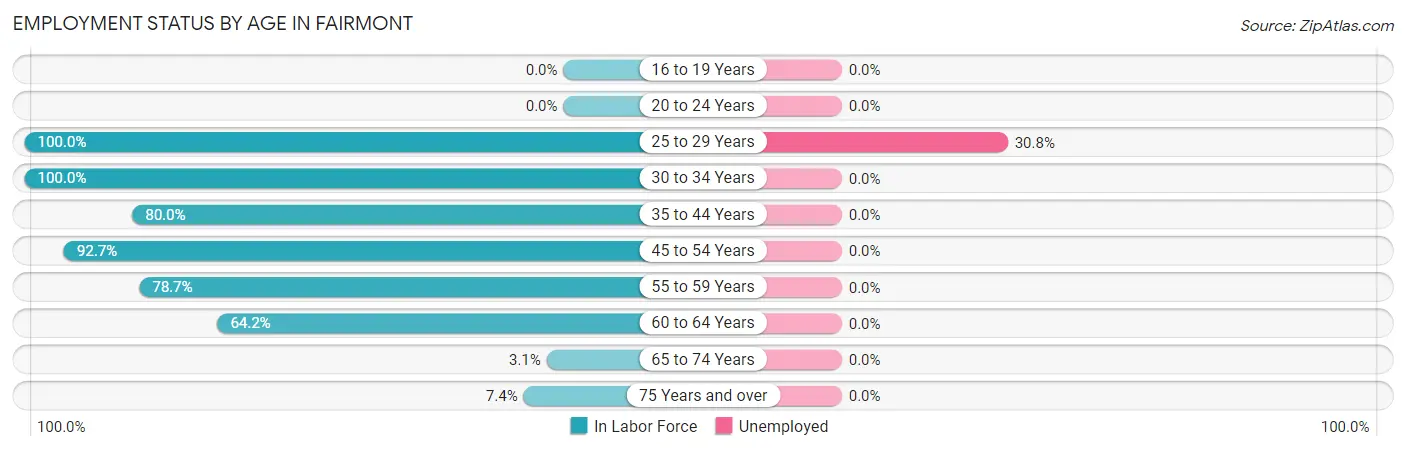
| Age Bracket | In Labor Force | Unemployed |
| 16 to 19 Years | 0 (0.0%) | 0 (0.0%) |
| 20 to 24 Years | 0 (0.0%) | 0 (0.0%) |
| 25 to 29 Years | 26 (100.0%) | 8 (30.8%) |
| 30 to 34 Years | 43 (100.0%) | 0 (0.0%) |
| 35 to 44 Years | 40 (80.0%) | 0 (0.0%) |
| 45 to 54 Years | 51 (92.7%) | 0 (0.0%) |
| 55 to 59 Years | 37 (78.7%) | 0 (0.0%) |
| 60 to 64 Years | 34 (64.2%) | 0 (0.0%) |
| 65 to 74 Years | 4 (3.1%) | 0 (0.0%) |
| 75 Years and over | 9 (7.4%) | 0 (0.0%) |
| Total | 244 (45.4%) | 8 (3.3%) |
Employment Status by Educational Attainment in Fairmont
According to labor force statistics for Fairmont, 84.3% of individuals (231) out of the total population between 25 and 64 years of age (274) are in the labor force, with 3.5% or 8 of them being unemployed. The group with the highest labor force participation rate are those with the educational attainment of college / associate degree, with 98.2% or 110 individuals in the labor force. Within the labor force, individuals with bachelor's degree or higher education have the highest percentage of unemployment, with 21.1% or 8 of them being unemployed.
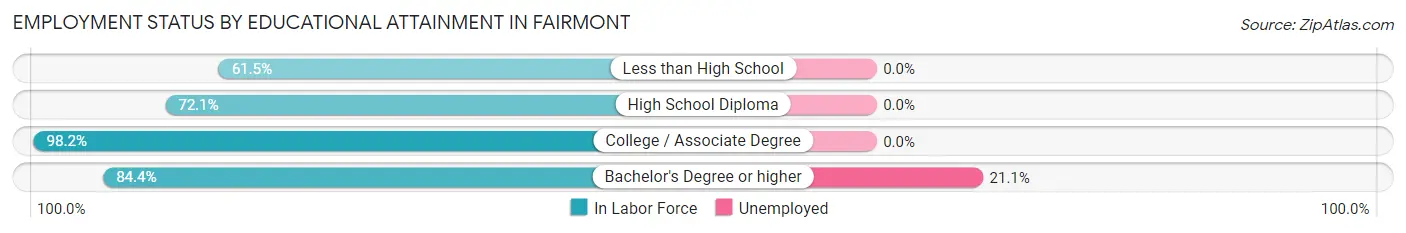
| Educational Attainment | In Labor Force | Unemployed |
| Less than High School | 8 (61.5%) | 0 (0.0%) |
| High School Diploma | 75 (72.1%) | 0 (0.0%) |
| College / Associate Degree | 110 (98.2%) | 0 (0.0%) |
| Bachelor's Degree or higher | 38 (84.4%) | 9 (21.1%) |
| Total | 231 (84.3%) | 10 (3.5%) |
Employment Occupations by Sex in Fairmont
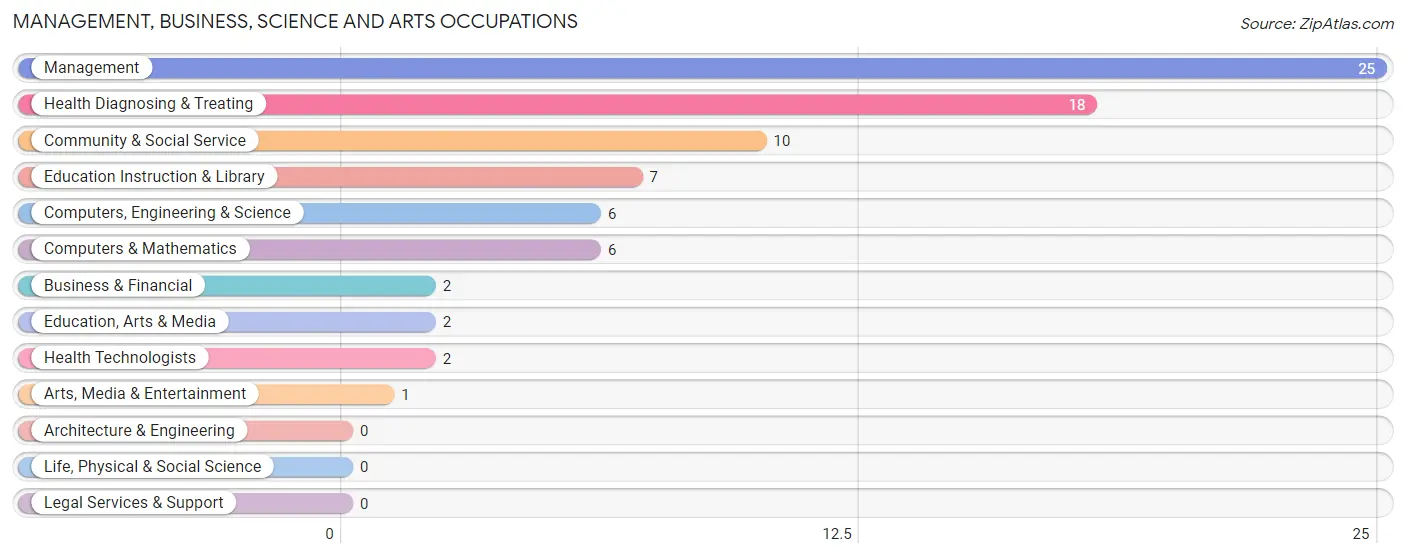
Management, Business, Science and Arts Occupations
The most common Management, Business, Science and Arts occupations in Fairmont are Management (25 | 10.6%), Health Diagnosing & Treating (18 | 7.6%), Community & Social Service (10 | 4.2%), Education Instruction & Library (7 | 3.0%), and Computers, Engineering & Science (6 | 2.5%).
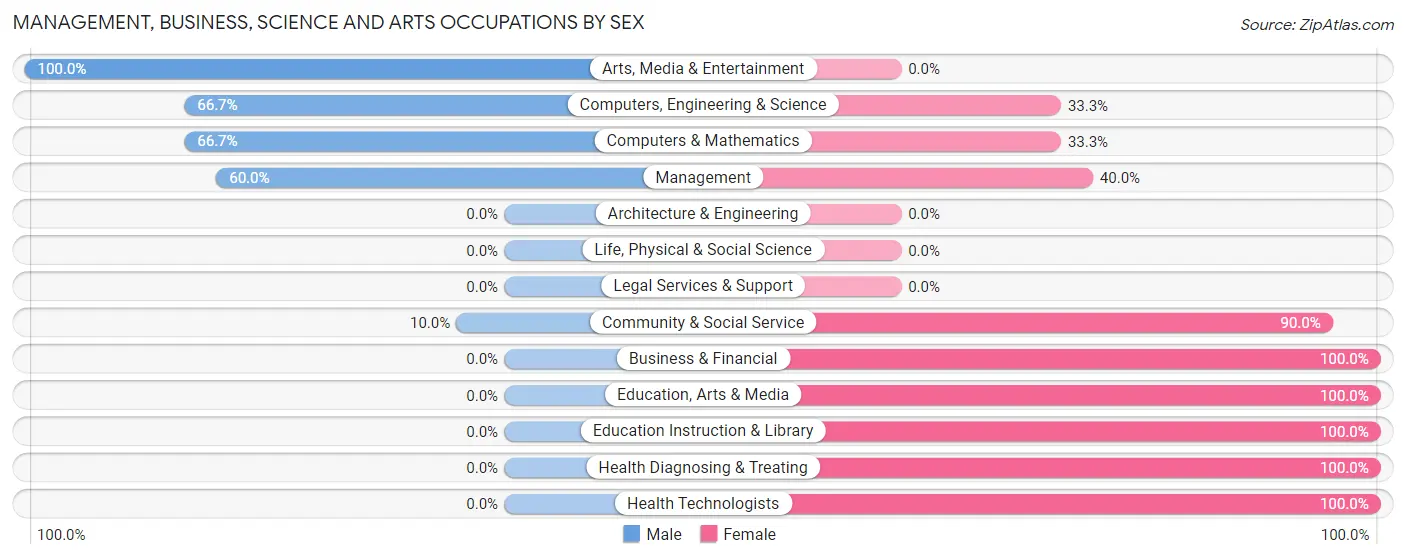
Management, Business, Science and Arts Occupations by Sex
Within the Management, Business, Science and Arts occupations in Fairmont, the most male-oriented occupations are Arts, Media & Entertainment (100.0%), Computers, Engineering & Science (66.7%), and Computers & Mathematics (66.7%), while the most female-oriented occupations are Business & Financial (100.0%), Education, Arts & Media (100.0%), and Education Instruction & Library (100.0%).
| Occupation | Male | Female |
| Management | 15 (60.0%) | 10 (40.0%) |
| Business & Financial | 0 (0.0%) | 2 (100.0%) |
| Computers, Engineering & Science | 4 (66.7%) | 2 (33.3%) |
| Computers & Mathematics | 4 (66.7%) | 2 (33.3%) |
| Architecture & Engineering | 0 (0.0%) | 0 (0.0%) |
| Life, Physical & Social Science | 0 (0.0%) | 0 (0.0%) |
| Community & Social Service | 1 (10.0%) | 9 (90.0%) |
| Education, Arts & Media | 0 (0.0%) | 2 (100.0%) |
| Legal Services & Support | 0 (0.0%) | 0 (0.0%) |
| Education Instruction & Library | 0 (0.0%) | 7 (100.0%) |
| Arts, Media & Entertainment | 1 (100.0%) | 0 (0.0%) |
| Health Diagnosing & Treating | 0 (0.0%) | 18 (100.0%) |
| Health Technologists | 0 (0.0%) | 2 (100.0%) |
| Total (Category) | 20 (32.8%) | 41 (67.2%) |
| Total (Overall) | 104 (44.1%) | 132 (55.9%) |
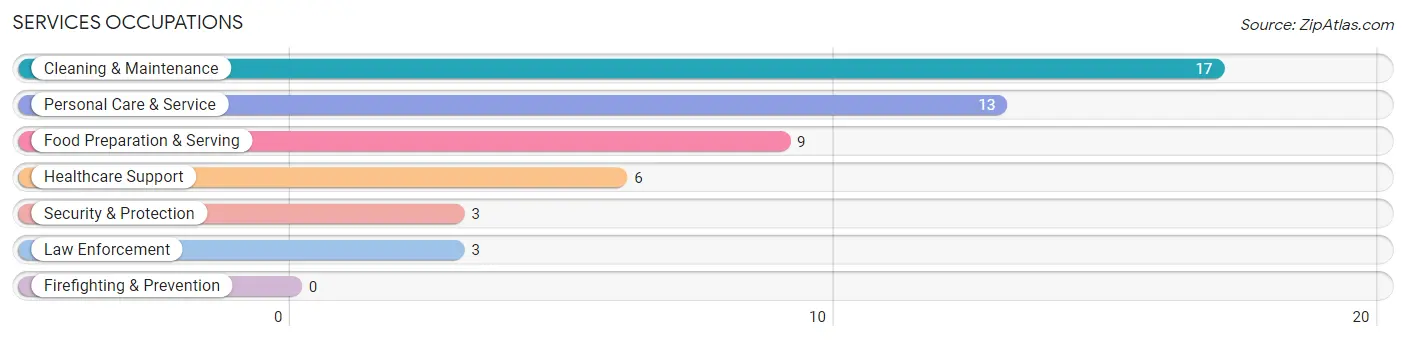
Services Occupations
The most common Services occupations in Fairmont are Cleaning & Maintenance (17 | 7.2%), Personal Care & Service (13 | 5.5%), Food Preparation & Serving (9 | 3.8%), Healthcare Support (6 | 2.5%), and Security & Protection (3 | 1.3%).
Services Occupations by Sex
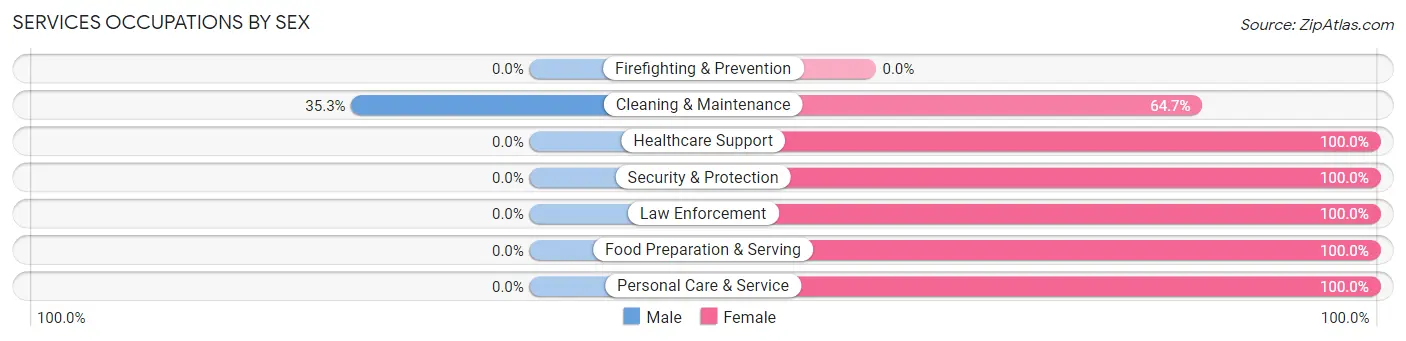
| Occupation | Male | Female |
| Healthcare Support | 0 (0.0%) | 6 (100.0%) |
| Security & Protection | 0 (0.0%) | 3 (100.0%) |
| Firefighting & Prevention | 0 (0.0%) | 0 (0.0%) |
| Law Enforcement | 0 (0.0%) | 3 (100.0%) |
| Food Preparation & Serving | 0 (0.0%) | 9 (100.0%) |
| Cleaning & Maintenance | 6 (35.3%) | 11 (64.7%) |
| Personal Care & Service | 0 (0.0%) | 13 (100.0%) |
| Total (Category) | 6 (12.5%) | 42 (87.5%) |
| Total (Overall) | 104 (44.1%) | 132 (55.9%) |
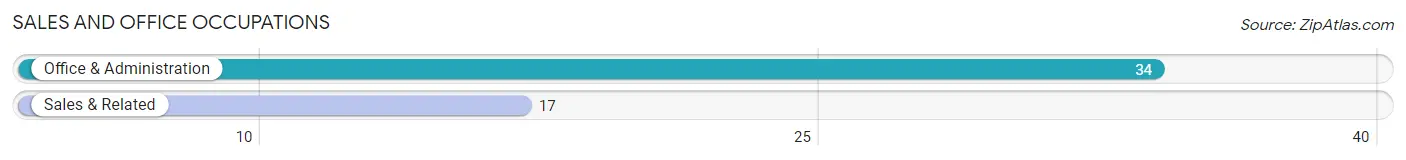
Sales and Office Occupations
The most common Sales and Office occupations in Fairmont are Office & Administration (34 | 14.4%), and Sales & Related (17 | 7.2%).
Sales and Office Occupations by Sex
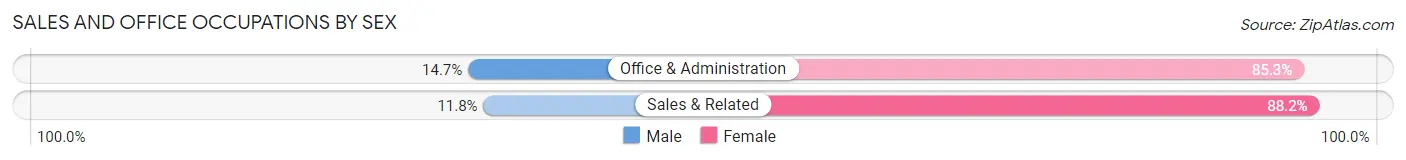
| Occupation | Male | Female |
| Sales & Related | 2 (11.8%) | 15 (88.2%) |
| Office & Administration | 5 (14.7%) | 29 (85.3%) |
| Total (Category) | 7 (13.7%) | 44 (86.3%) |
| Total (Overall) | 104 (44.1%) | 132 (55.9%) |
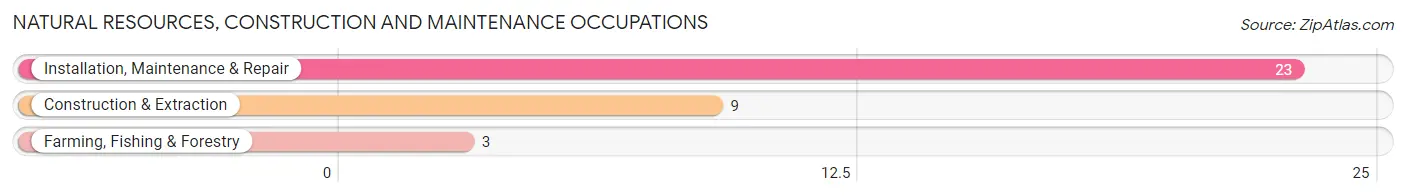
Natural Resources, Construction and Maintenance Occupations
The most common Natural Resources, Construction and Maintenance occupations in Fairmont are Installation, Maintenance & Repair (23 | 9.8%), Construction & Extraction (9 | 3.8%), and Farming, Fishing & Forestry (3 | 1.3%).
Natural Resources, Construction and Maintenance Occupations by Sex
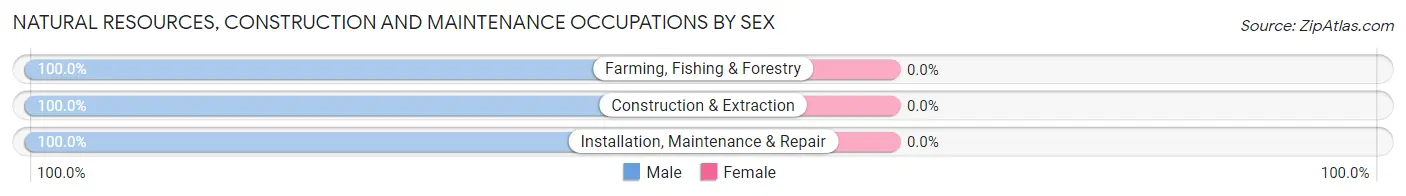
| Occupation | Male | Female |
| Farming, Fishing & Forestry | 3 (100.0%) | 0 (0.0%) |
| Construction & Extraction | 9 (100.0%) | 0 (0.0%) |
| Installation, Maintenance & Repair | 23 (100.0%) | 0 (0.0%) |
| Total (Category) | 35 (100.0%) | 0 (0.0%) |
| Total (Overall) | 104 (44.1%) | 132 (55.9%) |
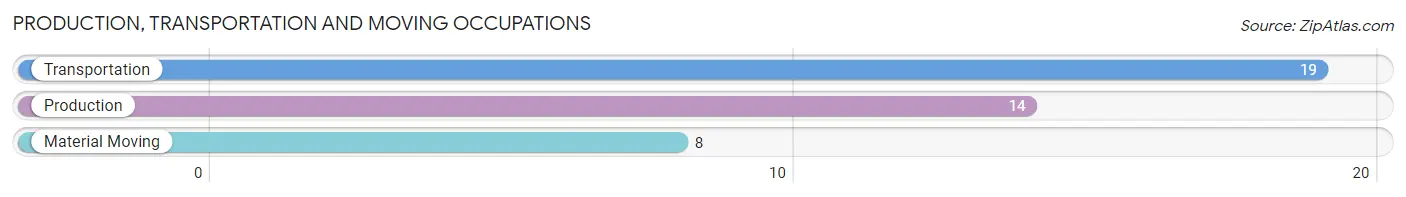
Production, Transportation and Moving Occupations
The most common Production, Transportation and Moving occupations in Fairmont are Transportation (19 | 8.1%), Production (14 | 5.9%), and Material Moving (8 | 3.4%).
Production, Transportation and Moving Occupations by Sex
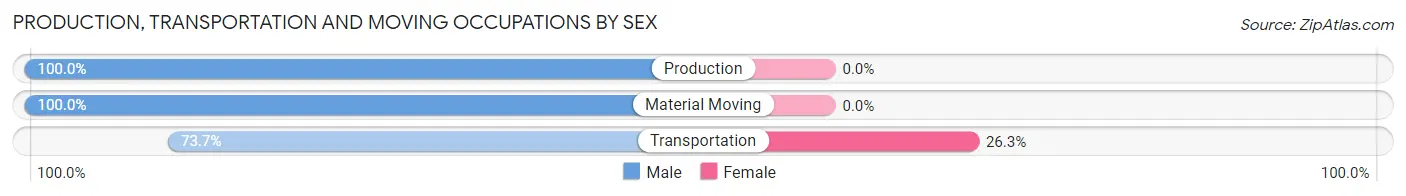
| Occupation | Male | Female |
| Production | 14 (100.0%) | 0 (0.0%) |
| Transportation | 14 (73.7%) | 5 (26.3%) |
| Material Moving | 8 (100.0%) | 0 (0.0%) |
| Total (Category) | 36 (87.8%) | 5 (12.2%) |
| Total (Overall) | 104 (44.1%) | 132 (55.9%) |
Employment Industries by Sex in Fairmont
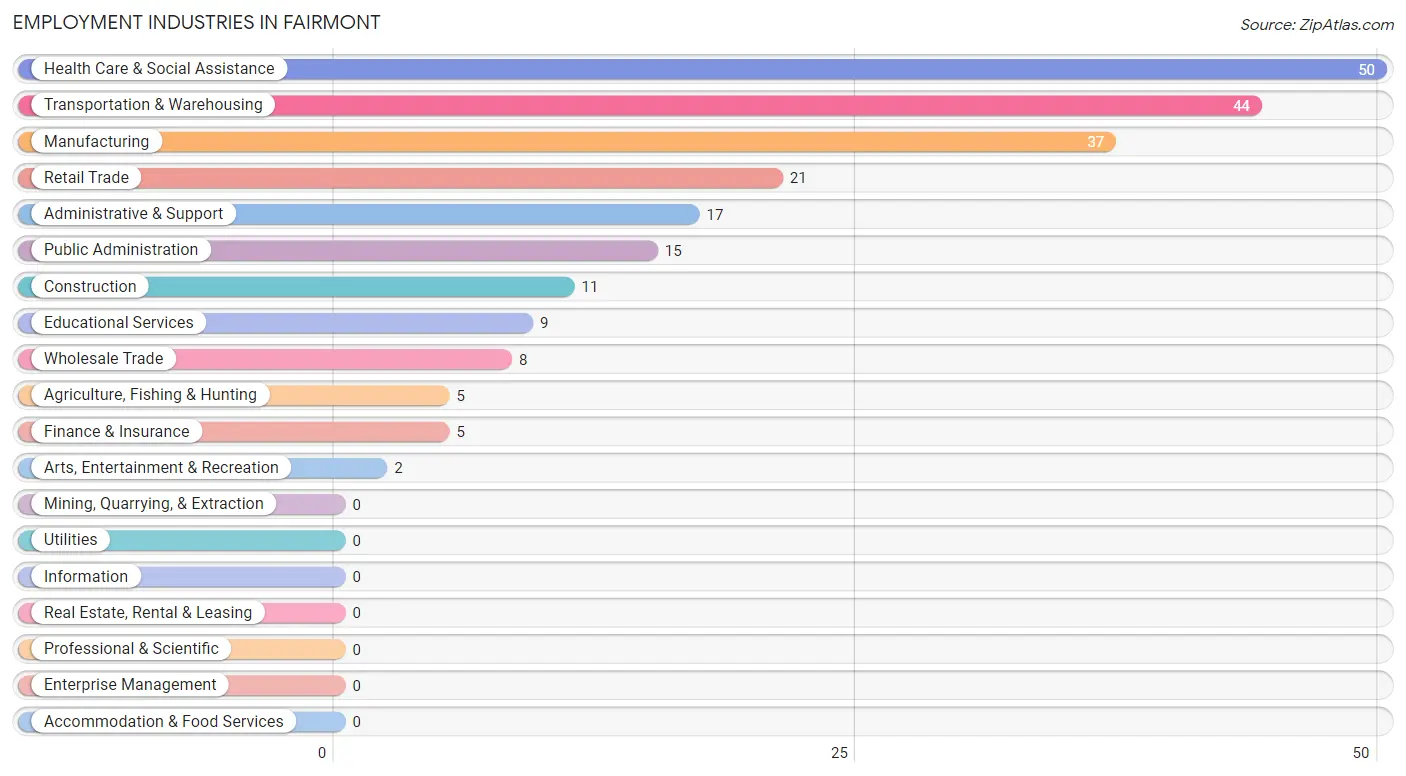
Employment Industries in Fairmont
The major employment industries in Fairmont include Health Care & Social Assistance (50 | 21.2%), Transportation & Warehousing (44 | 18.6%), Manufacturing (37 | 15.7%), Retail Trade (21 | 8.9%), and Administrative & Support (17 | 7.2%).
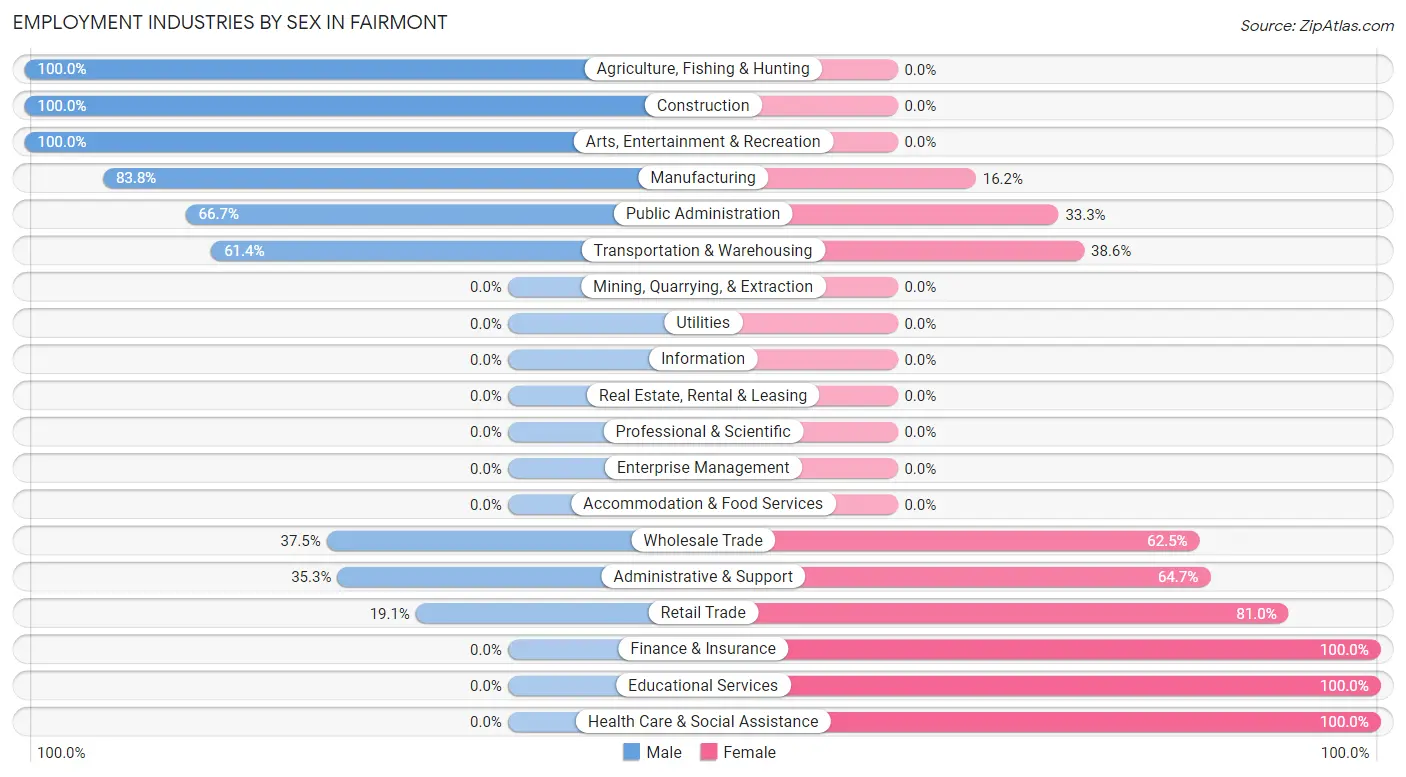
Employment Industries by Sex in Fairmont
The Fairmont industries that see more men than women are Agriculture, Fishing & Hunting (100.0%), Construction (100.0%), and Arts, Entertainment & Recreation (100.0%), whereas the industries that tend to have a higher number of women are Finance & Insurance (100.0%), Educational Services (100.0%), and Health Care & Social Assistance (100.0%).
| Industry | Male | Female |
| Agriculture, Fishing & Hunting | 5 (100.0%) | 0 (0.0%) |
| Mining, Quarrying, & Extraction | 0 (0.0%) | 0 (0.0%) |
| Construction | 11 (100.0%) | 0 (0.0%) |
| Manufacturing | 31 (83.8%) | 6 (16.2%) |
| Wholesale Trade | 3 (37.5%) | 5 (62.5%) |
| Retail Trade | 4 (19.1%) | 17 (80.9%) |
| Transportation & Warehousing | 27 (61.4%) | 17 (38.6%) |
| Utilities | 0 (0.0%) | 0 (0.0%) |
| Information | 0 (0.0%) | 0 (0.0%) |
| Finance & Insurance | 0 (0.0%) | 5 (100.0%) |
| Real Estate, Rental & Leasing | 0 (0.0%) | 0 (0.0%) |
| Professional & Scientific | 0 (0.0%) | 0 (0.0%) |
| Enterprise Management | 0 (0.0%) | 0 (0.0%) |
| Administrative & Support | 6 (35.3%) | 11 (64.7%) |
| Educational Services | 0 (0.0%) | 9 (100.0%) |
| Health Care & Social Assistance | 0 (0.0%) | 50 (100.0%) |
| Arts, Entertainment & Recreation | 2 (100.0%) | 0 (0.0%) |
| Accommodation & Food Services | 0 (0.0%) | 0 (0.0%) |
| Public Administration | 10 (66.7%) | 5 (33.3%) |
| Total | 104 (44.1%) | 132 (55.9%) |
Education in Fairmont
School Enrollment in Fairmont
The most common levels of schooling among the 65 students in Fairmont are high school (27 | 41.5%), middle school (15 | 23.1%), and kindergarten (11 | 16.9%).
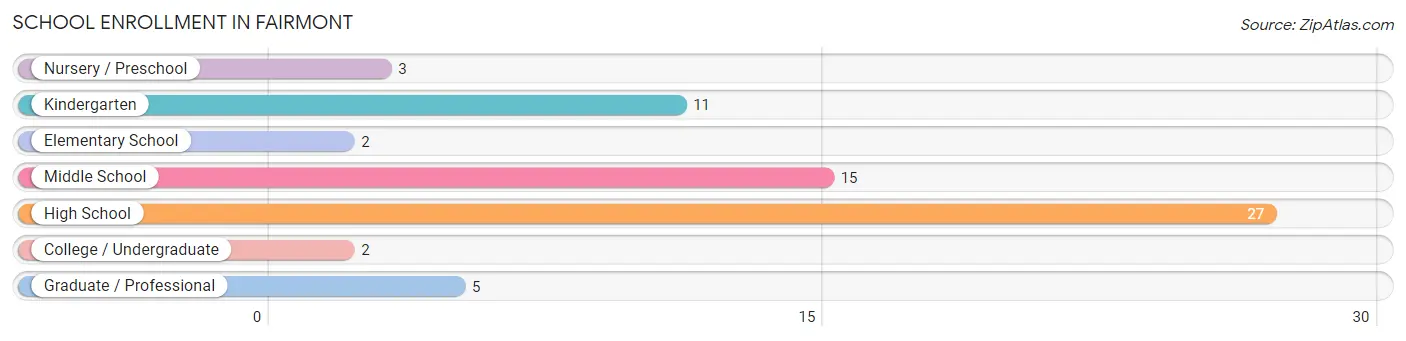
| School Level | # Students | % Students |
| Nursery / Preschool | 3 | 4.6% |
| Kindergarten | 11 | 16.9% |
| Elementary School | 2 | 3.1% |
| Middle School | 15 | 23.1% |
| High School | 27 | 41.5% |
| College / Undergraduate | 2 | 3.1% |
| Graduate / Professional | 5 | 7.7% |
| Total | 65 | 100.0% |
School Enrollment by Age by Funding Source in Fairmont
Out of a total of 65 students who are enrolled in schools in Fairmont, 1 (1.5%) attend a private institution, while the remaining 64 (98.5%) are enrolled in public schools. The age group of 10 to 14 year olds has the highest likelihood of being enrolled in private schools, with 1 (4.2% in the age bracket) enrolled. Conversely, the age group of 3 to 4 year olds has the lowest likelihood of being enrolled in a private school, with 3 (100.0% in the age bracket) attending a public institution.
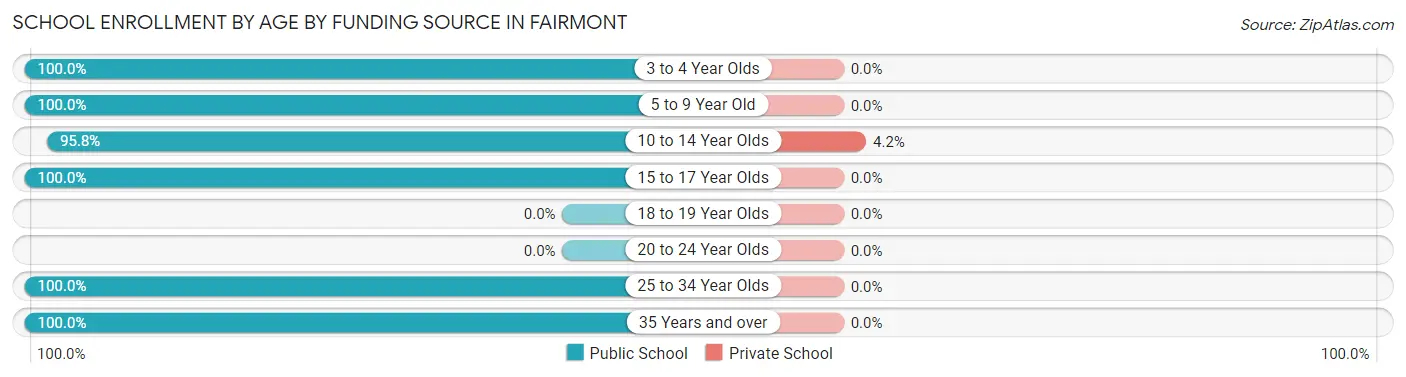
| Age Bracket | Public School | Private School |
| 3 to 4 Year Olds | 3 (100.0%) | 0 (0.0%) |
| 5 to 9 Year Old | 13 (100.0%) | 0 (0.0%) |
| 10 to 14 Year Olds | 23 (95.8%) | 1 (4.2%) |
| 15 to 17 Year Olds | 18 (100.0%) | 0 (0.0%) |
| 18 to 19 Year Olds | 0 (0.0%) | 0 (0.0%) |
| 20 to 24 Year Olds | 0 (0.0%) | 0 (0.0%) |
| 25 to 34 Year Olds | 1 (100.0%) | 0 (0.0%) |
| 35 Years and over | 6 (100.0%) | 0 (0.0%) |
| Total | 64 (98.5%) | 1 (1.5%) |
Educational Attainment by Field of Study in Fairmont
Education (27 | 42.2%), visual & performing arts (8 | 12.5%), science & technology (6 | 9.4%), bio, nature & agricultural (4 | 6.2%), and psychology (4 | 6.2%) are the most common fields of study among 64 individuals in Fairmont who have obtained a bachelor's degree or higher.
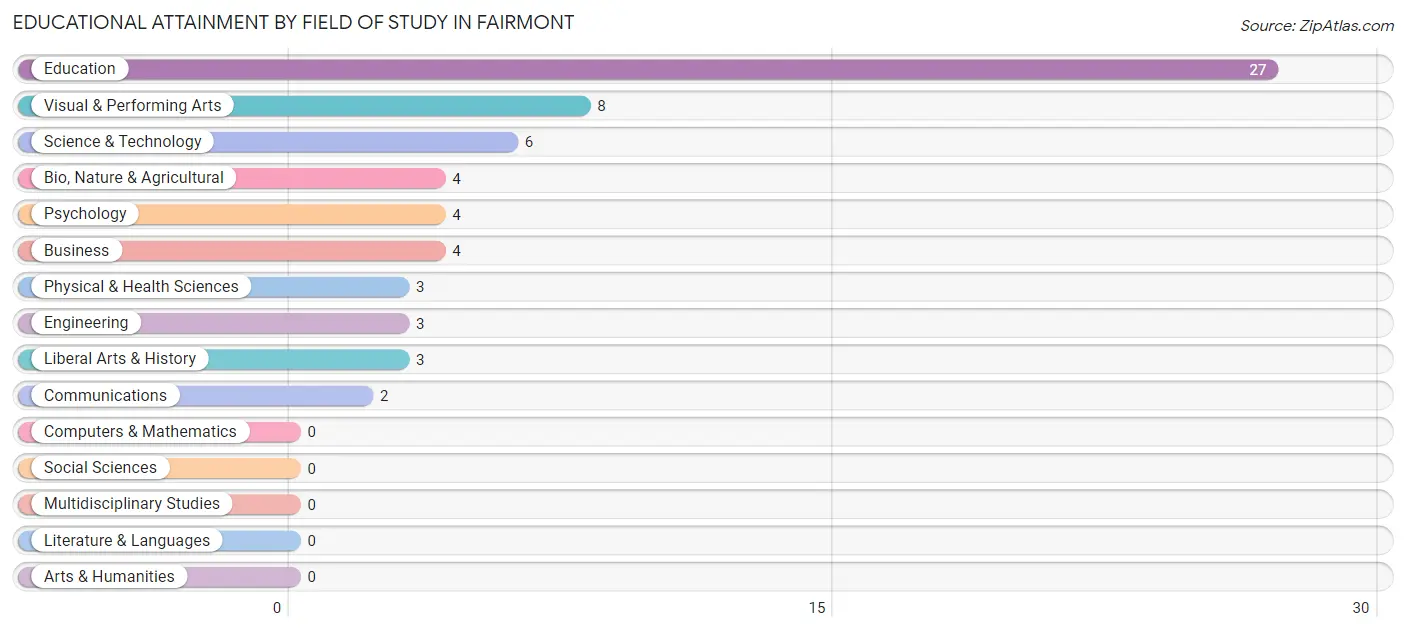
| Field of Study | # Graduates | % Graduates |
| Computers & Mathematics | 0 | 0.0% |
| Bio, Nature & Agricultural | 4 | 6.2% |
| Physical & Health Sciences | 3 | 4.7% |
| Psychology | 4 | 6.2% |
| Social Sciences | 0 | 0.0% |
| Engineering | 3 | 4.7% |
| Multidisciplinary Studies | 0 | 0.0% |
| Science & Technology | 6 | 9.4% |
| Business | 4 | 6.2% |
| Education | 27 | 42.2% |
| Literature & Languages | 0 | 0.0% |
| Liberal Arts & History | 3 | 4.7% |
| Visual & Performing Arts | 8 | 12.5% |
| Communications | 2 | 3.1% |
| Arts & Humanities | 0 | 0.0% |
| Total | 64 | 100.0% |
Transportation & Commute in Fairmont
Vehicle Availability by Sex in Fairmont
The most prevalent vehicle ownership categories in Fairmont are males with 2 vehicles (49, accounting for 50.0%) and females with 2 vehicles (58, making up 37.1%).
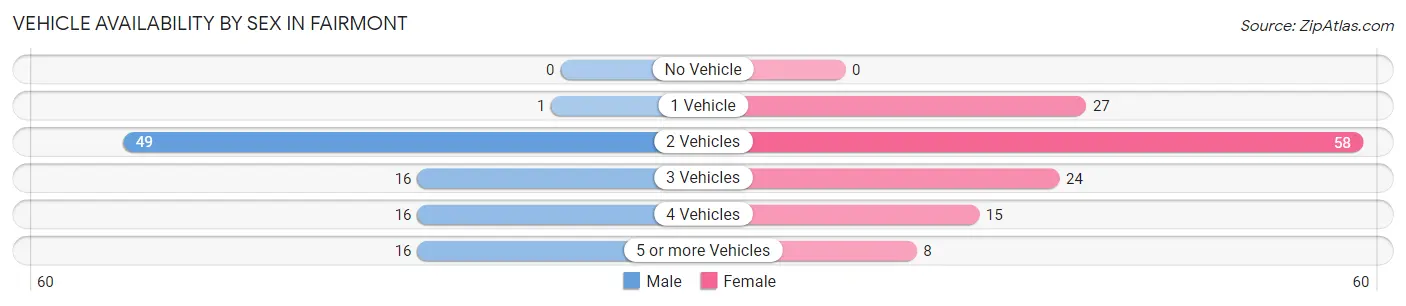
| Vehicles Available | Male | Female |
| No Vehicle | 0 (0.0%) | 0 (0.0%) |
| 1 Vehicle | 1 (1.0%) | 27 (20.4%) |
| 2 Vehicles | 49 (50.0%) | 58 (43.9%) |
| 3 Vehicles | 16 (16.3%) | 24 (18.2%) |
| 4 Vehicles | 16 (16.3%) | 15 (11.4%) |
| 5 or more Vehicles | 16 (16.3%) | 8 (6.1%) |
| Total | 98 (100.0%) | 132 (100.0%) |
Commute Time in Fairmont
The most frequently occuring commute durations in Fairmont are 10 to 14 minutes (53 commuters, 25.0%), 5 to 9 minutes (43 commuters, 20.3%), and less than 5 minutes (31 commuters, 14.6%).
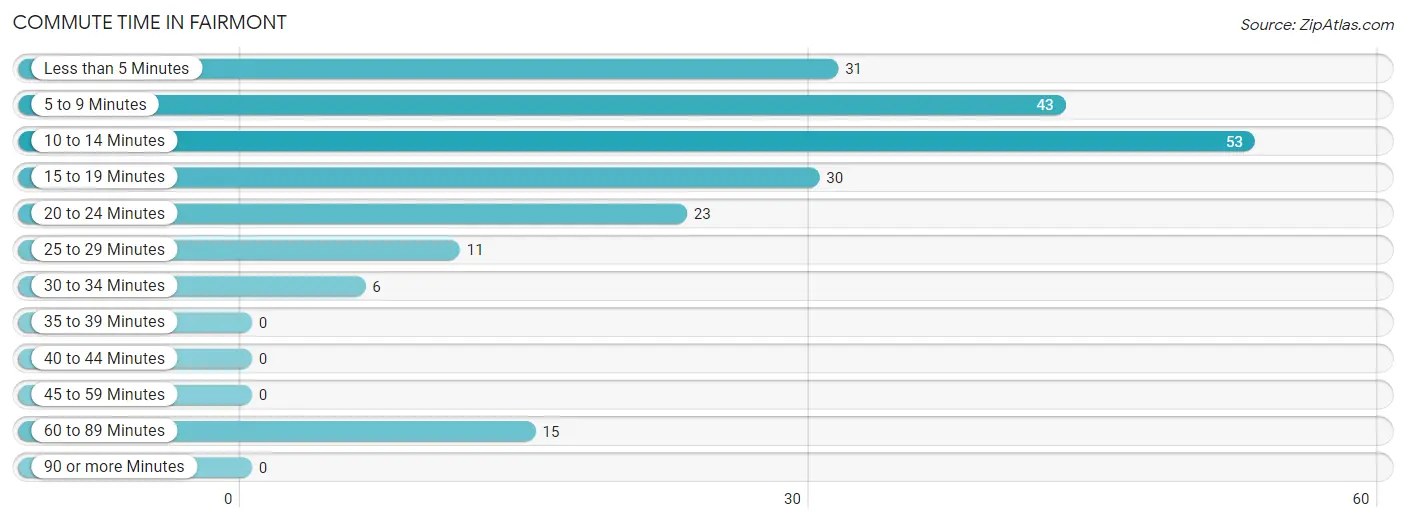
| Commute Time | # Commuters | % Commuters |
| Less than 5 Minutes | 31 | 14.6% |
| 5 to 9 Minutes | 43 | 20.3% |
| 10 to 14 Minutes | 53 | 25.0% |
| 15 to 19 Minutes | 30 | 14.1% |
| 20 to 24 Minutes | 23 | 10.8% |
| 25 to 29 Minutes | 11 | 5.2% |
| 30 to 34 Minutes | 6 | 2.8% |
| 35 to 39 Minutes | 0 | 0.0% |
| 40 to 44 Minutes | 0 | 0.0% |
| 45 to 59 Minutes | 0 | 0.0% |
| 60 to 89 Minutes | 15 | 7.1% |
| 90 or more Minutes | 0 | 0.0% |
Commute Time by Sex in Fairmont
The most common commute times in Fairmont are 10 to 14 minutes (40 commuters, 43.5%) for males and 15 to 19 minutes (25 commuters, 20.8%) for females.
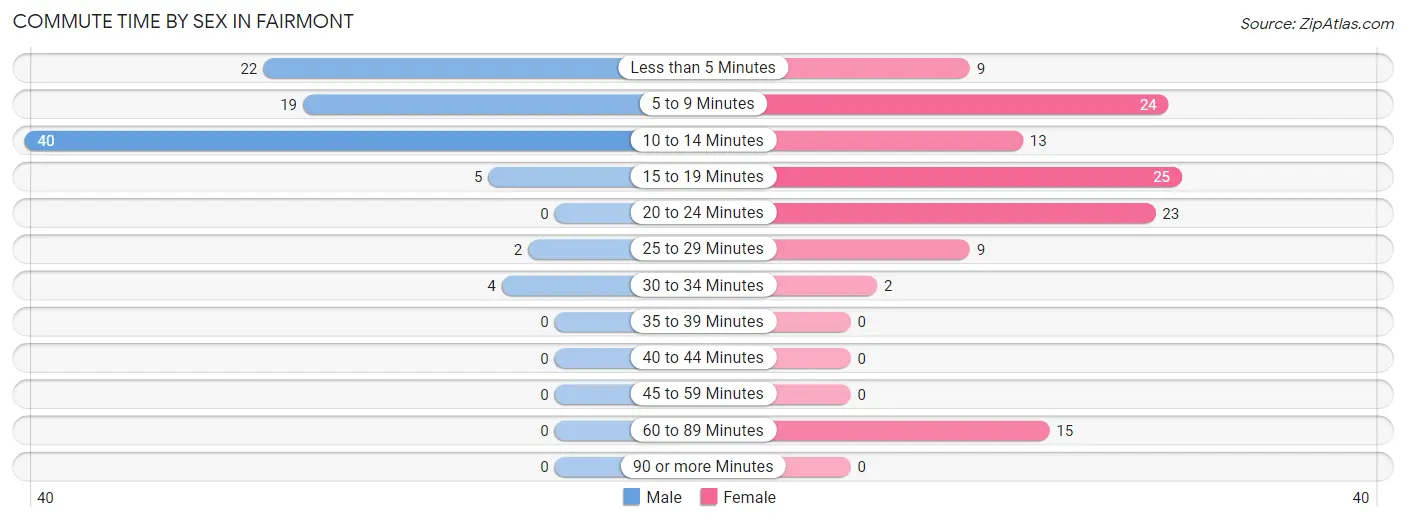
| Commute Time | Male | Female |
| Less than 5 Minutes | 22 (23.9%) | 9 (7.5%) |
| 5 to 9 Minutes | 19 (20.6%) | 24 (20.0%) |
| 10 to 14 Minutes | 40 (43.5%) | 13 (10.8%) |
| 15 to 19 Minutes | 5 (5.4%) | 25 (20.8%) |
| 20 to 24 Minutes | 0 (0.0%) | 23 (19.2%) |
| 25 to 29 Minutes | 2 (2.2%) | 9 (7.5%) |
| 30 to 34 Minutes | 4 (4.3%) | 2 (1.7%) |
| 35 to 39 Minutes | 0 (0.0%) | 0 (0.0%) |
| 40 to 44 Minutes | 0 (0.0%) | 0 (0.0%) |
| 45 to 59 Minutes | 0 (0.0%) | 0 (0.0%) |
| 60 to 89 Minutes | 0 (0.0%) | 15 (12.5%) |
| 90 or more Minutes | 0 (0.0%) | 0 (0.0%) |
Time of Departure to Work by Sex in Fairmont
The most frequent times of departure to work in Fairmont are 7:30 AM to 7:59 AM (35, 38.0%) for males and 7:30 AM to 7:59 AM (36, 30.0%) for females.
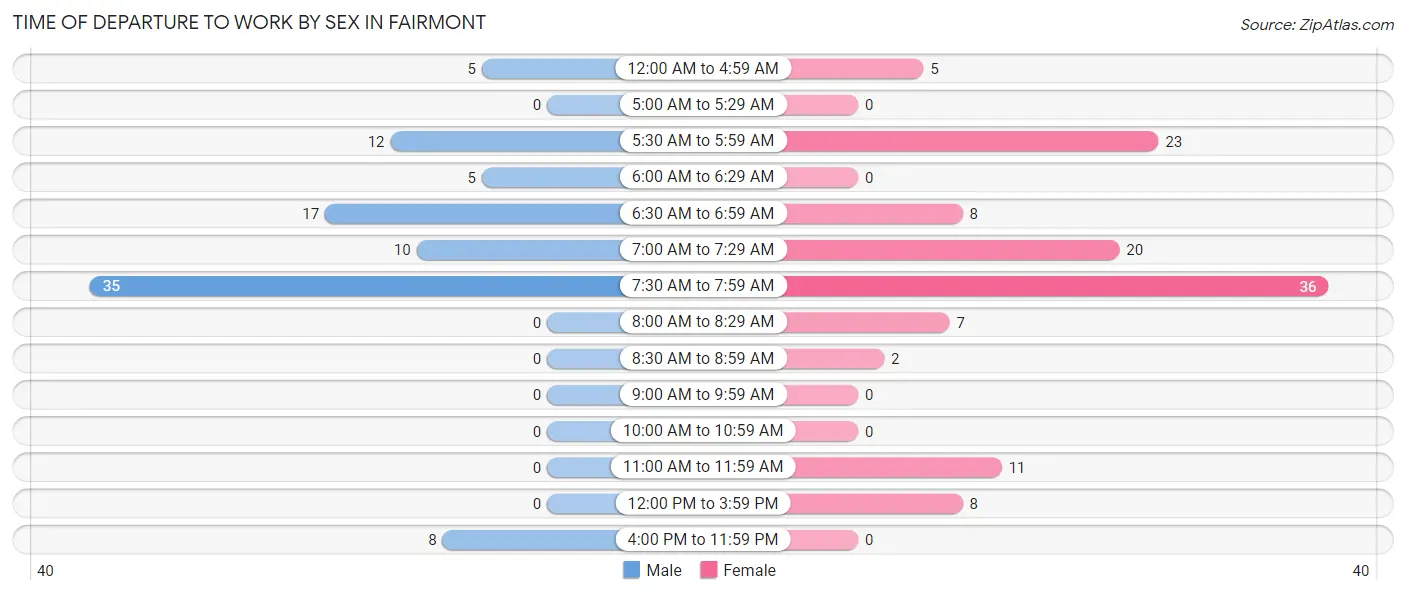
| Time of Departure | Male | Female |
| 12:00 AM to 4:59 AM | 5 (5.4%) | 5 (4.2%) |
| 5:00 AM to 5:29 AM | 0 (0.0%) | 0 (0.0%) |
| 5:30 AM to 5:59 AM | 12 (13.0%) | 23 (19.2%) |
| 6:00 AM to 6:29 AM | 5 (5.4%) | 0 (0.0%) |
| 6:30 AM to 6:59 AM | 17 (18.5%) | 8 (6.7%) |
| 7:00 AM to 7:29 AM | 10 (10.9%) | 20 (16.7%) |
| 7:30 AM to 7:59 AM | 35 (38.0%) | 36 (30.0%) |
| 8:00 AM to 8:29 AM | 0 (0.0%) | 7 (5.8%) |
| 8:30 AM to 8:59 AM | 0 (0.0%) | 2 (1.7%) |
| 9:00 AM to 9:59 AM | 0 (0.0%) | 0 (0.0%) |
| 10:00 AM to 10:59 AM | 0 (0.0%) | 0 (0.0%) |
| 11:00 AM to 11:59 AM | 0 (0.0%) | 11 (9.2%) |
| 12:00 PM to 3:59 PM | 0 (0.0%) | 8 (6.7%) |
| 4:00 PM to 11:59 PM | 8 (8.7%) | 0 (0.0%) |
| Total | 92 (100.0%) | 120 (100.0%) |
Housing Occupancy in Fairmont
Occupancy by Ownership in Fairmont
Of the total 297 dwellings in Fairmont, owner-occupied units account for 250 (84.2%), while renter-occupied units make up 47 (15.8%).
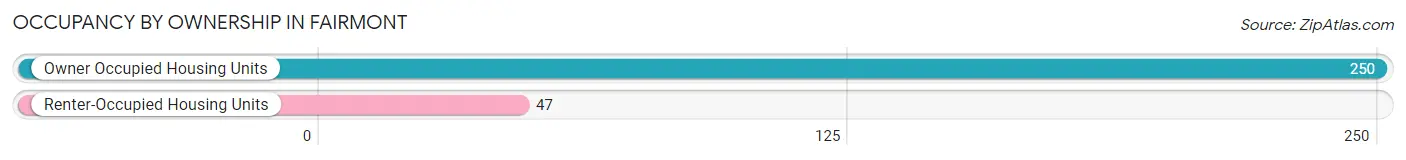
| Occupancy | # Housing Units | % Housing Units |
| Owner Occupied Housing Units | 250 | 84.2% |
| Renter-Occupied Housing Units | 47 | 15.8% |
| Total Occupied Housing Units | 297 | 100.0% |
Occupancy by Household Size in Fairmont
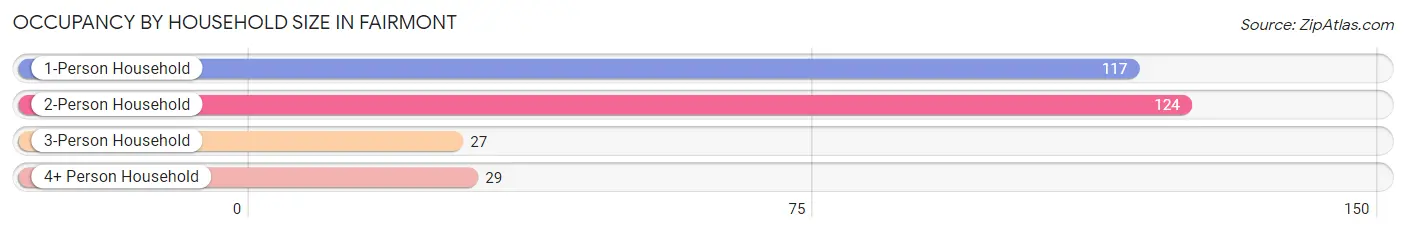
| Household Size | # Housing Units | % Housing Units |
| 1-Person Household | 117 | 39.4% |
| 2-Person Household | 124 | 41.7% |
| 3-Person Household | 27 | 9.1% |
| 4+ Person Household | 29 | 9.8% |
| Total Housing Units | 297 | 100.0% |
Occupancy by Ownership by Household Size in Fairmont
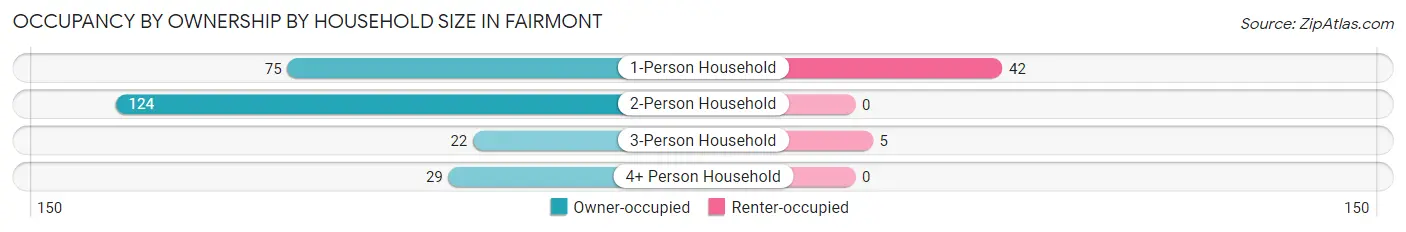
| Household Size | Owner-occupied | Renter-occupied |
| 1-Person Household | 75 (64.1%) | 42 (35.9%) |
| 2-Person Household | 124 (100.0%) | 0 (0.0%) |
| 3-Person Household | 22 (81.5%) | 5 (18.5%) |
| 4+ Person Household | 29 (100.0%) | 0 (0.0%) |
| Total Housing Units | 250 (84.2%) | 47 (15.8%) |
Occupancy by Educational Attainment in Fairmont
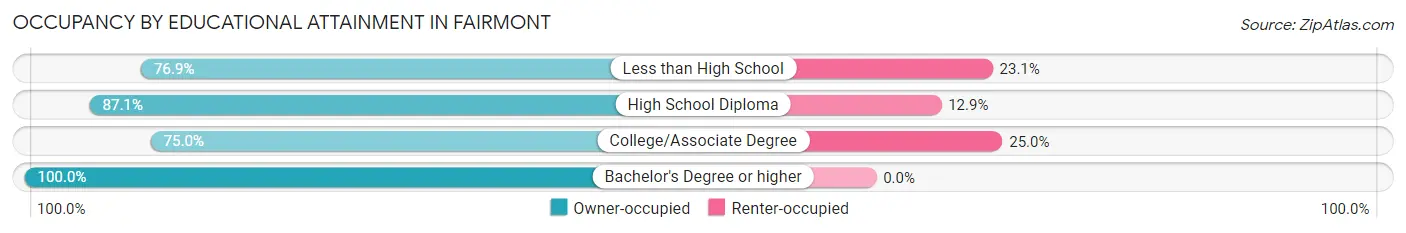
| Household Size | Owner-occupied | Renter-occupied |
| Less than High School | 10 (76.9%) | 3 (23.1%) |
| High School Diploma | 135 (87.1%) | 20 (12.9%) |
| College/Associate Degree | 72 (75.0%) | 24 (25.0%) |
| Bachelor's Degree or higher | 33 (100.0%) | 0 (0.0%) |
Occupancy by Age of Householder in Fairmont
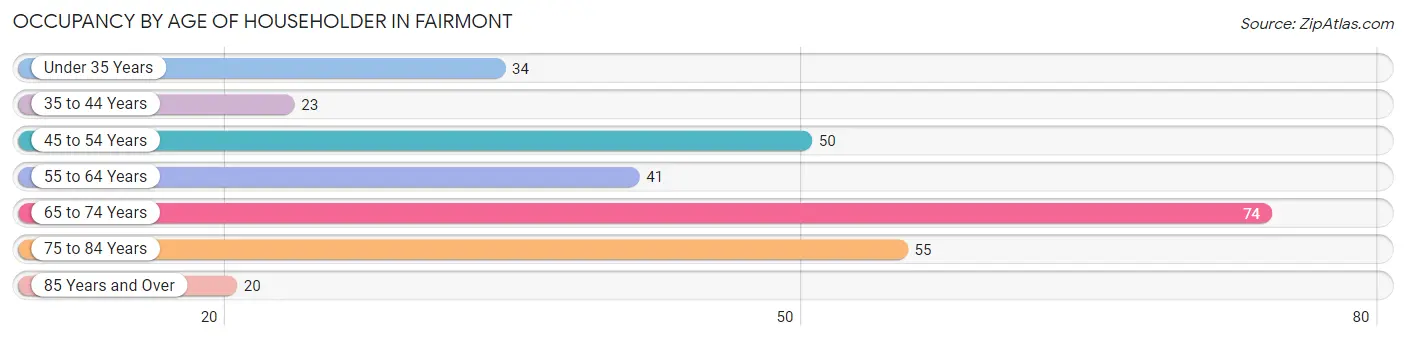
| Age Bracket | # Households | % Households |
| Under 35 Years | 34 | 11.5% |
| 35 to 44 Years | 23 | 7.7% |
| 45 to 54 Years | 50 | 16.8% |
| 55 to 64 Years | 41 | 13.8% |
| 65 to 74 Years | 74 | 24.9% |
| 75 to 84 Years | 55 | 18.5% |
| 85 Years and Over | 20 | 6.7% |
| Total | 297 | 100.0% |
Housing Finances in Fairmont
Median Income by Occupancy in Fairmont
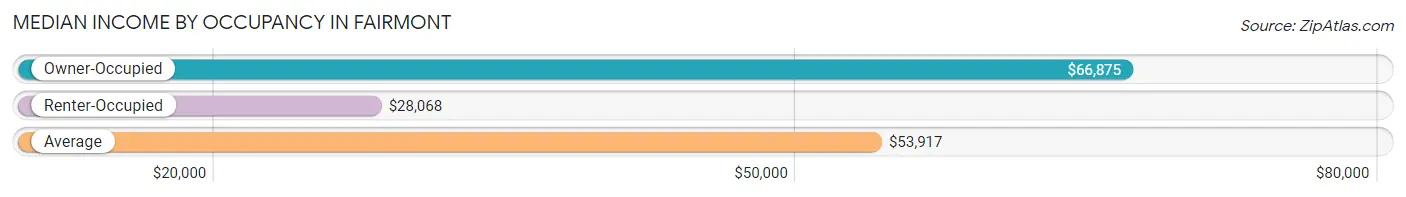
| Occupancy Type | # Households | Median Income |
| Owner-Occupied | 250 (84.2%) | $66,875 |
| Renter-Occupied | 47 (15.8%) | $28,068 |
| Average | 297 (100.0%) | $53,917 |
Occupancy by Householder Income Bracket in Fairmont
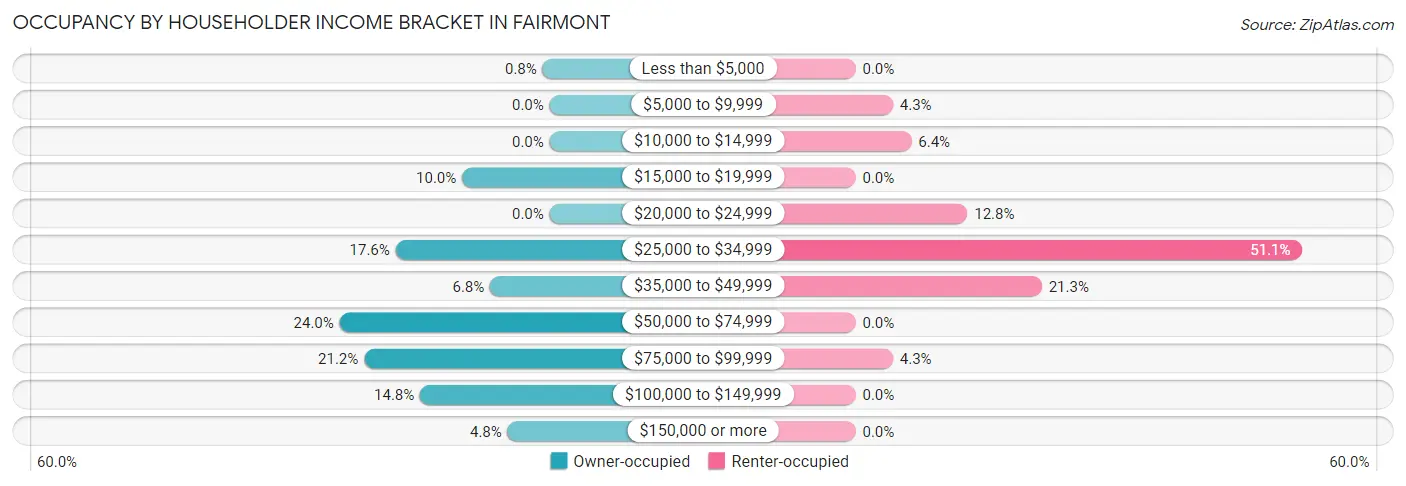
| Income Bracket | Owner-occupied | Renter-occupied |
| Less than $5,000 | 2 (0.8%) | 0 (0.0%) |
| $5,000 to $9,999 | 0 (0.0%) | 2 (4.3%) |
| $10,000 to $14,999 | 0 (0.0%) | 3 (6.4%) |
| $15,000 to $19,999 | 25 (10.0%) | 0 (0.0%) |
| $20,000 to $24,999 | 0 (0.0%) | 6 (12.8%) |
| $25,000 to $34,999 | 44 (17.6%) | 24 (51.1%) |
| $35,000 to $49,999 | 17 (6.8%) | 10 (21.3%) |
| $50,000 to $74,999 | 60 (24.0%) | 0 (0.0%) |
| $75,000 to $99,999 | 53 (21.2%) | 2 (4.3%) |
| $100,000 to $149,999 | 37 (14.8%) | 0 (0.0%) |
| $150,000 or more | 12 (4.8%) | 0 (0.0%) |
| Total | 250 (100.0%) | 47 (100.0%) |
Monthly Housing Cost Tiers in Fairmont
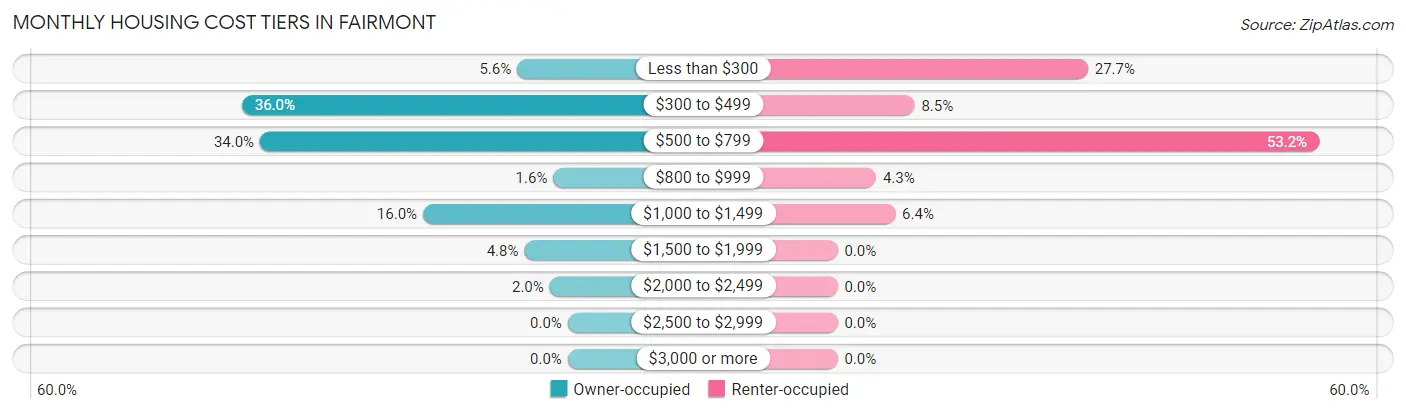
| Monthly Cost | Owner-occupied | Renter-occupied |
| Less than $300 | 14 (5.6%) | 13 (27.7%) |
| $300 to $499 | 90 (36.0%) | 4 (8.5%) |
| $500 to $799 | 85 (34.0%) | 25 (53.2%) |
| $800 to $999 | 4 (1.6%) | 2 (4.3%) |
| $1,000 to $1,499 | 40 (16.0%) | 3 (6.4%) |
| $1,500 to $1,999 | 12 (4.8%) | 0 (0.0%) |
| $2,000 to $2,499 | 5 (2.0%) | 0 (0.0%) |
| $2,500 to $2,999 | 0 (0.0%) | 0 (0.0%) |
| $3,000 or more | 0 (0.0%) | 0 (0.0%) |
| Total | 250 (100.0%) | 47 (100.0%) |
Physical Housing Characteristics in Fairmont
Housing Structures in Fairmont
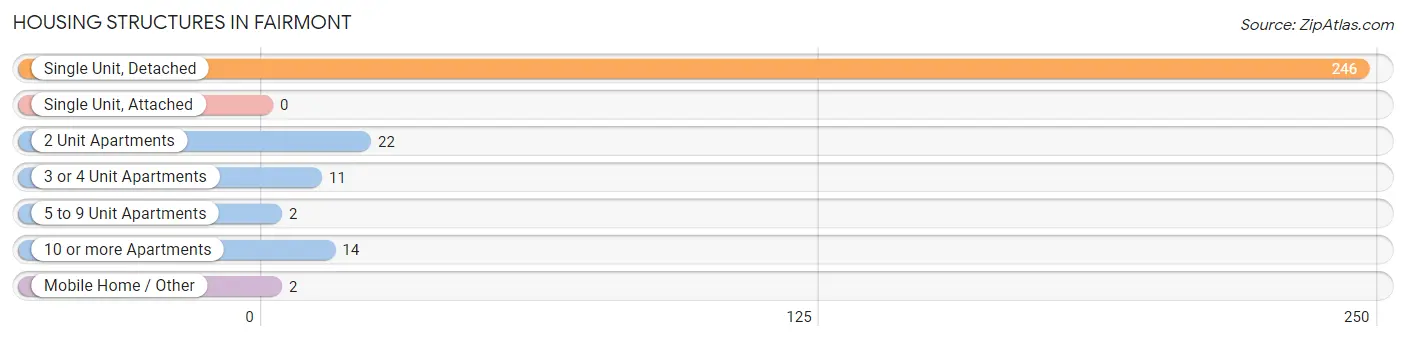
| Structure Type | # Housing Units | % Housing Units |
| Single Unit, Detached | 246 | 82.8% |
| Single Unit, Attached | 0 | 0.0% |
| 2 Unit Apartments | 22 | 7.4% |
| 3 or 4 Unit Apartments | 11 | 3.7% |
| 5 to 9 Unit Apartments | 2 | 0.7% |
| 10 or more Apartments | 14 | 4.7% |
| Mobile Home / Other | 2 | 0.7% |
| Total | 297 | 100.0% |
Housing Structures by Occupancy in Fairmont
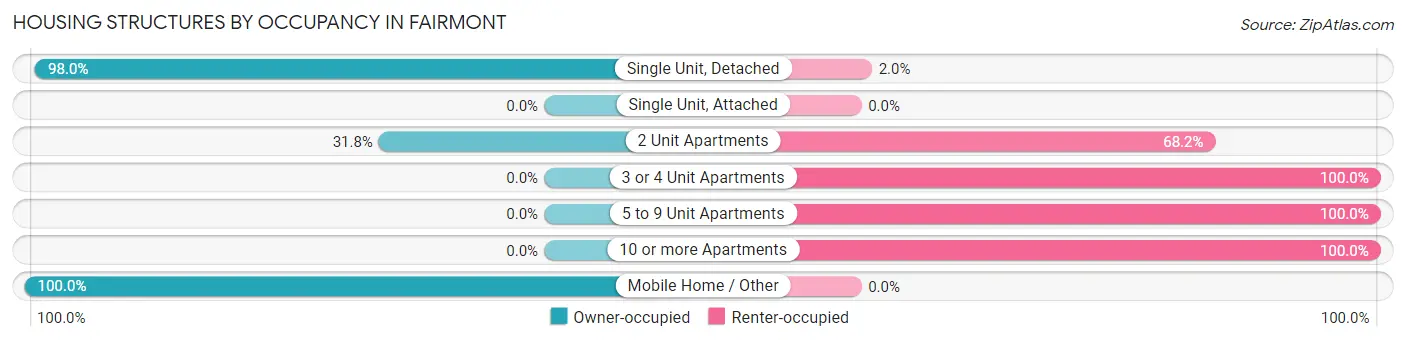
| Structure Type | Owner-occupied | Renter-occupied |
| Single Unit, Detached | 241 (98.0%) | 5 (2.0%) |
| Single Unit, Attached | 0 (0.0%) | 0 (0.0%) |
| 2 Unit Apartments | 7 (31.8%) | 15 (68.2%) |
| 3 or 4 Unit Apartments | 0 (0.0%) | 11 (100.0%) |
| 5 to 9 Unit Apartments | 0 (0.0%) | 2 (100.0%) |
| 10 or more Apartments | 0 (0.0%) | 14 (100.0%) |
| Mobile Home / Other | 2 (100.0%) | 0 (0.0%) |
| Total | 250 (84.2%) | 47 (15.8%) |
Housing Structures by Number of Rooms in Fairmont
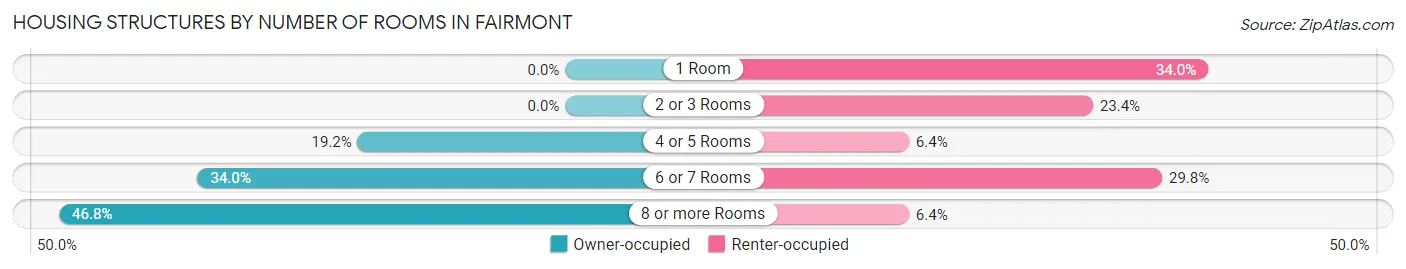
| Number of Rooms | Owner-occupied | Renter-occupied |
| 1 Room | 0 (0.0%) | 16 (34.0%) |
| 2 or 3 Rooms | 0 (0.0%) | 11 (23.4%) |
| 4 or 5 Rooms | 48 (19.2%) | 3 (6.4%) |
| 6 or 7 Rooms | 85 (34.0%) | 14 (29.8%) |
| 8 or more Rooms | 117 (46.8%) | 3 (6.4%) |
| Total | 250 (100.0%) | 47 (100.0%) |
Housing Structure by Heating Type in Fairmont
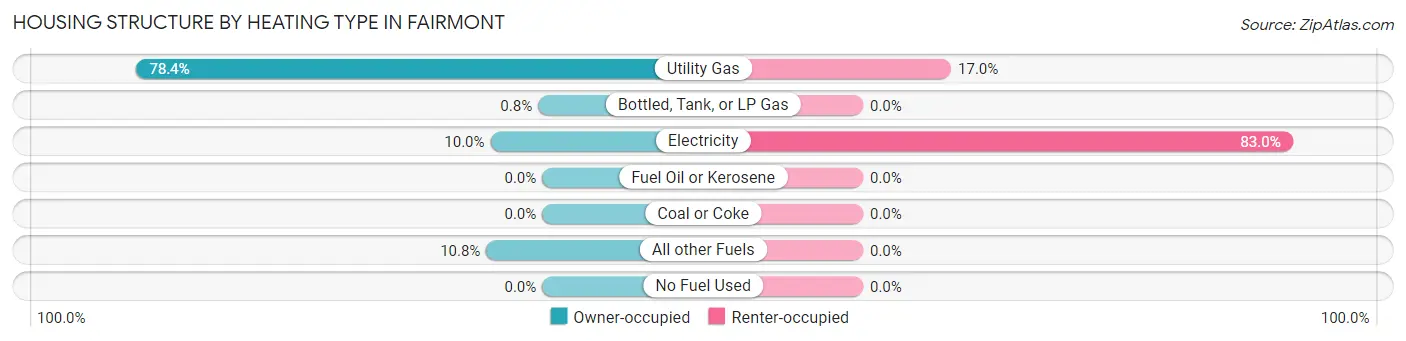
| Heating Type | Owner-occupied | Renter-occupied |
| Utility Gas | 196 (78.4%) | 8 (17.0%) |
| Bottled, Tank, or LP Gas | 2 (0.8%) | 0 (0.0%) |
| Electricity | 25 (10.0%) | 39 (83.0%) |
| Fuel Oil or Kerosene | 0 (0.0%) | 0 (0.0%) |
| Coal or Coke | 0 (0.0%) | 0 (0.0%) |
| All other Fuels | 27 (10.8%) | 0 (0.0%) |
| No Fuel Used | 0 (0.0%) | 0 (0.0%) |
| Total | 250 (100.0%) | 47 (100.0%) |
Household Vehicle Usage in Fairmont
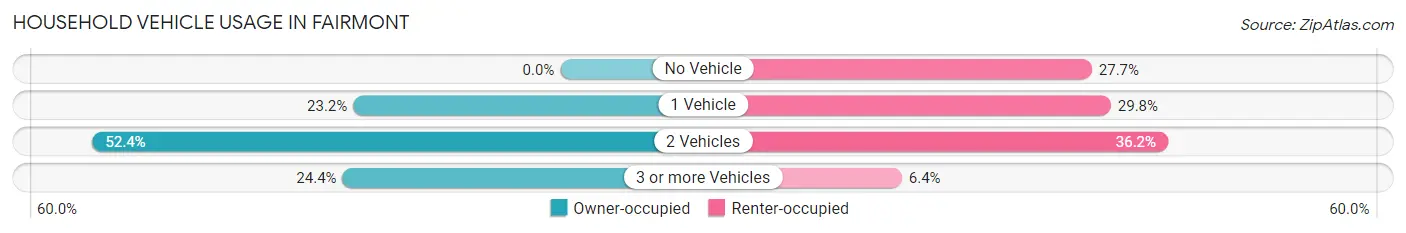
| Vehicles per Household | Owner-occupied | Renter-occupied |
| No Vehicle | 0 (0.0%) | 13 (27.7%) |
| 1 Vehicle | 58 (23.2%) | 14 (29.8%) |
| 2 Vehicles | 131 (52.4%) | 17 (36.2%) |
| 3 or more Vehicles | 61 (24.4%) | 3 (6.4%) |
| Total | 250 (100.0%) | 47 (100.0%) |
Real Estate & Mortgages in Fairmont
Real Estate and Mortgage Overview in Fairmont
| Characteristic | Without Mortgage | With Mortgage |
| Housing Units | 140 | 110 |
| Median Property Value | $56,000 | $107,300 |
| Median Household Income | $54,444 | $0 |
| Monthly Housing Costs | $414 | $0 |
| Real Estate Taxes | $1,023 | $0 |
Property Value by Mortgage Status in Fairmont
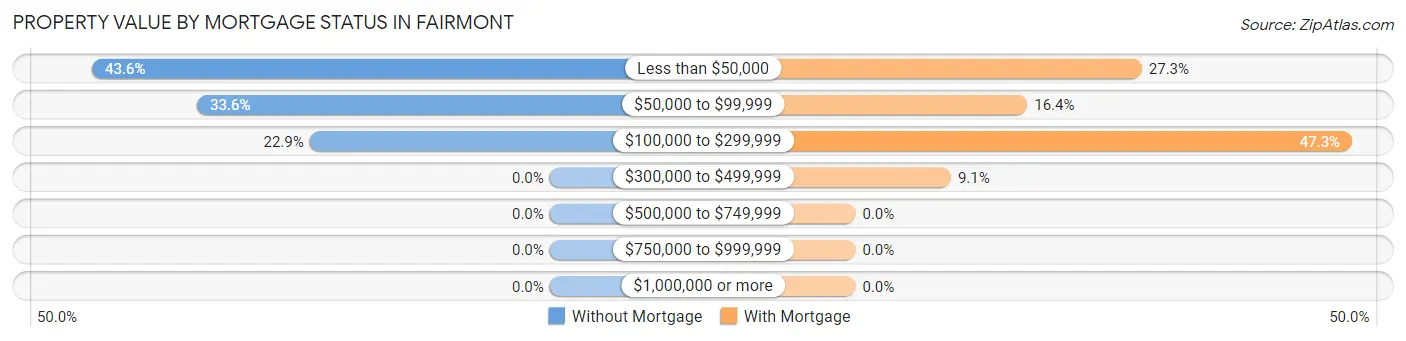
| Property Value | Without Mortgage | With Mortgage |
| Less than $50,000 | 61 (43.6%) | 30 (27.3%) |
| $50,000 to $99,999 | 47 (33.6%) | 18 (16.4%) |
| $100,000 to $299,999 | 32 (22.9%) | 52 (47.3%) |
| $300,000 to $499,999 | 0 (0.0%) | 10 (9.1%) |
| $500,000 to $749,999 | 0 (0.0%) | 0 (0.0%) |
| $750,000 to $999,999 | 0 (0.0%) | 0 (0.0%) |
| $1,000,000 or more | 0 (0.0%) | 0 (0.0%) |
| Total | 140 (100.0%) | 110 (100.0%) |
Household Income by Mortgage Status in Fairmont
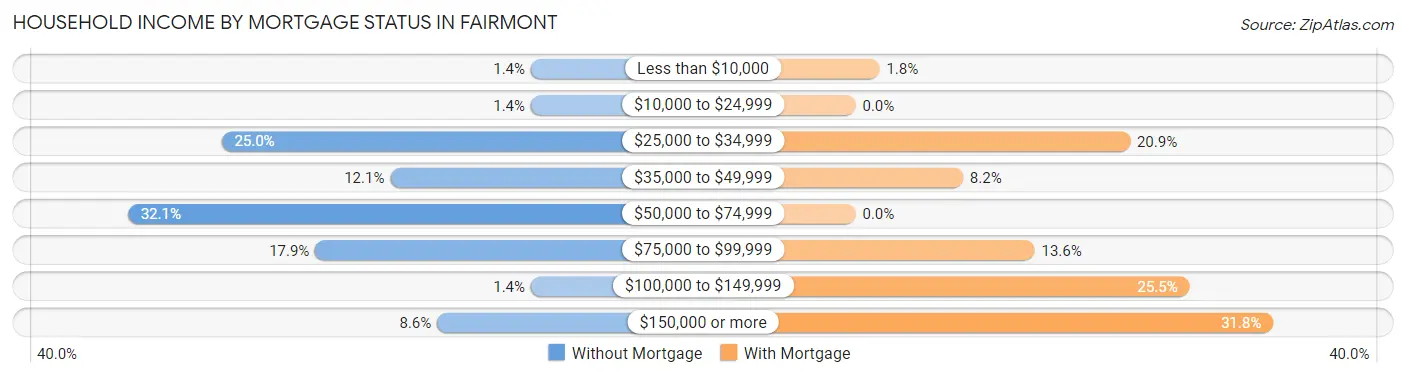
| Household Income | Without Mortgage | With Mortgage |
| Less than $10,000 | 2 (1.4%) | 2 (1.8%) |
| $10,000 to $24,999 | 2 (1.4%) | 0 (0.0%) |
| $25,000 to $34,999 | 35 (25.0%) | 23 (20.9%) |
| $35,000 to $49,999 | 17 (12.1%) | 9 (8.2%) |
| $50,000 to $74,999 | 45 (32.1%) | 0 (0.0%) |
| $75,000 to $99,999 | 25 (17.9%) | 15 (13.6%) |
| $100,000 to $149,999 | 2 (1.4%) | 28 (25.5%) |
| $150,000 or more | 12 (8.6%) | 35 (31.8%) |
| Total | 140 (100.0%) | 110 (100.0%) |
Property Value to Household Income Ratio in Fairmont
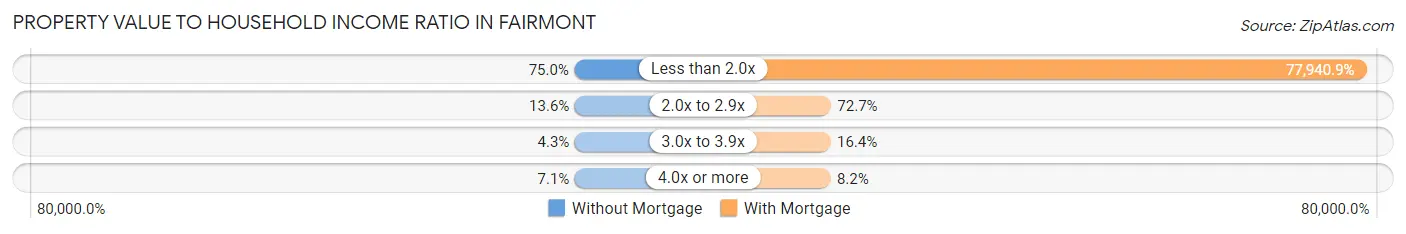
| Value-to-Income Ratio | Without Mortgage | With Mortgage |
| Less than 2.0x | 105 (75.0%) | 85,735 (77,940.9%) |
| 2.0x to 2.9x | 19 (13.6%) | 80 (72.7%) |
| 3.0x to 3.9x | 6 (4.3%) | 18 (16.4%) |
| 4.0x or more | 10 (7.1%) | 9 (8.2%) |
| Total | 140 (100.0%) | 110 (100.0%) |
Real Estate Taxes by Mortgage Status in Fairmont
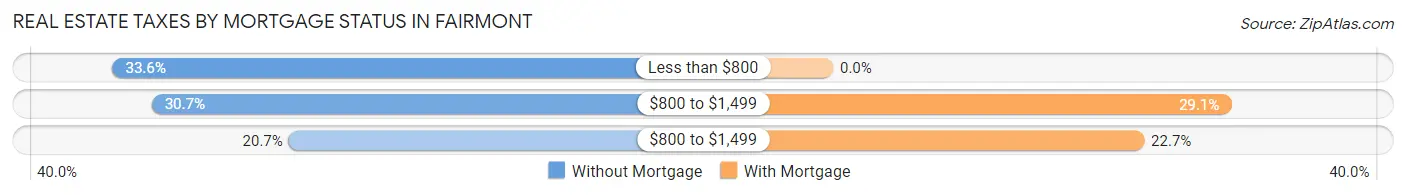
| Property Taxes | Without Mortgage | With Mortgage |
| Less than $800 | 47 (33.6%) | 0 (0.0%) |
| $800 to $1,499 | 43 (30.7%) | 32 (29.1%) |
| $800 to $1,499 | 29 (20.7%) | 25 (22.7%) |
| Total | 140 (100.0%) | 110 (100.0%) |
Health & Disability in Fairmont
Health Insurance Coverage by Age in Fairmont
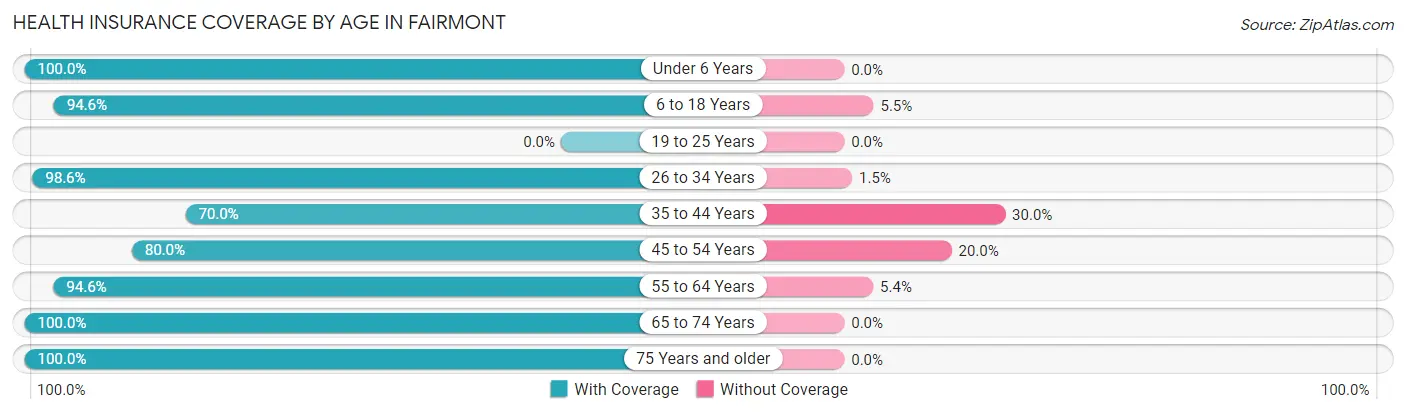
| Age Bracket | With Coverage | Without Coverage |
| Under 6 Years | 41 (100.0%) | 0 (0.0%) |
| 6 to 18 Years | 52 (94.6%) | 3 (5.4%) |
| 19 to 25 Years | 0 (0.0%) | 0 (0.0%) |
| 26 to 34 Years | 68 (98.6%) | 1 (1.5%) |
| 35 to 44 Years | 35 (70.0%) | 15 (30.0%) |
| 45 to 54 Years | 44 (80.0%) | 11 (20.0%) |
| 55 to 64 Years | 88 (94.6%) | 5 (5.4%) |
| 65 to 74 Years | 127 (100.0%) | 0 (0.0%) |
| 75 Years and older | 93 (100.0%) | 0 (0.0%) |
| Total | 548 (94.0%) | 35 (6.0%) |
Health Insurance Coverage by Citizenship Status in Fairmont
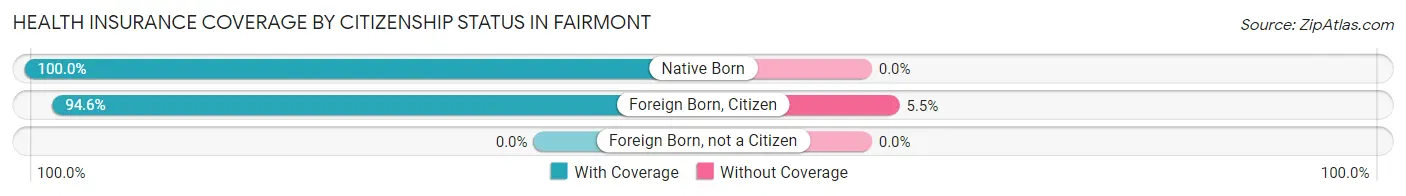
| Citizenship Status | With Coverage | Without Coverage |
| Native Born | 41 (100.0%) | 0 (0.0%) |
| Foreign Born, Citizen | 52 (94.6%) | 3 (5.4%) |
| Foreign Born, not a Citizen | 0 (0.0%) | 0 (0.0%) |
Health Insurance Coverage by Household Income in Fairmont
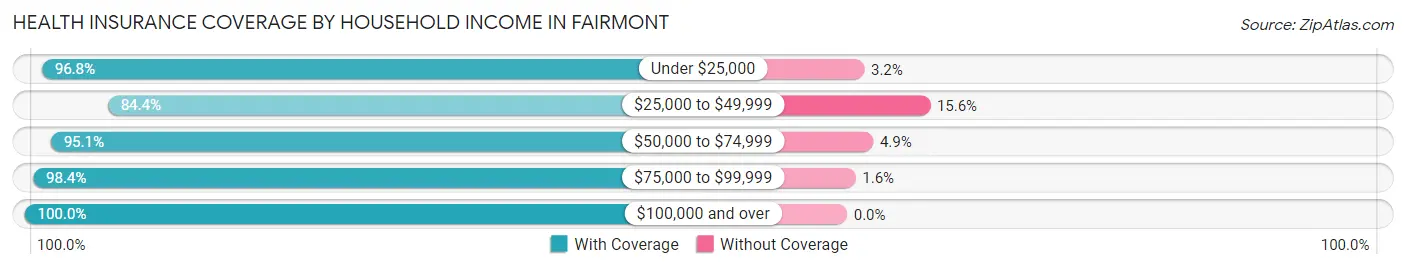
| Household Income | With Coverage | Without Coverage |
| Under $25,000 | 60 (96.8%) | 2 (3.2%) |
| $25,000 to $49,999 | 130 (84.4%) | 24 (15.6%) |
| $50,000 to $74,999 | 136 (95.1%) | 7 (4.9%) |
| $75,000 to $99,999 | 123 (98.4%) | 2 (1.6%) |
| $100,000 and over | 99 (100.0%) | 0 (0.0%) |
Public vs Private Health Insurance Coverage by Age in Fairmont
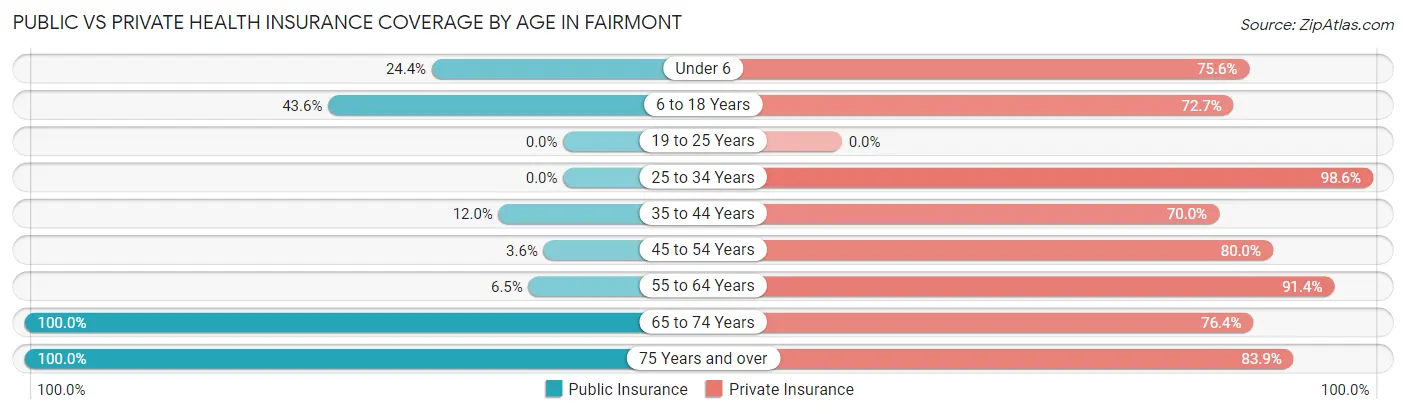
| Age Bracket | Public Insurance | Private Insurance |
| Under 6 | 10 (24.4%) | 31 (75.6%) |
| 6 to 18 Years | 24 (43.6%) | 40 (72.7%) |
| 19 to 25 Years | 0 (0.0%) | 0 (0.0%) |
| 25 to 34 Years | 0 (0.0%) | 68 (98.6%) |
| 35 to 44 Years | 6 (12.0%) | 35 (70.0%) |
| 45 to 54 Years | 2 (3.6%) | 44 (80.0%) |
| 55 to 64 Years | 6 (6.5%) | 85 (91.4%) |
| 65 to 74 Years | 127 (100.0%) | 97 (76.4%) |
| 75 Years and over | 93 (100.0%) | 78 (83.9%) |
| Total | 268 (46.0%) | 478 (82.0%) |
Disability Status by Sex by Age in Fairmont
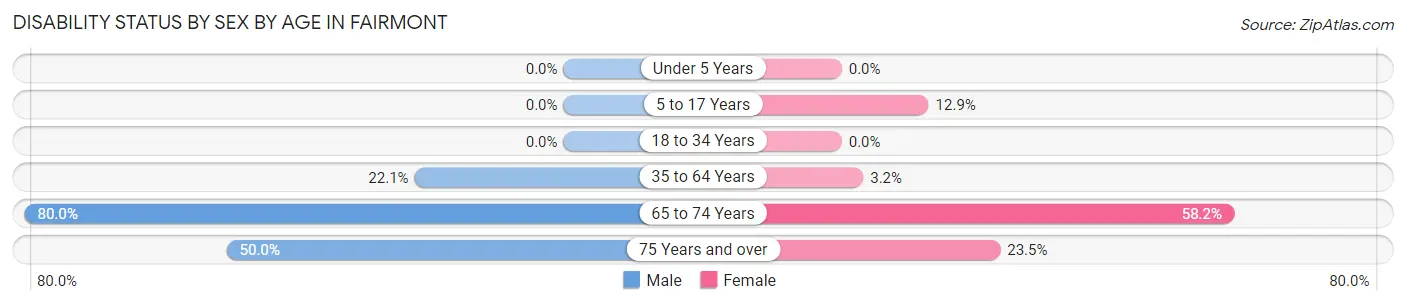
| Age Bracket | Male | Female |
| Under 5 Years | 0 (0.0%) | 0 (0.0%) |
| 5 to 17 Years | 0 (0.0%) | 4 (12.9%) |
| 18 to 34 Years | 0 (0.0%) | 0 (0.0%) |
| 35 to 64 Years | 23 (22.1%) | 3 (3.2%) |
| 65 to 74 Years | 48 (80.0%) | 39 (58.2%) |
| 75 Years and over | 21 (50.0%) | 12 (23.5%) |
Disability Class by Sex by Age in Fairmont
Disability Class: Hearing Difficulty
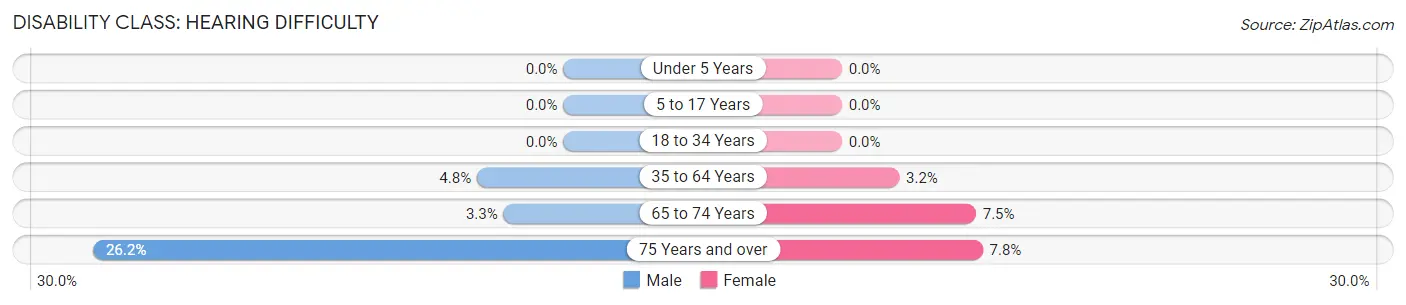
| Age Bracket | Male | Female |
| Under 5 Years | 0 (0.0%) | 0 (0.0%) |
| 5 to 17 Years | 0 (0.0%) | 0 (0.0%) |
| 18 to 34 Years | 0 (0.0%) | 0 (0.0%) |
| 35 to 64 Years | 5 (4.8%) | 3 (3.2%) |
| 65 to 74 Years | 2 (3.3%) | 5 (7.5%) |
| 75 Years and over | 11 (26.2%) | 4 (7.8%) |
Disability Class: Vision Difficulty
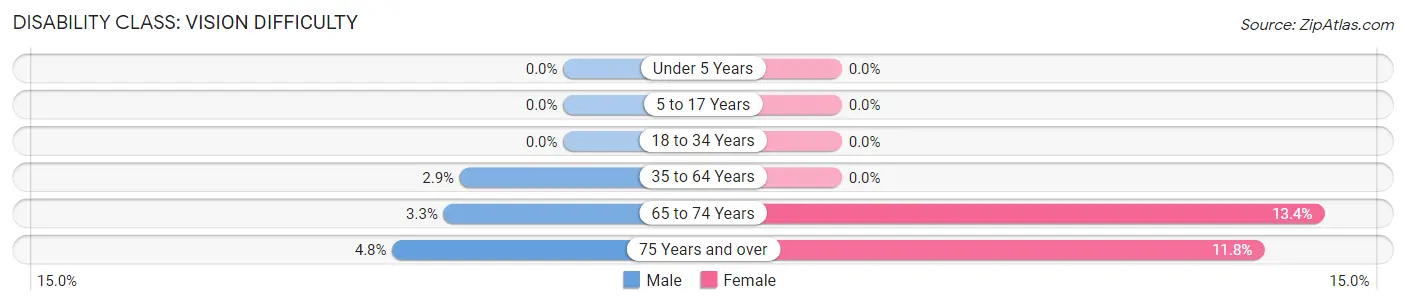
| Age Bracket | Male | Female |
| Under 5 Years | 0 (0.0%) | 0 (0.0%) |
| 5 to 17 Years | 0 (0.0%) | 0 (0.0%) |
| 18 to 34 Years | 0 (0.0%) | 0 (0.0%) |
| 35 to 64 Years | 3 (2.9%) | 0 (0.0%) |
| 65 to 74 Years | 2 (3.3%) | 9 (13.4%) |
| 75 Years and over | 2 (4.8%) | 6 (11.8%) |
Disability Class: Cognitive Difficulty
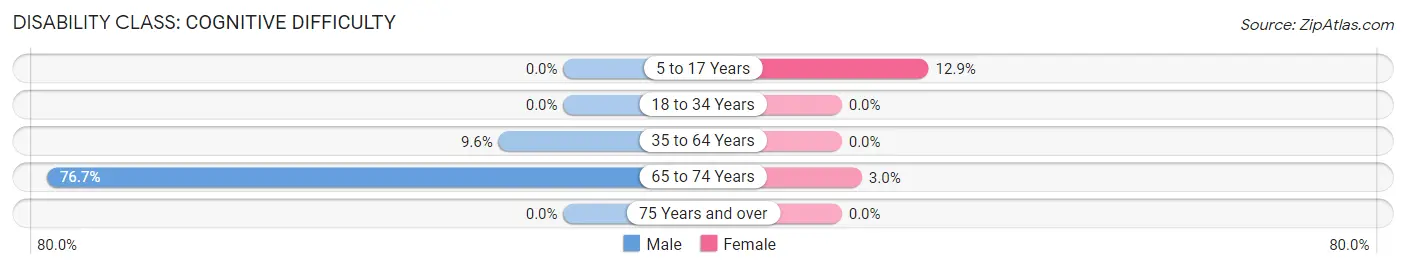
| Age Bracket | Male | Female |
| 5 to 17 Years | 0 (0.0%) | 4 (12.9%) |
| 18 to 34 Years | 0 (0.0%) | 0 (0.0%) |
| 35 to 64 Years | 10 (9.6%) | 0 (0.0%) |
| 65 to 74 Years | 46 (76.7%) | 2 (3.0%) |
| 75 Years and over | 0 (0.0%) | 0 (0.0%) |
Disability Class: Ambulatory Difficulty
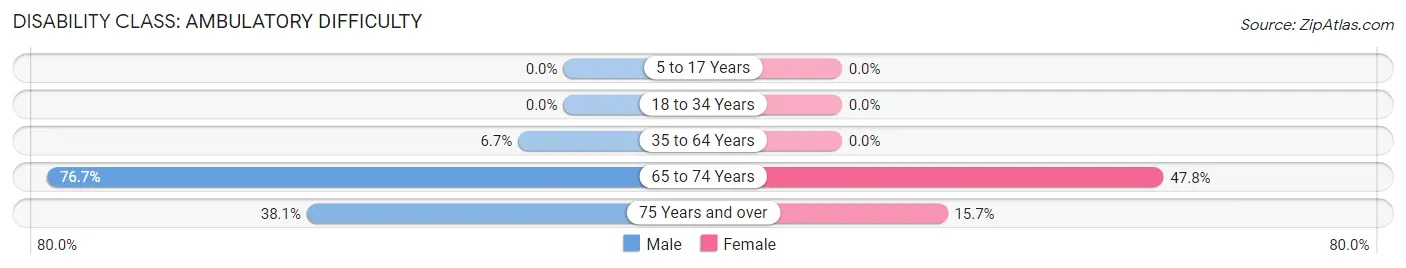
| Age Bracket | Male | Female |
| 5 to 17 Years | 0 (0.0%) | 0 (0.0%) |
| 18 to 34 Years | 0 (0.0%) | 0 (0.0%) |
| 35 to 64 Years | 7 (6.7%) | 0 (0.0%) |
| 65 to 74 Years | 46 (76.7%) | 32 (47.8%) |
| 75 Years and over | 16 (38.1%) | 8 (15.7%) |
Disability Class: Self-Care Difficulty
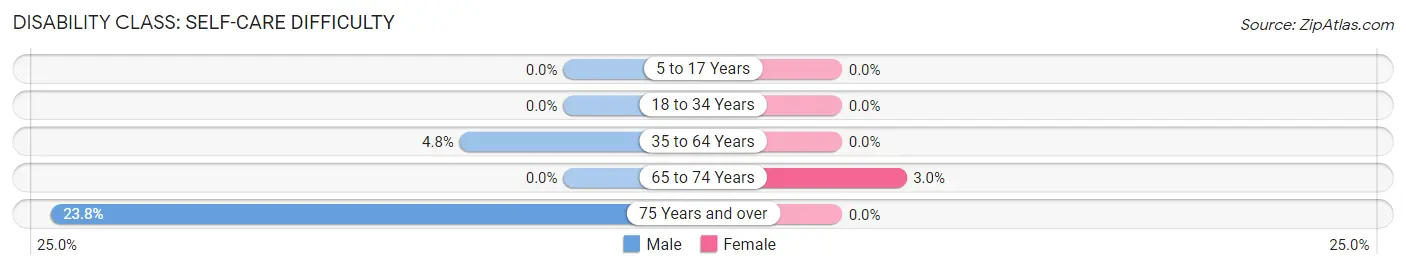
| Age Bracket | Male | Female |
| 5 to 17 Years | 0 (0.0%) | 0 (0.0%) |
| 18 to 34 Years | 0 (0.0%) | 0 (0.0%) |
| 35 to 64 Years | 5 (4.8%) | 0 (0.0%) |
| 65 to 74 Years | 0 (0.0%) | 2 (3.0%) |
| 75 Years and over | 10 (23.8%) | 0 (0.0%) |
Technology Access in Fairmont
Computing Device Access in Fairmont
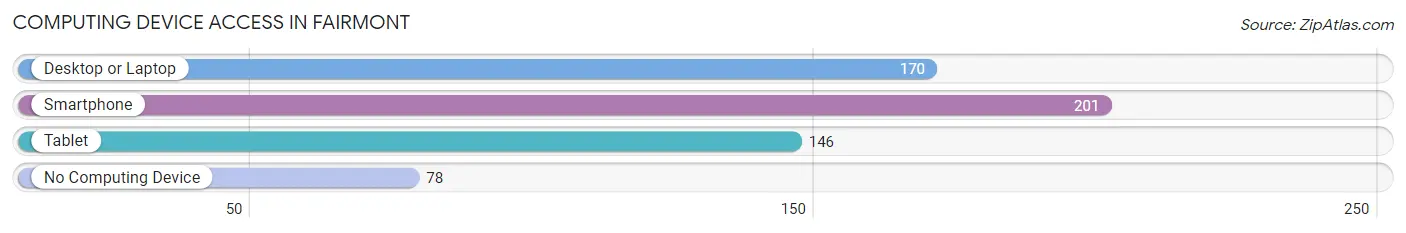
| Device Type | # Households | % Households |
| Desktop or Laptop | 170 | 57.2% |
| Smartphone | 201 | 67.7% |
| Tablet | 146 | 49.2% |
| No Computing Device | 78 | 26.3% |
| Total | 297 | 100.0% |
Internet Access in Fairmont
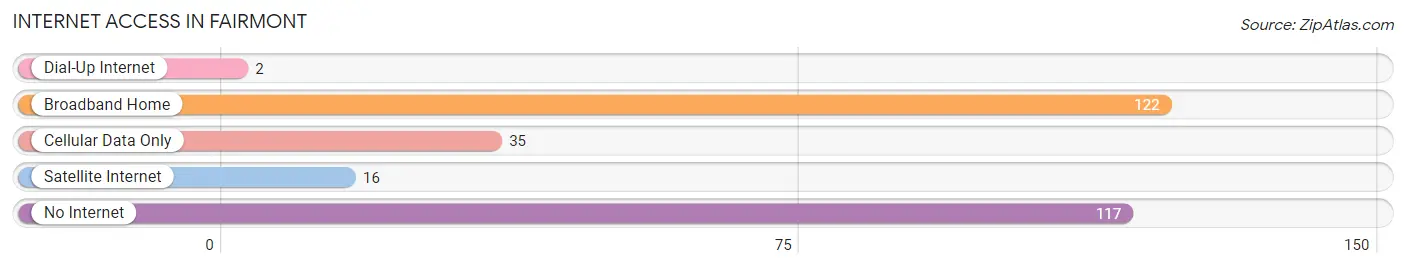
| Internet Type | # Households | % Households |
| Dial-Up Internet | 2 | 0.7% |
| Broadband Home | 122 | 41.1% |
| Cellular Data Only | 35 | 11.8% |
| Satellite Internet | 16 | 5.4% |
| No Internet | 117 | 39.4% |
| Total | 297 | 100.0% |
Fairmont Summary
History
The small town of Fairmont, Nebraska is located in the southeastern corner of the state, just a few miles from the Missouri River. The town was founded in 1871 by a group of settlers from Iowa, who were looking for a place to settle and start a new life. The town was named after the nearby Fairmont Creek, which was named after the nearby Fairmont Hotel in Omaha.
The town quickly grew and prospered, becoming a center of commerce and industry in the area. The first post office was established in 1872, and the first school was built in 1873. The town was incorporated in 1875, and the first newspaper, the Fairmont Herald, was established in 1876.
The town continued to grow and prosper throughout the late 19th and early 20th centuries. The railroad arrived in 1887, and the town was connected to the rest of the state by the Lincoln Highway in 1913. The town also became a center of agriculture, with the first grain elevator being built in 1891.
The town experienced a period of decline in the mid-20th century, as the railroad and other industries moved away. However, the town has experienced a resurgence in recent years, with new businesses and industries moving into the area.
Geography
Fairmont is located in the southeastern corner of Nebraska, just a few miles from the Missouri River. The town is situated in a flat, open area, with rolling hills to the north and east. The town is located in the Platte River Valley, and is surrounded by farmland and prairie.
The town is located at an elevation of 1,845 feet above sea level, and has a total area of 1.2 square miles. The town is located in the Central Time Zone, and has a humid continental climate, with hot summers and cold winters.
Economy
The economy of Fairmont is largely based on agriculture and manufacturing. The town is home to several grain elevators, as well as a number of manufacturing plants. The town is also home to a number of small businesses, including restaurants, retail stores, and service providers.
The town is also home to a number of educational institutions, including a community college and a technical school. The town is also home to a number of medical facilities, including a hospital and several clinics.
Demographics
As of the 2010 census, the town of Fairmont had a population of 1,845 people. The population is largely white, with a small minority population. The median household income is $41,250, and the median home value is $90,000. The town has a low unemployment rate, and a high rate of homeownership.
Common Questions
What is Per Capita Income in Fairmont?
Per Capita income in Fairmont is $32,397.
What is the Median Family Income in Fairmont?
Median Family Income in Fairmont is $73,750.
What is the Median Household income in Fairmont?
Median Household Income in Fairmont is $53,917.
What is Income or Wage Gap in Fairmont?
Income or Wage Gap in Fairmont is 36.0%.
Women in Fairmont earn 64.0 cents for every dollar earned by a man.
What is Inequality or Gini Index in Fairmont?
Inequality or Gini Index in Fairmont is 0.37.
What is the Total Population of Fairmont?
Total Population of Fairmont is 621.
What is the Total Male Population of Fairmont?
Total Male Population of Fairmont is 303.
What is the Total Female Population of Fairmont?
Total Female Population of Fairmont is 318.
What is the Ratio of Males per 100 Females in Fairmont?
There are 95.28 Males per 100 Females in Fairmont.
What is the Ratio of Females per 100 Males in Fairmont?
There are 104.95 Females per 100 Males in Fairmont.
What is the Median Population Age in Fairmont?
Median Population Age in Fairmont is 58.9 Years.
What is the Average Family Size in Fairmont
Average Family Size in Fairmont is 2.6 People.
What is the Average Household Size in Fairmont
Average Household Size in Fairmont is 2.0 People.
How Large is the Labor Force in Fairmont?
There are 244 People in the Labor Forcein in Fairmont.
What is the Percentage of People in the Labor Force in Fairmont?
45.4% of People are in the Labor Force in Fairmont.
What is the Unemployment Rate in Fairmont?
Unemployment Rate in Fairmont is 3.3%.