Fairfield, NE Map & Demographics
Fairfield Map
Fairfield Overview
$37,654
PER CAPITA INCOME
$82,857
AVG FAMILY INCOME
$69,375
AVG HOUSEHOLD INCOME
52.4%
WAGE / INCOME GAP [ % ]
47.6¢/ $1
WAGE / INCOME GAP [ $ ]
0.47
INEQUALITY / GINI INDEX
375
TOTAL POPULATION
204
MALE POPULATION
171
FEMALE POPULATION
119.30
MALES / 100 FEMALES
83.82
FEMALES / 100 MALES
46.0
MEDIAN AGE
2.5
AVG FAMILY SIZE
2.2
AVG HOUSEHOLD SIZE
207
LABOR FORCE [ PEOPLE ]
67.9%
PERCENT IN LABOR FORCE
1.4%
UNEMPLOYMENT RATE
Fairfield Zip Codes
Fairfield Area Codes
Income in Fairfield
Income Overview in Fairfield
Per Capita Income in Fairfield is $37,654, while median incomes of families and households are $82,857 and $69,375 respectively.
| Characteristic | Number | Measure |
| Per Capita Income | 375 | $37,654 |
| Median Family Income | 100 | $82,857 |
| Mean Family Income | 100 | $113,392 |
| Median Household Income | 171 | $69,375 |
| Mean Household Income | 171 | $89,251 |
| Income Deficit | 100 | $0 |
| Wage / Income Gap (%) | 375 | 52.38% |
| Wage / Income Gap ($) | 375 | 47.62¢ per $1 |
| Gini / Inequality Index | 375 | 0.47 |
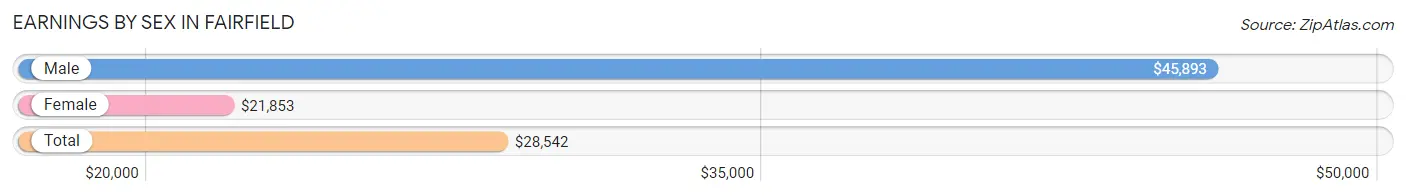
Earnings by Sex in Fairfield
Average Earnings in Fairfield are $28,542, $45,893 for men and $21,853 for women, a difference of 52.4%.
| Sex | Number | Average Earnings |
| Male | 119 (54.6%) | $45,893 |
| Female | 99 (45.4%) | $21,853 |
| Total | 218 (100.0%) | $28,542 |
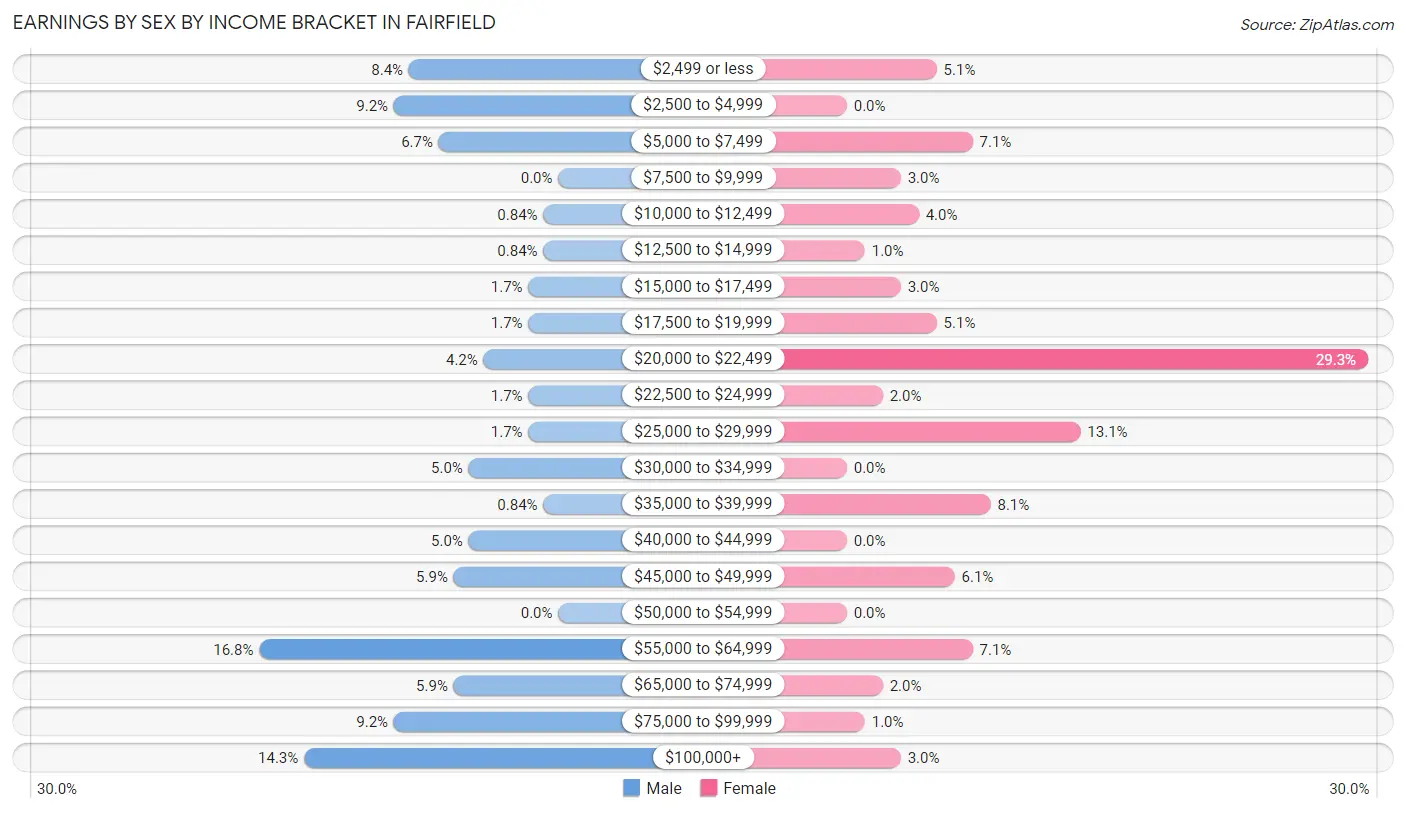
Earnings by Sex by Income Bracket in Fairfield
The most common earnings brackets in Fairfield are $55,000 to $64,999 for men (20 | 16.8%) and $20,000 to $22,499 for women (29 | 29.3%).
| Income | Male | Female |
| $2,499 or less | 10 (8.4%) | 5 (5.1%) |
| $2,500 to $4,999 | 11 (9.2%) | 0 (0.0%) |
| $5,000 to $7,499 | 8 (6.7%) | 7 (7.1%) |
| $7,500 to $9,999 | 0 (0.0%) | 3 (3.0%) |
| $10,000 to $12,499 | 1 (0.8%) | 4 (4.0%) |
| $12,500 to $14,999 | 1 (0.8%) | 1 (1.0%) |
| $15,000 to $17,499 | 2 (1.7%) | 3 (3.0%) |
| $17,500 to $19,999 | 2 (1.7%) | 5 (5.1%) |
| $20,000 to $22,499 | 5 (4.2%) | 29 (29.3%) |
| $22,500 to $24,999 | 2 (1.7%) | 2 (2.0%) |
| $25,000 to $29,999 | 2 (1.7%) | 13 (13.1%) |
| $30,000 to $34,999 | 6 (5.0%) | 0 (0.0%) |
| $35,000 to $39,999 | 1 (0.8%) | 8 (8.1%) |
| $40,000 to $44,999 | 6 (5.0%) | 0 (0.0%) |
| $45,000 to $49,999 | 7 (5.9%) | 6 (6.1%) |
| $50,000 to $54,999 | 0 (0.0%) | 0 (0.0%) |
| $55,000 to $64,999 | 20 (16.8%) | 7 (7.1%) |
| $65,000 to $74,999 | 7 (5.9%) | 2 (2.0%) |
| $75,000 to $99,999 | 11 (9.2%) | 1 (1.0%) |
| $100,000+ | 17 (14.3%) | 3 (3.0%) |
| Total | 119 (100.0%) | 99 (100.0%) |
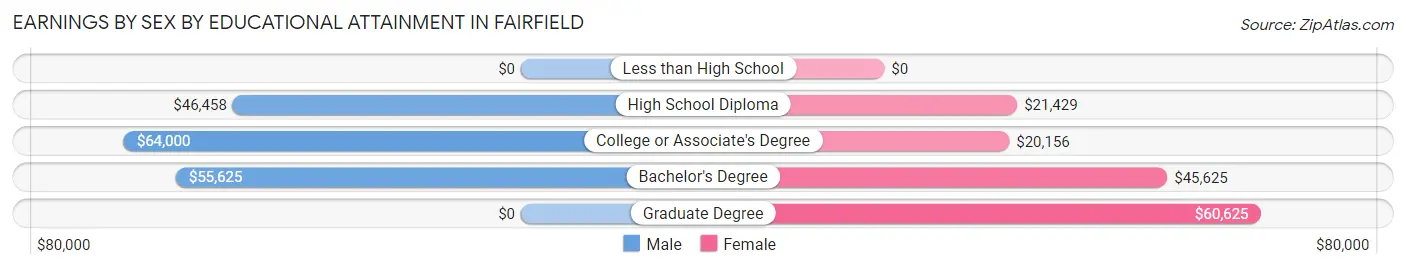
Earnings by Sex by Educational Attainment in Fairfield
Average earnings in Fairfield are $57,917 for men and $21,810 for women, a difference of 62.3%. Men with an educational attainment of college or associate's degree enjoy the highest average annual earnings of $64,000, while those with high school diploma education earn the least with $46,458. Women with an educational attainment of graduate degree earn the most with the average annual earnings of $60,625, while those with college or associate's degree education have the smallest earnings of $20,156.
| Educational Attainment | Male Income | Female Income |
| Less than High School | - | - |
| High School Diploma | $46,458 | $21,429 |
| College or Associate's Degree | $64,000 | $20,156 |
| Bachelor's Degree | $55,625 | $45,625 |
| Graduate Degree | - | - |
| Total | $57,917 | $21,810 |
Family Income in Fairfield
Family Income Brackets in Fairfield
According to the Fairfield family income data, there are 21 families falling into the $75,000 to $99,999 income range, which is the most common income bracket and makes up 21.0% of all families.
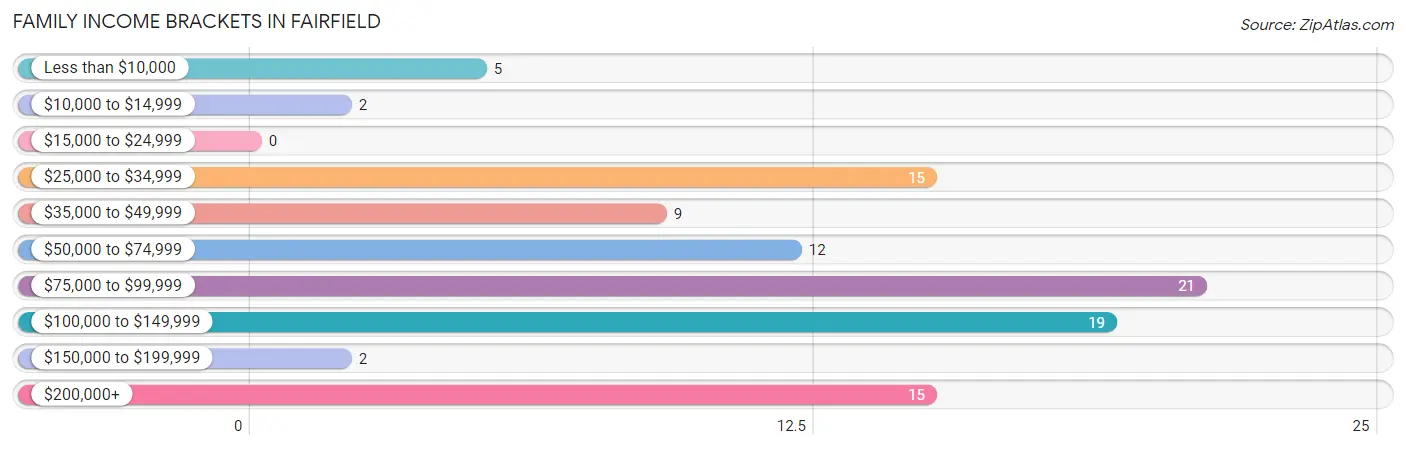
| Income Bracket | # Families | % Families |
| Less than $10,000 | 5 | 5.0% |
| $10,000 to $14,999 | 2 | 2.0% |
| $15,000 to $24,999 | 0 | 0.0% |
| $25,000 to $34,999 | 15 | 15.0% |
| $35,000 to $49,999 | 9 | 9.0% |
| $50,000 to $74,999 | 12 | 12.0% |
| $75,000 to $99,999 | 21 | 21.0% |
| $100,000 to $149,999 | 19 | 19.0% |
| $150,000 to $199,999 | 2 | 2.0% |
| $200,000+ | 15 | 15.0% |
Family Income by Famaliy Size in Fairfield
3-person families (17 | 17.0%) account for the highest median family income in Fairfield with $107,750 per family, while 2-person families (74 | 74.0%) have the highest median income of $40,000 per family member.
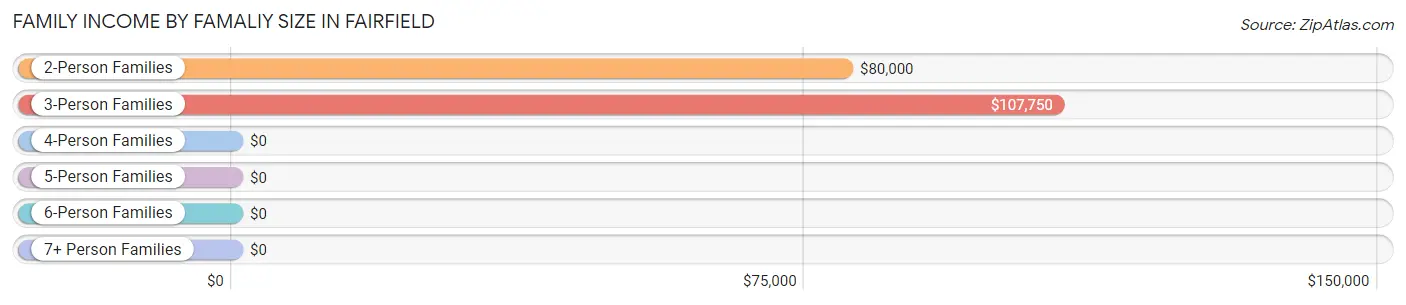
| Income Bracket | # Families | Median Income |
| 2-Person Families | 74 (74.0%) | $80,000 |
| 3-Person Families | 17 (17.0%) | $107,750 |
| 4-Person Families | 3 (3.0%) | $0 |
| 5-Person Families | 4 (4.0%) | $0 |
| 6-Person Families | 1 (1.0%) | $0 |
| 7+ Person Families | 1 (1.0%) | $0 |
| Total | 100 (100.0%) | $82,857 |
Family Income by Number of Earners in Fairfield
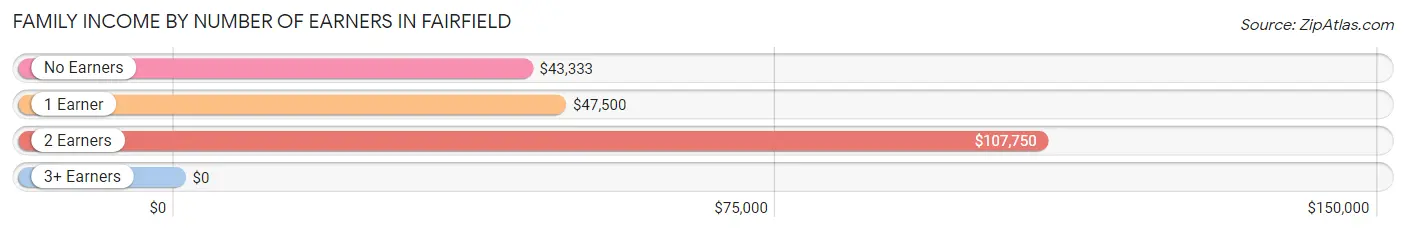
| Number of Earners | # Families | Median Income |
| No Earners | 16 (16.0%) | $43,333 |
| 1 Earner | 18 (18.0%) | $47,500 |
| 2 Earners | 65 (65.0%) | $107,750 |
| 3+ Earners | 1 (1.0%) | $0 |
| Total | 100 (100.0%) | $82,857 |
Household Income in Fairfield
Household Income Brackets in Fairfield
With 30 households falling in the category, the $100,000 to $149,999 income range is the most frequent in Fairfield, accounting for 17.5% of all households. In contrast, only 2 households (1.2%) fall into the $150,000 to $199,999 income bracket, making it the least populous group.
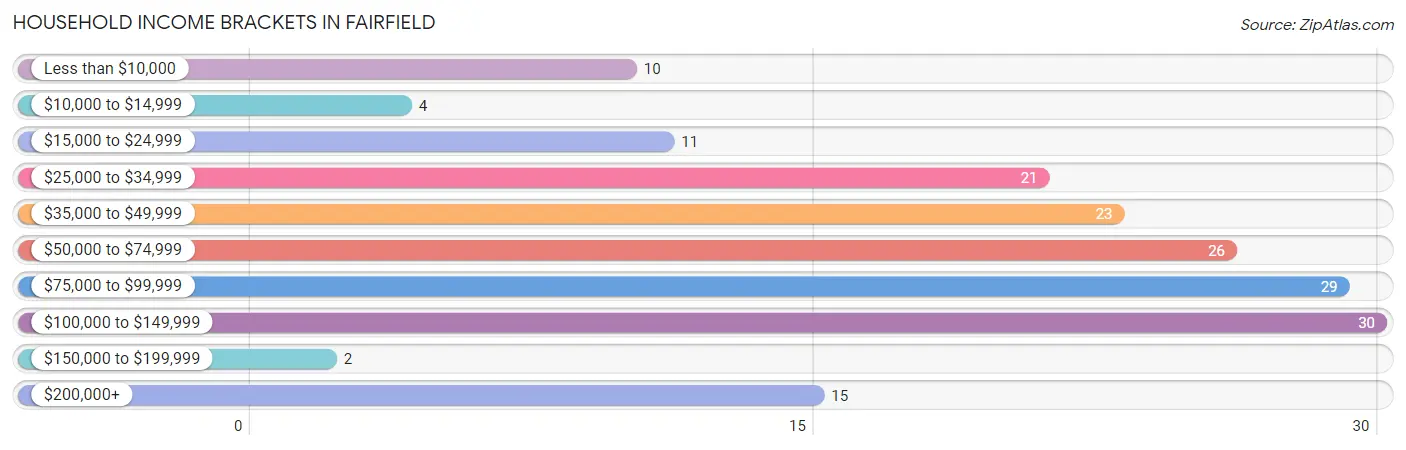
| Income Bracket | # Households | % Households |
| Less than $10,000 | 10 | 5.8% |
| $10,000 to $14,999 | 4 | 2.3% |
| $15,000 to $24,999 | 11 | 6.4% |
| $25,000 to $34,999 | 21 | 12.3% |
| $35,000 to $49,999 | 23 | 13.5% |
| $50,000 to $74,999 | 26 | 15.2% |
| $75,000 to $99,999 | 29 | 17.0% |
| $100,000 to $149,999 | 30 | 17.5% |
| $150,000 to $199,999 | 2 | 1.2% |
| $200,000+ | 15 | 8.8% |
Household Income by Householder Age in Fairfield
The median household income in Fairfield is $69,375, with the highest median household income of $77,500 found in the 25 to 44 years age bracket for the primary householder. A total of 52 households (30.4%) fall into this category. Meanwhile, the 15 to 24 years age bracket for the primary householder has the lowest median household income of $0, with 5 households (2.9%) in this group.
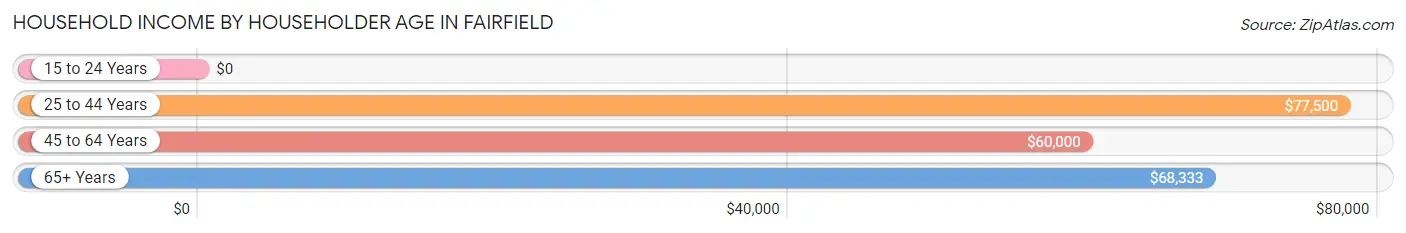
| Income Bracket | # Households | Median Income |
| 15 to 24 Years | 5 (2.9%) | $0 |
| 25 to 44 Years | 52 (30.4%) | $77,500 |
| 45 to 64 Years | 60 (35.1%) | $60,000 |
| 65+ Years | 54 (31.6%) | $68,333 |
| Total | 171 (100.0%) | $69,375 |
Poverty in Fairfield
Income Below Poverty by Sex and Age in Fairfield
With 11.1% poverty level for males and 8.4% for females among the residents of Fairfield, 25 to 34 year old males and under 5 year old females are the most vulnerable to poverty, with 11 males (34.4%) and 2 females (50.0%) in their respective age groups living below the poverty level.
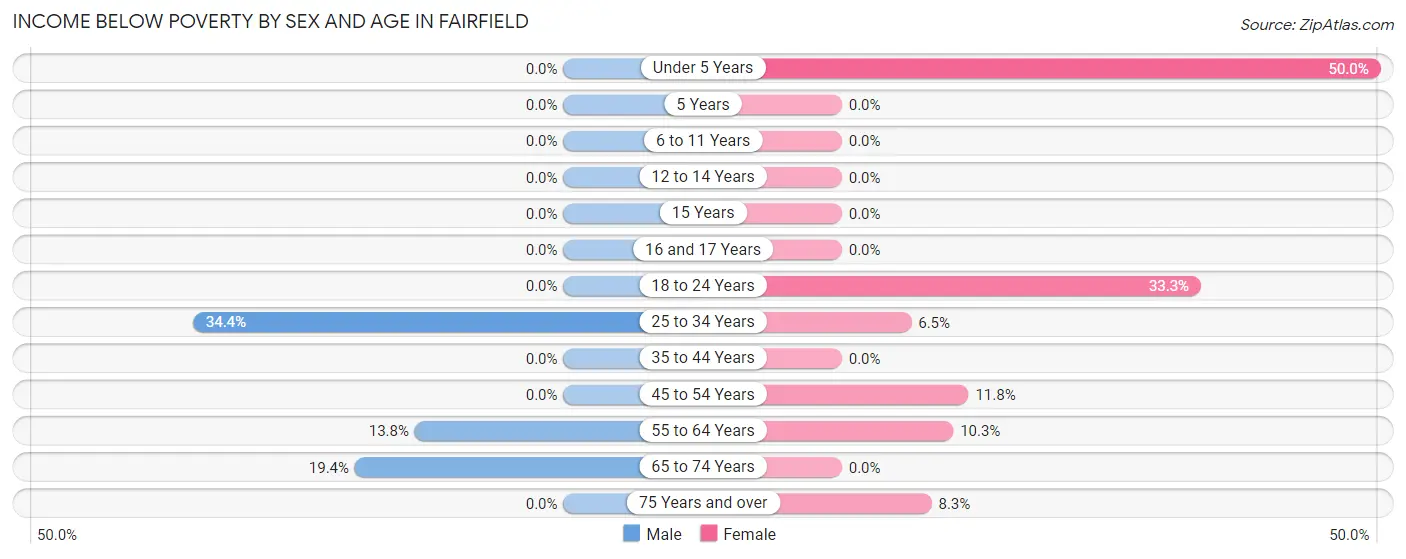
| Age Bracket | Male | Female |
| Under 5 Years | 0 (0.0%) | 2 (50.0%) |
| 5 Years | 0 (0.0%) | 0 (0.0%) |
| 6 to 11 Years | 0 (0.0%) | 0 (0.0%) |
| 12 to 14 Years | 0 (0.0%) | 0 (0.0%) |
| 15 Years | 0 (0.0%) | 0 (0.0%) |
| 16 and 17 Years | 0 (0.0%) | 0 (0.0%) |
| 18 to 24 Years | 0 (0.0%) | 2 (33.3%) |
| 25 to 34 Years | 11 (34.4%) | 2 (6.5%) |
| 35 to 44 Years | 0 (0.0%) | 0 (0.0%) |
| 45 to 54 Years | 0 (0.0%) | 2 (11.8%) |
| 55 to 64 Years | 4 (13.8%) | 3 (10.3%) |
| 65 to 74 Years | 6 (19.4%) | 0 (0.0%) |
| 75 Years and over | 0 (0.0%) | 2 (8.3%) |
| Total | 21 (11.1%) | 13 (8.4%) |
Income Above Poverty by Sex and Age in Fairfield
According to the poverty statistics in Fairfield, males aged under 5 years and females aged 6 to 11 years are the age groups that are most secure financially, with 100.0% of males and 100.0% of females in these age groups living above the poverty line.
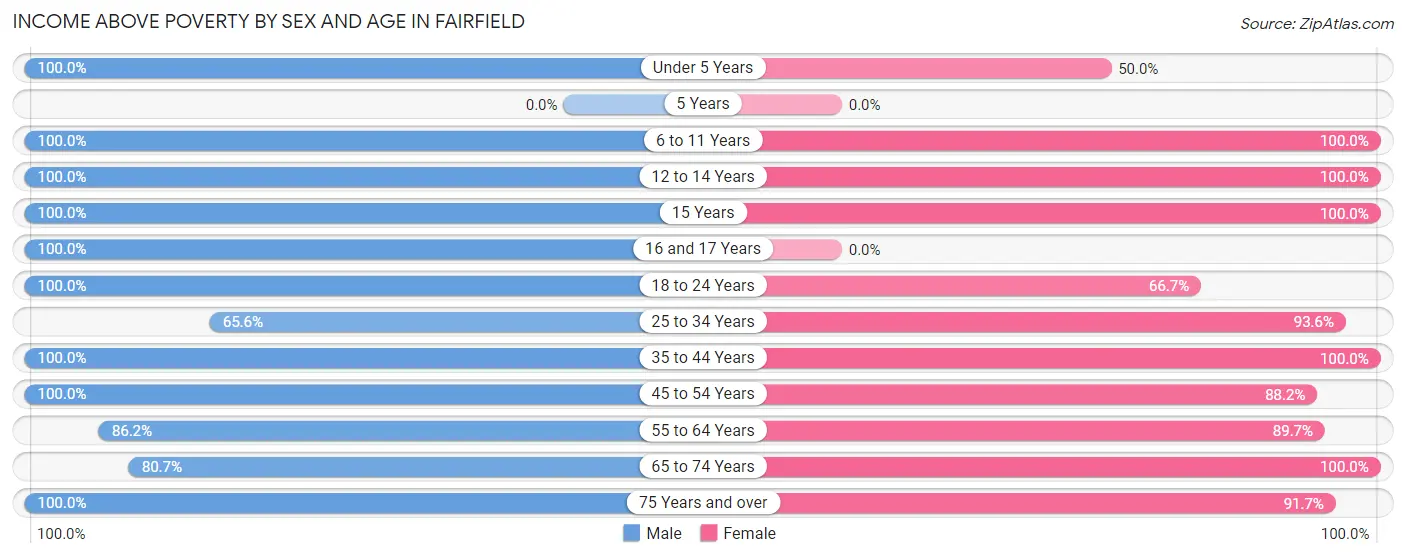
| Age Bracket | Male | Female |
| Under 5 Years | 7 (100.0%) | 2 (50.0%) |
| 5 Years | 0 (0.0%) | 0 (0.0%) |
| 6 to 11 Years | 9 (100.0%) | 1 (100.0%) |
| 12 to 14 Years | 7 (100.0%) | 7 (100.0%) |
| 15 Years | 3 (100.0%) | 1 (100.0%) |
| 16 and 17 Years | 7 (100.0%) | 0 (0.0%) |
| 18 to 24 Years | 10 (100.0%) | 4 (66.7%) |
| 25 to 34 Years | 21 (65.6%) | 29 (93.5%) |
| 35 to 44 Years | 10 (100.0%) | 12 (100.0%) |
| 45 to 54 Years | 32 (100.0%) | 15 (88.2%) |
| 55 to 64 Years | 25 (86.2%) | 26 (89.7%) |
| 65 to 74 Years | 25 (80.6%) | 22 (100.0%) |
| 75 Years and over | 13 (100.0%) | 22 (91.7%) |
| Total | 169 (88.9%) | 141 (91.6%) |
Income Below Poverty Among Married-Couple Families in Fairfield
The poverty statistics for married-couple families in Fairfield show that 4.8% or 4 of the total 83 families live below the poverty line. Families with no children have the highest poverty rate of 6.5%, comprising of 4 families. On the other hand, families with 1 or 2 children have the lowest poverty rate of 0.0%, which includes 0 families.
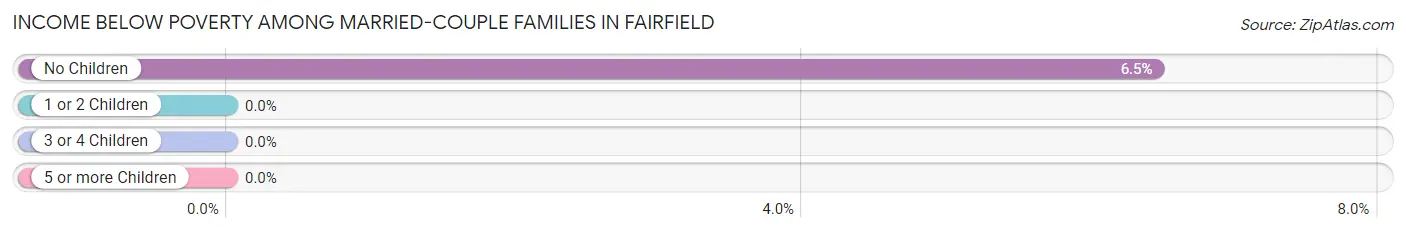
| Children | Above Poverty | Below Poverty |
| No Children | 58 (93.5%) | 4 (6.5%) |
| 1 or 2 Children | 17 (100.0%) | 0 (0.0%) |
| 3 or 4 Children | 4 (100.0%) | 0 (0.0%) |
| 5 or more Children | 0 (0.0%) | 0 (0.0%) |
| Total | 79 (95.2%) | 4 (4.8%) |
Income Below Poverty Among Single-Parent Households in Fairfield
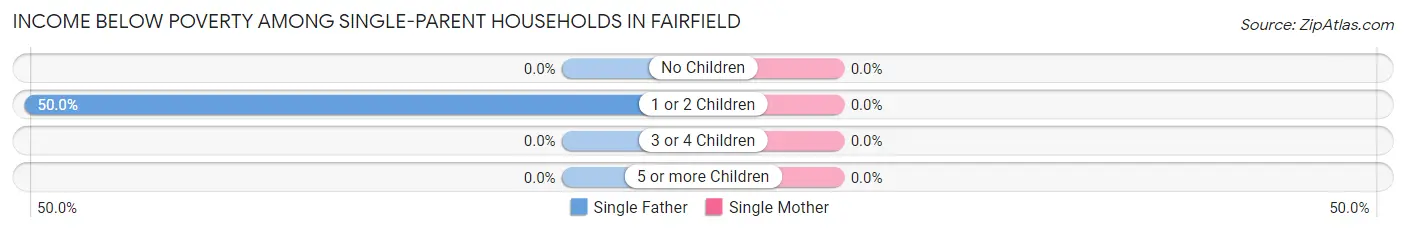
| Children | Single Father | Single Mother |
| No Children | 0 (0.0%) | 0 (0.0%) |
| 1 or 2 Children | 3 (50.0%) | 0 (0.0%) |
| 3 or 4 Children | 0 (0.0%) | 0 (0.0%) |
| 5 or more Children | 0 (0.0%) | 0 (0.0%) |
| Total | 3 (27.3%) | 0 (0.0%) |
Income Below Poverty Among Married-Couple vs Single-Parent Households in Fairfield
The poverty data for Fairfield shows that 4 of the married-couple family households (4.8%) and 3 of the single-parent households (17.6%) are living below the poverty level. Within the married-couple family households, those with no children have the highest poverty rate, with 4 households (6.5%) falling below the poverty line. Among the single-parent households, those with 1 or 2 children have the highest poverty rate, with 3 household (33.3%) living below poverty.
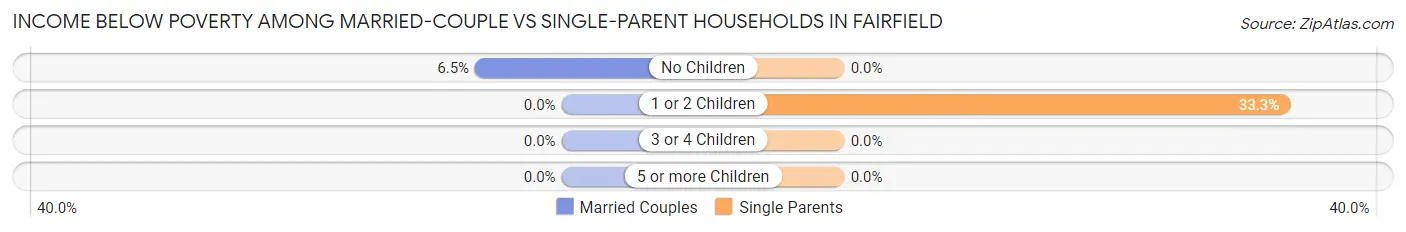
| Children | Married-Couple Families | Single-Parent Households |
| No Children | 4 (6.5%) | 0 (0.0%) |
| 1 or 2 Children | 0 (0.0%) | 3 (33.3%) |
| 3 or 4 Children | 0 (0.0%) | 0 (0.0%) |
| 5 or more Children | 0 (0.0%) | 0 (0.0%) |
| Total | 4 (4.8%) | 3 (17.6%) |
Race in Fairfield
The most populous races in Fairfield are White / Caucasian (360 | 96.0%), Two or more Races (15 | 4.0%), and Hispanic or Latino (11 | 2.9%).
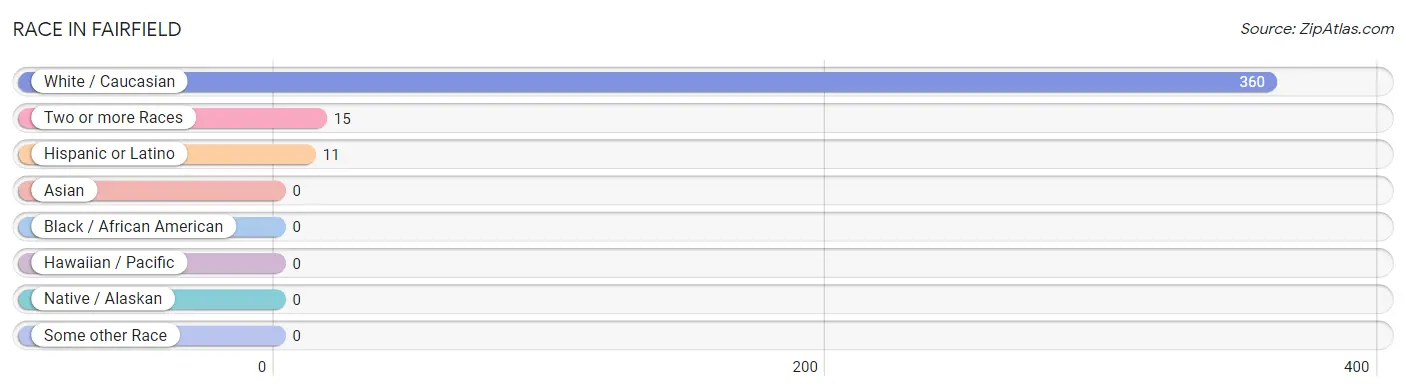
| Race | # Population | % Population |
| Asian | 0 | 0.0% |
| Black / African American | 0 | 0.0% |
| Hawaiian / Pacific | 0 | 0.0% |
| Hispanic or Latino | 11 | 2.9% |
| Native / Alaskan | 0 | 0.0% |
| White / Caucasian | 360 | 96.0% |
| Two or more Races | 15 | 4.0% |
| Some other Race | 0 | 0.0% |
| Total | 375 | 100.0% |
Ancestry in Fairfield
The most populous ancestries reported in Fairfield are German (160 | 42.7%), Irish (42 | 11.2%), Czech (28 | 7.5%), English (24 | 6.4%), and American (23 | 6.1%), together accounting for 73.9% of all Fairfield residents.
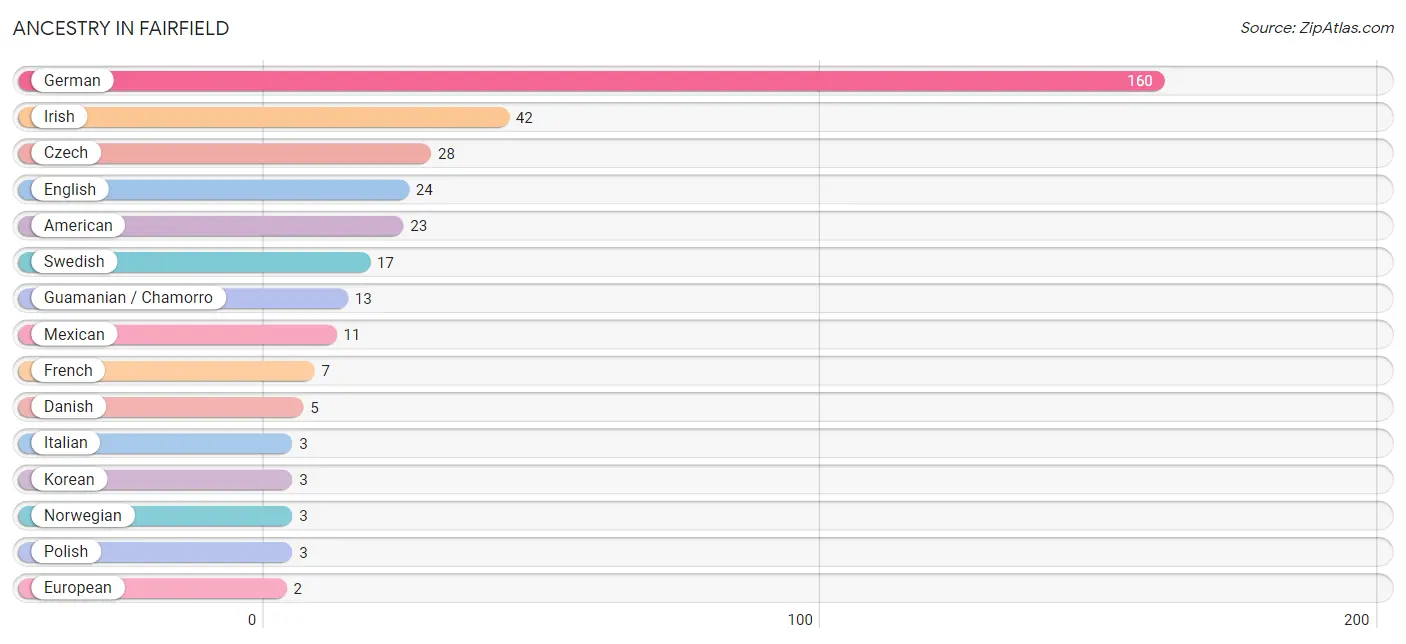
| Ancestry | # Population | % Population |
| African | 1 | 0.3% |
| American | 23 | 6.1% |
| British | 1 | 0.3% |
| Czech | 28 | 7.5% |
| Czechoslovakian | 1 | 0.3% |
| Danish | 5 | 1.3% |
| English | 24 | 6.4% |
| European | 2 | 0.5% |
| French | 7 | 1.9% |
| French Canadian | 2 | 0.5% |
| German | 160 | 42.7% |
| Guamanian / Chamorro | 13 | 3.5% |
| Irish | 42 | 11.2% |
| Italian | 3 | 0.8% |
| Korean | 3 | 0.8% |
| Mexican | 11 | 2.9% |
| Norwegian | 3 | 0.8% |
| Polish | 3 | 0.8% |
| Slavic | 1 | 0.3% |
| Slovak | 2 | 0.5% |
| Subsaharan African | 1 | 0.3% |
| Swedish | 17 | 4.5% |
| Swiss | 1 | 0.3% | View All 23 Rows |
Immigrants in Fairfield

| Immigration Origin | # Population | % Population | View All 0 Rows |
Sex and Age in Fairfield
Sex and Age in Fairfield
The most populous age groups in Fairfield are 65 to 69 Years (25 | 12.2%) for men and 55 to 59 Years (17 | 9.9%) for women.
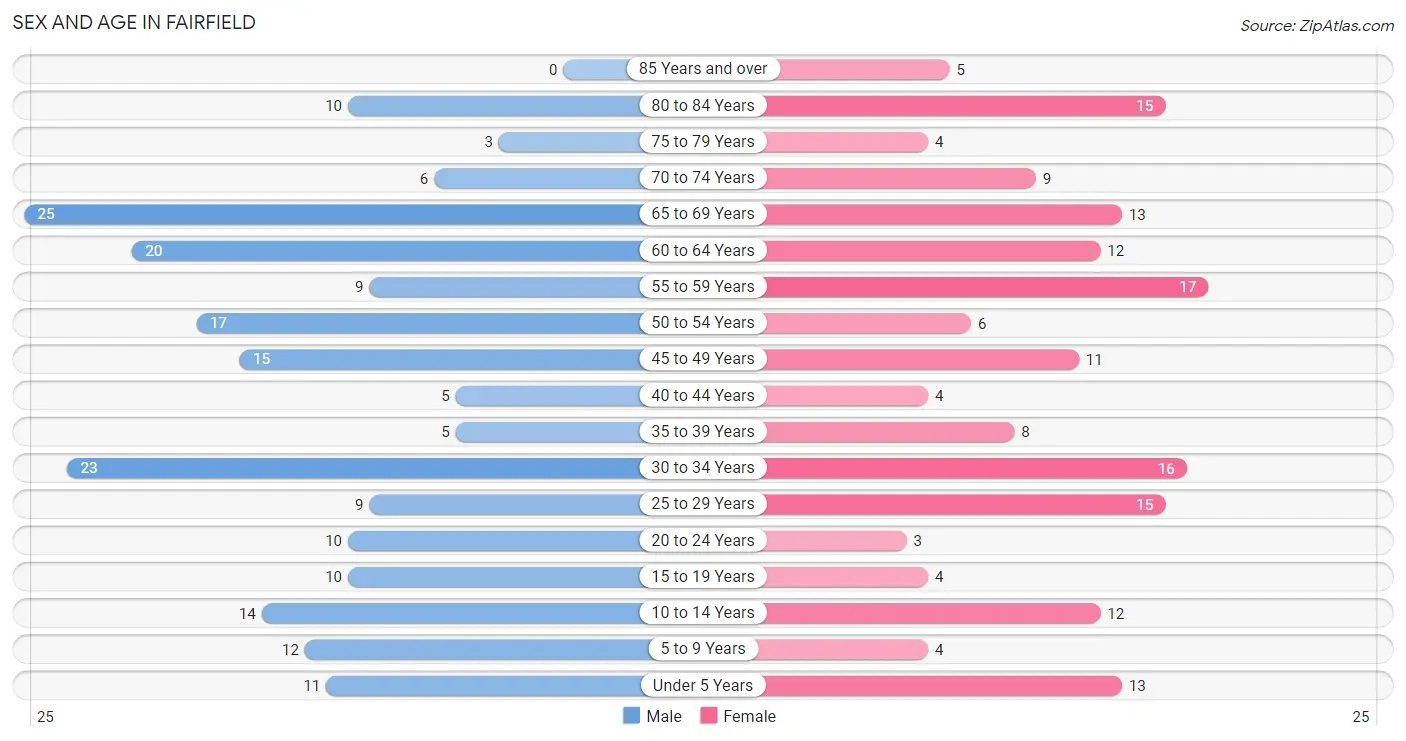
| Age Bracket | Male | Female |
| Under 5 Years | 11 (5.4%) | 13 (7.6%) |
| 5 to 9 Years | 12 (5.9%) | 4 (2.3%) |
| 10 to 14 Years | 14 (6.9%) | 12 (7.0%) |
| 15 to 19 Years | 10 (4.9%) | 4 (2.3%) |
| 20 to 24 Years | 10 (4.9%) | 3 (1.8%) |
| 25 to 29 Years | 9 (4.4%) | 15 (8.8%) |
| 30 to 34 Years | 23 (11.3%) | 16 (9.4%) |
| 35 to 39 Years | 5 (2.5%) | 8 (4.7%) |
| 40 to 44 Years | 5 (2.5%) | 4 (2.3%) |
| 45 to 49 Years | 15 (7.3%) | 11 (6.4%) |
| 50 to 54 Years | 17 (8.3%) | 6 (3.5%) |
| 55 to 59 Years | 9 (4.4%) | 17 (9.9%) |
| 60 to 64 Years | 20 (9.8%) | 12 (7.0%) |
| 65 to 69 Years | 25 (12.2%) | 13 (7.6%) |
| 70 to 74 Years | 6 (2.9%) | 9 (5.3%) |
| 75 to 79 Years | 3 (1.5%) | 4 (2.3%) |
| 80 to 84 Years | 10 (4.9%) | 15 (8.8%) |
| 85 Years and over | 0 (0.0%) | 5 (2.9%) |
| Total | 204 (100.0%) | 171 (100.0%) |
Families and Households in Fairfield
Median Family Size in Fairfield
The median family size in Fairfield is 2.45 persons per family, with married-couple families (83 | 83.0%) accounting for the largest median family size of 2.51 persons per family. On the other hand, single female/mother families (6 | 6.0%) represent the smallest median family size with 2.17 persons per family.
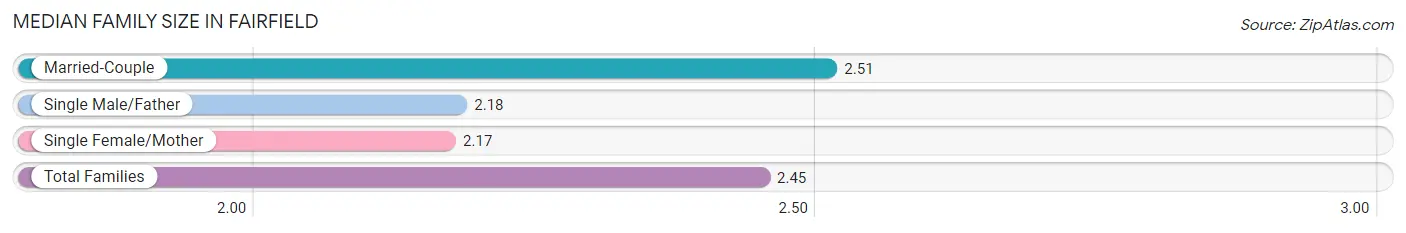
| Family Type | # Families | Family Size |
| Married-Couple | 83 (83.0%) | 2.51 |
| Single Male/Father | 11 (11.0%) | 2.18 |
| Single Female/Mother | 6 (6.0%) | 2.17 |
| Total Families | 100 (100.0%) | 2.45 |
Median Household Size in Fairfield
The median household size in Fairfield is 2.19 persons per household, with married-couple households (83 | 48.5%) accounting for the largest median household size of 2.53 persons per household. non-family households (71 | 41.5%) represent the smallest median household size with 1.77 persons per household.
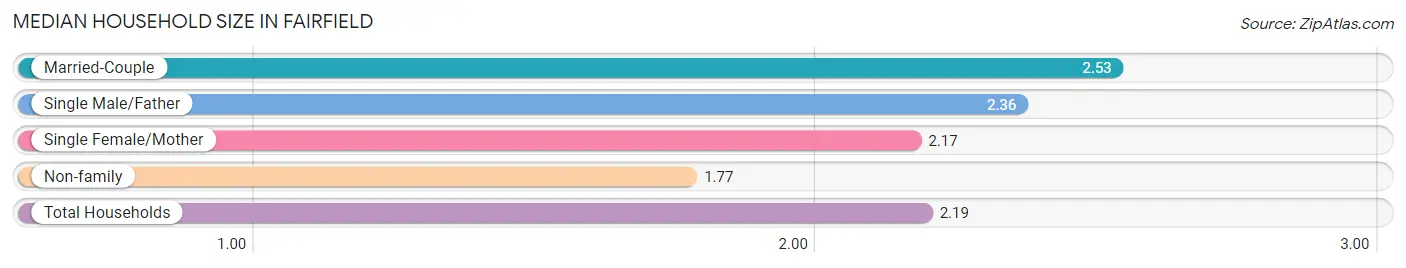
| Household Type | # Households | Household Size |
| Married-Couple | 83 (48.5%) | 2.53 |
| Single Male/Father | 11 (6.4%) | 2.36 |
| Single Female/Mother | 6 (3.5%) | 2.17 |
| Non-family | 71 (41.5%) | 1.77 |
| Total Households | 171 (100.0%) | 2.19 |
Household Size by Marriage Status in Fairfield
Out of a total of 171 households in Fairfield, 100 (58.5%) are family households, while 71 (41.5%) are nonfamily households. The most numerous type of family households are 2-person households, comprising 71, and the most common type of nonfamily households are 1-person households, comprising 42.
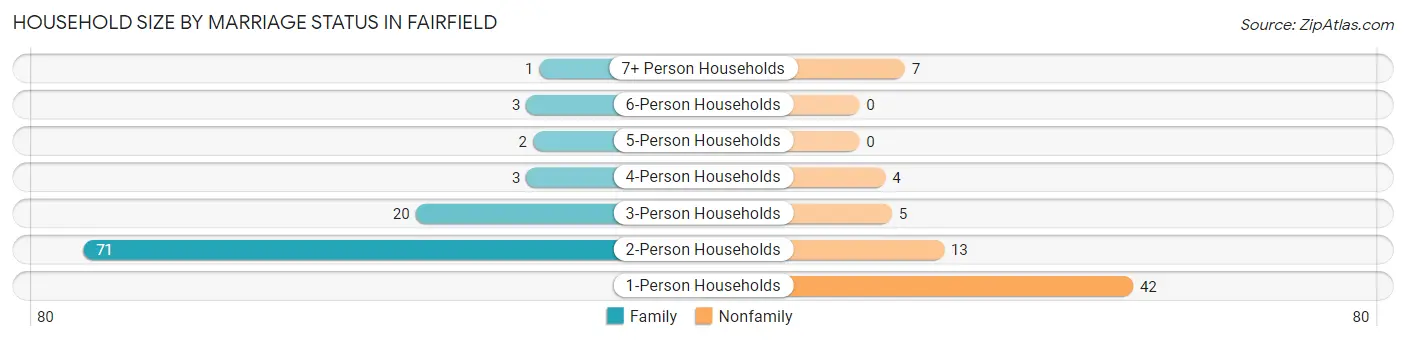
| Household Size | Family Households | Nonfamily Households |
| 1-Person Households | - | 42 (24.6%) |
| 2-Person Households | 71 (41.5%) | 13 (7.6%) |
| 3-Person Households | 20 (11.7%) | 5 (2.9%) |
| 4-Person Households | 3 (1.8%) | 4 (2.3%) |
| 5-Person Households | 2 (1.2%) | 0 (0.0%) |
| 6-Person Households | 3 (1.8%) | 0 (0.0%) |
| 7+ Person Households | 1 (0.6%) | 7 (4.1%) |
| Total | 100 (58.5%) | 71 (41.5%) |
Female Fertility in Fairfield
Fertility by Age in Fairfield
| Age Bracket | Women with Births | Births / 1,000 Women |
| 15 to 19 years | 0 (0.0%) | 0.0 |
| 20 to 34 years | 0 (0.0%) | 0.0 |
| 35 to 50 years | 0 (0.0%) | 0.0 |
| Total | 0 (0.0%) | 0.0 |
Fertility by Age by Marriage Status in Fairfield
| Age Bracket | Married | Unmarried |
| 15 to 19 years | 0 (0.0%) | 0 (0.0%) |
| 20 to 34 years | 0 (0.0%) | 0 (0.0%) |
| 35 to 50 years | 0 (0.0%) | 0 (0.0%) |
| Total | 0 (0.0%) | 0 (0.0%) |
Fertility by Education in Fairfield
| Educational Attainment | Women with Births | Births / 1,000 Women |
| Less than High School | 0 (0.0%) | 0.0 |
| High School Diploma | 0 (0.0%) | 0.0 |
| College or Associate's Degree | 0 (0.0%) | 0.0 |
| Bachelor's Degree | 0 (0.0%) | 0.0 |
| Graduate Degree | 0 (0.0%) | 0.0 |
| Total | 0 (0.0%) | 0.0 |
Fertility by Education by Marriage Status in Fairfield
| Educational Attainment | Married | Unmarried |
| Less than High School | 0 (0.0%) | 0 (0.0%) |
| High School Diploma | 0 (0.0%) | 0 (0.0%) |
| College or Associate's Degree | 0 (0.0%) | 0 (0.0%) |
| Bachelor's Degree | 0 (0.0%) | 0 (0.0%) |
| Graduate Degree | 0 (0.0%) | 0 (0.0%) |
| Total | 0 (0.0%) | 0 (0.0%) |
Employment Characteristics in Fairfield
Employment by Class of Employer in Fairfield
Among the 204 employed individuals in Fairfield, private company employees (132 | 64.7%), not-for-profit organizations (28 | 13.7%), and self-employed (not incorporated) (22 | 10.8%) make up the most common classes of employment.
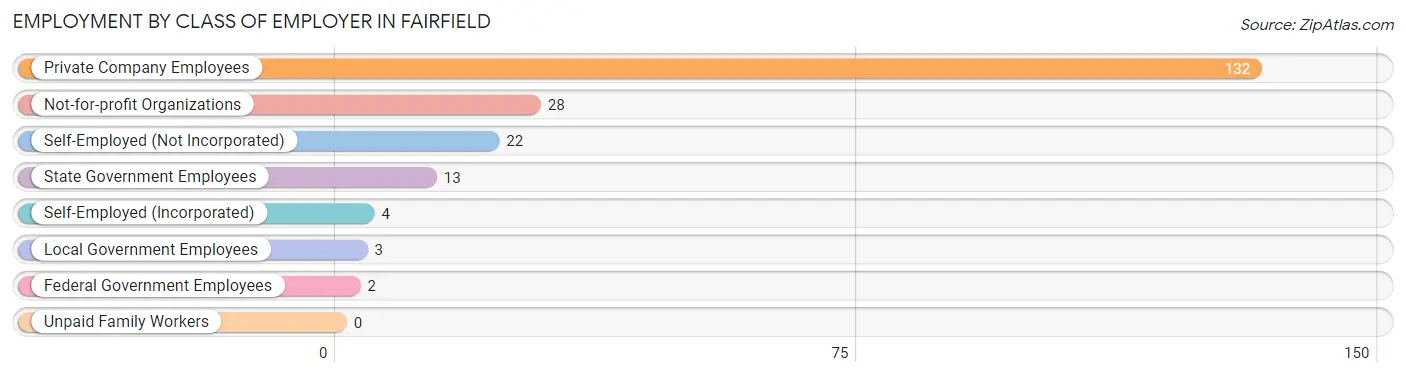
| Employer Class | # Employees | % Employees |
| Private Company Employees | 132 | 64.7% |
| Self-Employed (Incorporated) | 4 | 2.0% |
| Self-Employed (Not Incorporated) | 22 | 10.8% |
| Not-for-profit Organizations | 28 | 13.7% |
| Local Government Employees | 3 | 1.5% |
| State Government Employees | 13 | 6.4% |
| Federal Government Employees | 2 | 1.0% |
| Unpaid Family Workers | 0 | 0.0% |
| Total | 204 | 100.0% |
Employment Status by Age in Fairfield
According to the labor force statistics for Fairfield, out of the total population over 16 years of age (305), 67.9% or 207 individuals are in the labor force, with 1.4% or 3 of them unemployed. The age group with the highest labor force participation rate is 20 to 24 years, with 100.0% or 13 individuals in the labor force. Within the labor force, the 30 to 34 years age range has the highest percentage of unemployed individuals, with 5.3% or 2 of them being unemployed.
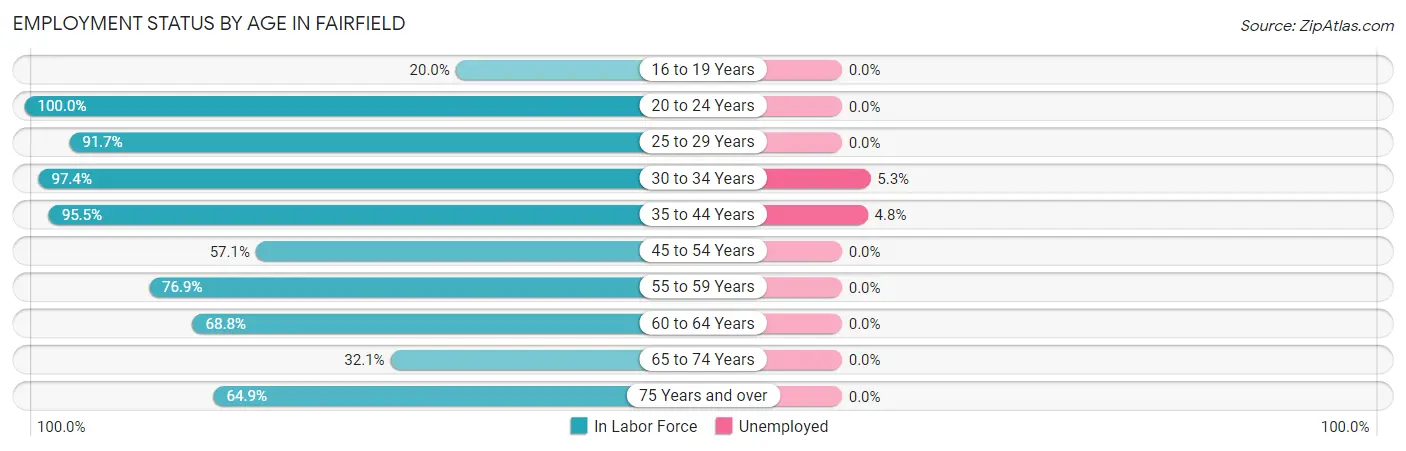
| Age Bracket | In Labor Force | Unemployed |
| 16 to 19 Years | 2 (20.0%) | 0 (0.0%) |
| 20 to 24 Years | 13 (100.0%) | 0 (0.0%) |
| 25 to 29 Years | 22 (91.7%) | 0 (0.0%) |
| 30 to 34 Years | 38 (97.4%) | 2 (5.3%) |
| 35 to 44 Years | 21 (95.5%) | 1 (4.8%) |
| 45 to 54 Years | 28 (57.1%) | 0 (0.0%) |
| 55 to 59 Years | 20 (76.9%) | 0 (0.0%) |
| 60 to 64 Years | 22 (68.8%) | 0 (0.0%) |
| 65 to 74 Years | 17 (32.1%) | 0 (0.0%) |
| 75 Years and over | 24 (64.9%) | 0 (0.0%) |
| Total | 207 (67.9%) | 3 (1.4%) |
Employment Status by Educational Attainment in Fairfield
According to labor force statistics for Fairfield, 78.6% of individuals (151) out of the total population between 25 and 64 years of age (192) are in the labor force, with 2.0% or 3 of them being unemployed. The group with the highest labor force participation rate are those with the educational attainment of less than high school, with 100.0% or 6 individuals in the labor force. Within the labor force, individuals with less than high school education have the highest percentage of unemployment, with 16.7% or 1 of them being unemployed.
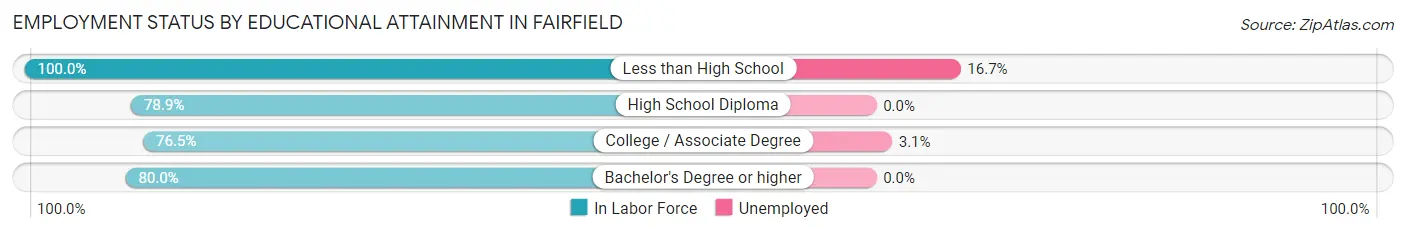
| Educational Attainment | In Labor Force | Unemployed |
| Less than High School | 6 (100.0%) | 1 (16.7%) |
| High School Diploma | 56 (78.9%) | 0 (0.0%) |
| College / Associate Degree | 65 (76.5%) | 3 (3.1%) |
| Bachelor's Degree or higher | 24 (80.0%) | 0 (0.0%) |
| Total | 151 (78.6%) | 4 (2.0%) |
Employment Occupations by Sex in Fairfield
Management, Business, Science and Arts Occupations
The most common Management, Business, Science and Arts occupations in Fairfield are Community & Social Service (25 | 12.2%), Education Instruction & Library (15 | 7.3%), Management (13 | 6.4%), Computers, Engineering & Science (12 | 5.9%), and Business & Financial (10 | 4.9%).
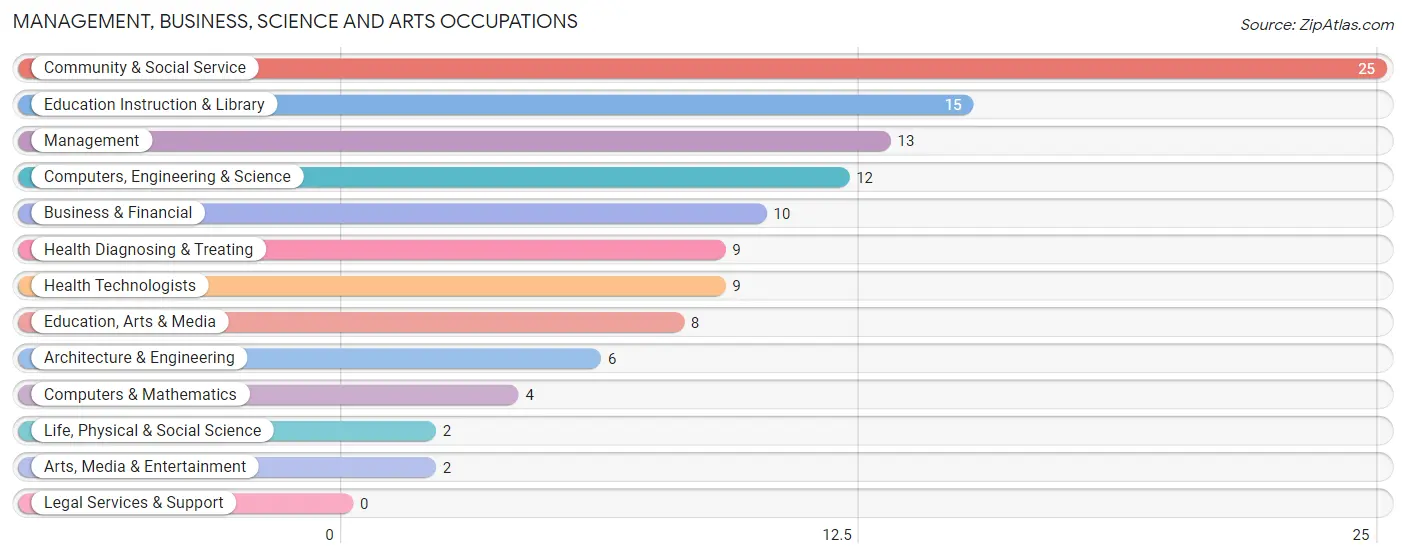
Management, Business, Science and Arts Occupations by Sex
Within the Management, Business, Science and Arts occupations in Fairfield, the most male-oriented occupations are Business & Financial (100.0%), Life, Physical & Social Science (100.0%), and Architecture & Engineering (83.3%), while the most female-oriented occupations are Computers & Mathematics (100.0%), Arts, Media & Entertainment (100.0%), and Health Diagnosing & Treating (100.0%).
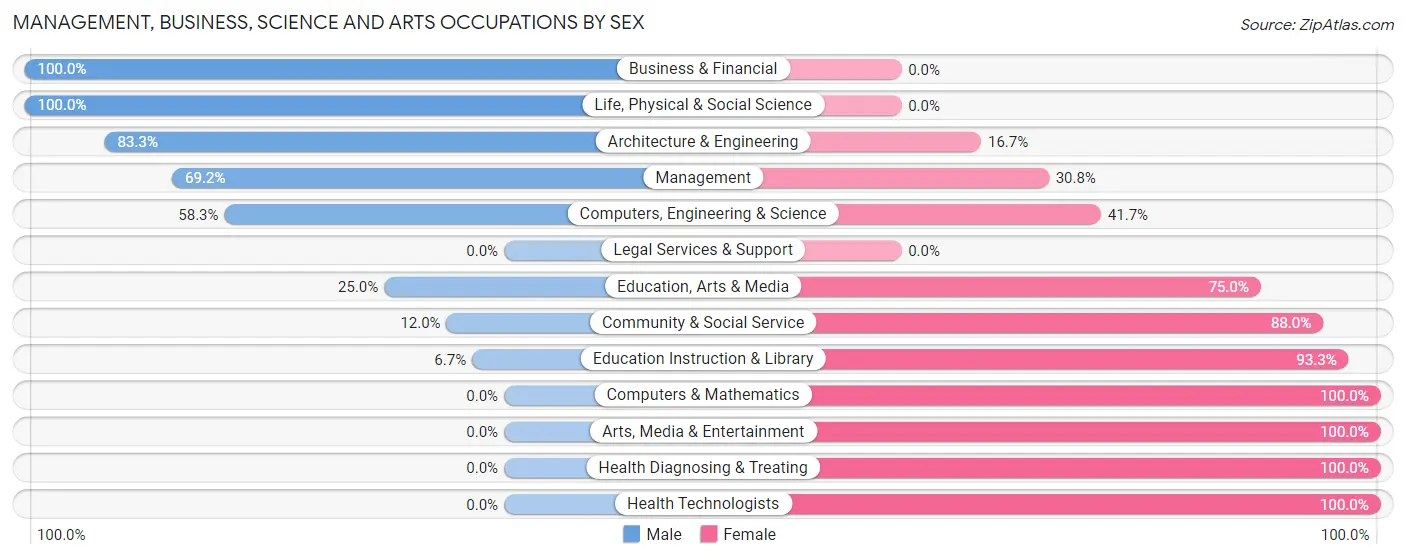
| Occupation | Male | Female |
| Management | 9 (69.2%) | 4 (30.8%) |
| Business & Financial | 10 (100.0%) | 0 (0.0%) |
| Computers, Engineering & Science | 7 (58.3%) | 5 (41.7%) |
| Computers & Mathematics | 0 (0.0%) | 4 (100.0%) |
| Architecture & Engineering | 5 (83.3%) | 1 (16.7%) |
| Life, Physical & Social Science | 2 (100.0%) | 0 (0.0%) |
| Community & Social Service | 3 (12.0%) | 22 (88.0%) |
| Education, Arts & Media | 2 (25.0%) | 6 (75.0%) |
| Legal Services & Support | 0 (0.0%) | 0 (0.0%) |
| Education Instruction & Library | 1 (6.7%) | 14 (93.3%) |
| Arts, Media & Entertainment | 0 (0.0%) | 2 (100.0%) |
| Health Diagnosing & Treating | 0 (0.0%) | 9 (100.0%) |
| Health Technologists | 0 (0.0%) | 9 (100.0%) |
| Total (Category) | 29 (42.0%) | 40 (58.0%) |
| Total (Overall) | 110 (53.9%) | 94 (46.1%) |
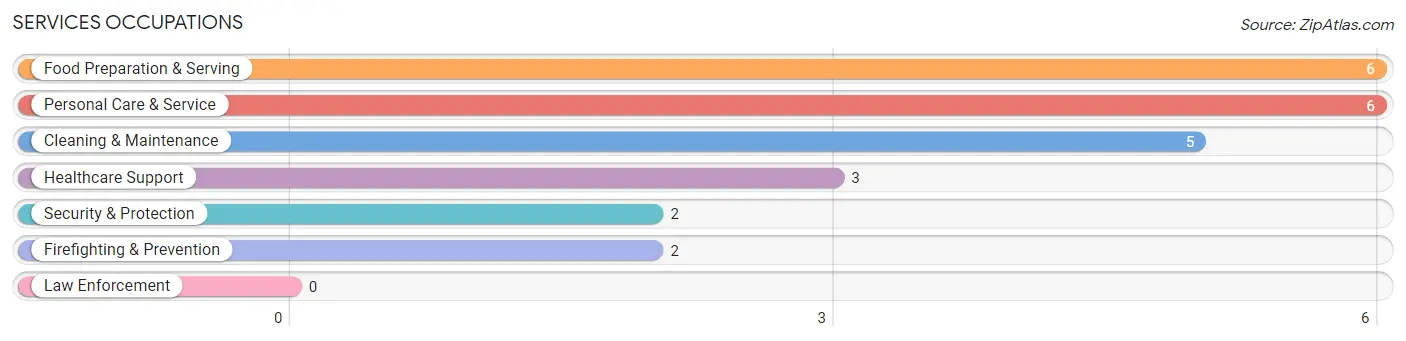
Services Occupations
The most common Services occupations in Fairfield are Food Preparation & Serving (6 | 2.9%), Personal Care & Service (6 | 2.9%), Cleaning & Maintenance (5 | 2.5%), Healthcare Support (3 | 1.5%), and Security & Protection (2 | 1.0%).
Services Occupations by Sex
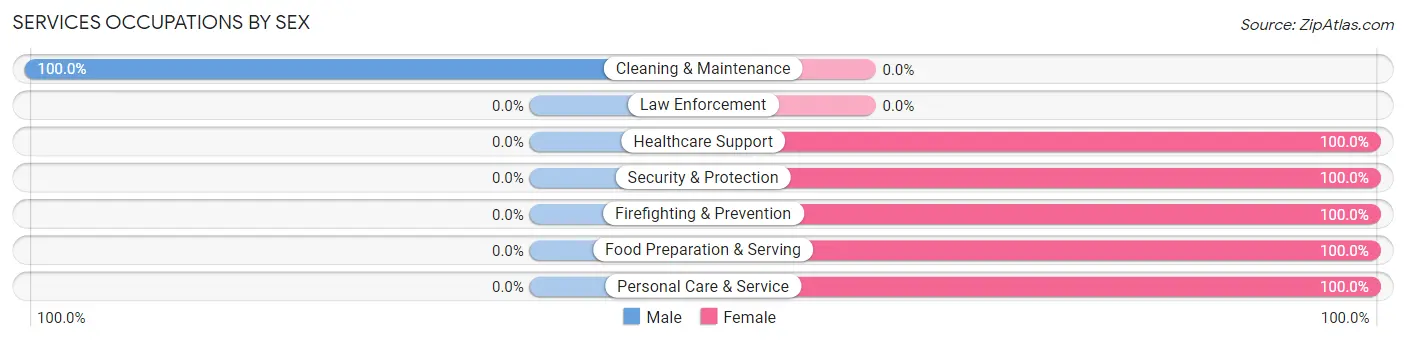
| Occupation | Male | Female |
| Healthcare Support | 0 (0.0%) | 3 (100.0%) |
| Security & Protection | 0 (0.0%) | 2 (100.0%) |
| Firefighting & Prevention | 0 (0.0%) | 2 (100.0%) |
| Law Enforcement | 0 (0.0%) | 0 (0.0%) |
| Food Preparation & Serving | 0 (0.0%) | 6 (100.0%) |
| Cleaning & Maintenance | 5 (100.0%) | 0 (0.0%) |
| Personal Care & Service | 0 (0.0%) | 6 (100.0%) |
| Total (Category) | 5 (22.7%) | 17 (77.3%) |
| Total (Overall) | 110 (53.9%) | 94 (46.1%) |
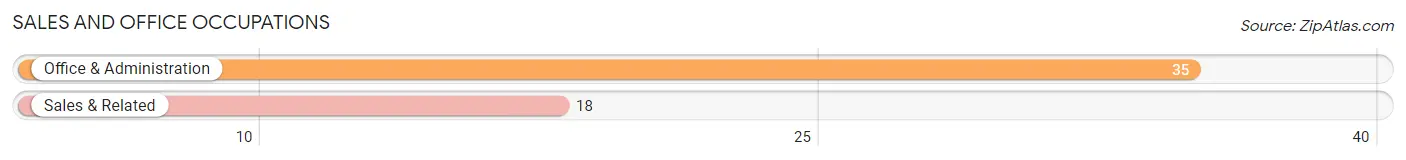
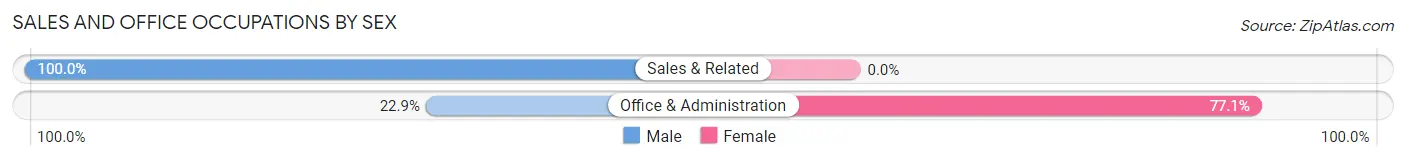
Sales and Office Occupations
The most common Sales and Office occupations in Fairfield are Office & Administration (35 | 17.2%), and Sales & Related (18 | 8.8%).
Sales and Office Occupations by Sex
| Occupation | Male | Female |
| Sales & Related | 18 (100.0%) | 0 (0.0%) |
| Office & Administration | 8 (22.9%) | 27 (77.1%) |
| Total (Category) | 26 (49.1%) | 27 (50.9%) |
| Total (Overall) | 110 (53.9%) | 94 (46.1%) |
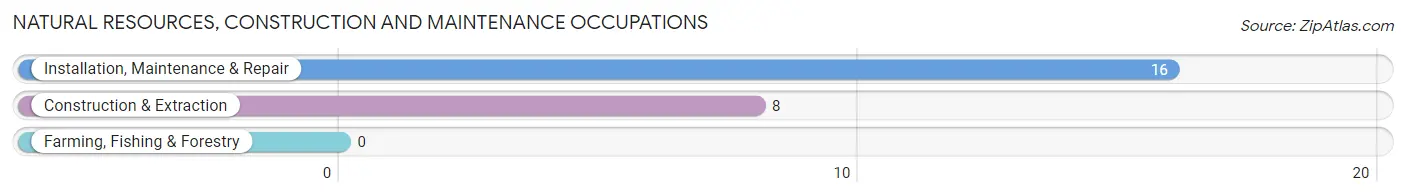
Natural Resources, Construction and Maintenance Occupations
The most common Natural Resources, Construction and Maintenance occupations in Fairfield are Installation, Maintenance & Repair (16 | 7.8%), and Construction & Extraction (8 | 3.9%).
Natural Resources, Construction and Maintenance Occupations by Sex
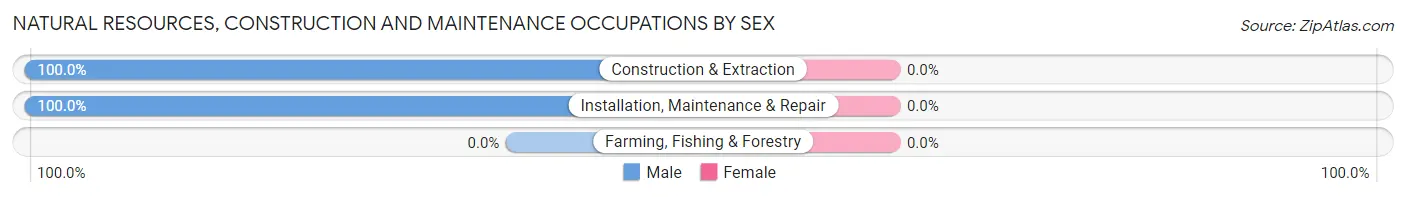
| Occupation | Male | Female |
| Farming, Fishing & Forestry | 0 (0.0%) | 0 (0.0%) |
| Construction & Extraction | 8 (100.0%) | 0 (0.0%) |
| Installation, Maintenance & Repair | 16 (100.0%) | 0 (0.0%) |
| Total (Category) | 24 (100.0%) | 0 (0.0%) |
| Total (Overall) | 110 (53.9%) | 94 (46.1%) |
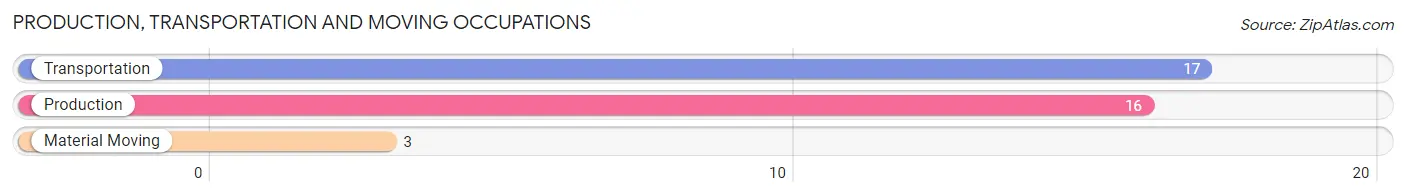
Production, Transportation and Moving Occupations
The most common Production, Transportation and Moving occupations in Fairfield are Transportation (17 | 8.3%), Production (16 | 7.8%), and Material Moving (3 | 1.5%).
Production, Transportation and Moving Occupations by Sex
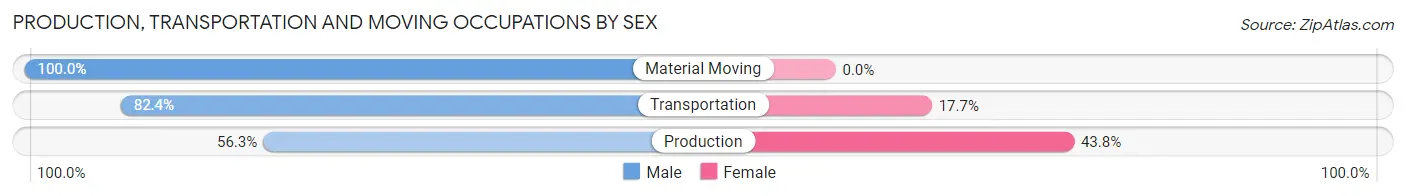
| Occupation | Male | Female |
| Production | 9 (56.2%) | 7 (43.8%) |
| Transportation | 14 (82.4%) | 3 (17.6%) |
| Material Moving | 3 (100.0%) | 0 (0.0%) |
| Total (Category) | 26 (72.2%) | 10 (27.8%) |
| Total (Overall) | 110 (53.9%) | 94 (46.1%) |
Employment Industries by Sex in Fairfield
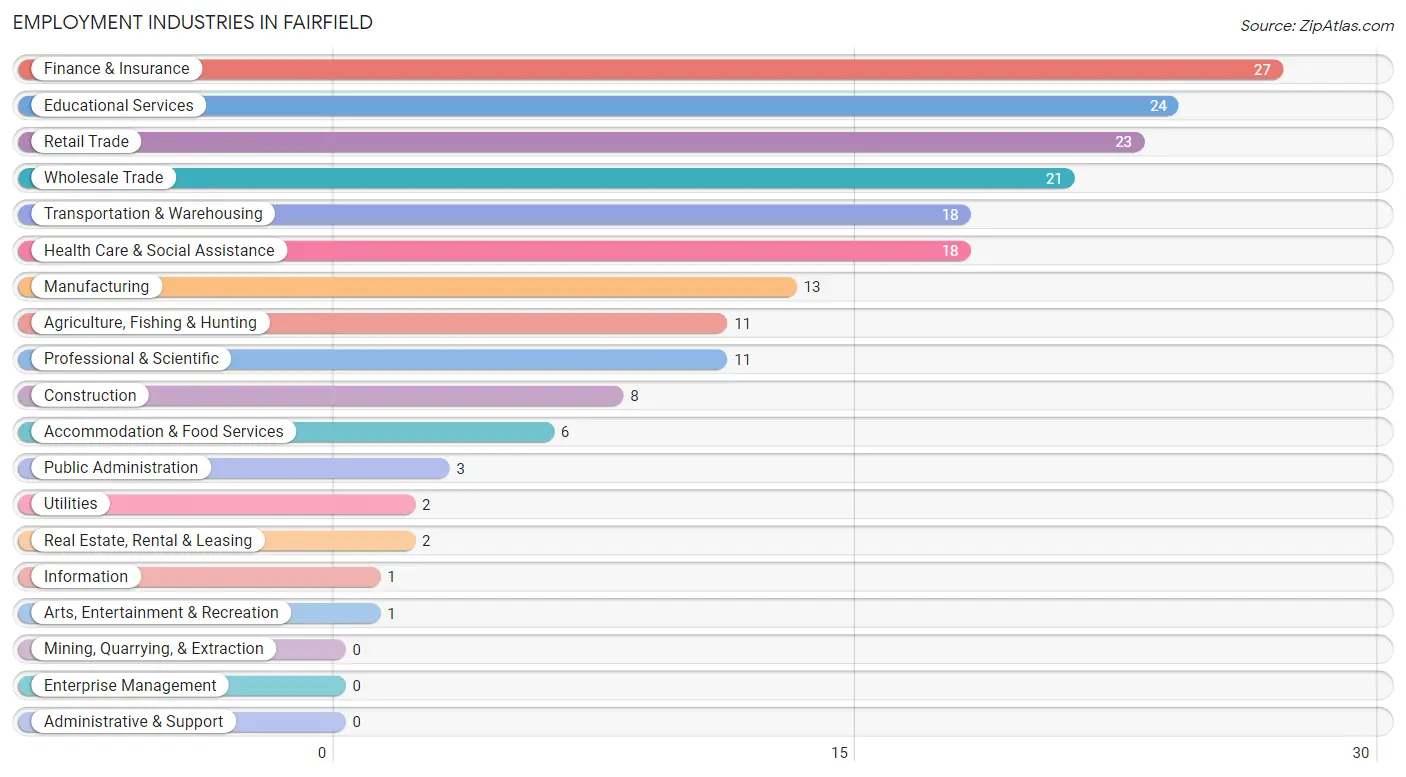
Employment Industries in Fairfield
The major employment industries in Fairfield include Finance & Insurance (27 | 13.2%), Educational Services (24 | 11.8%), Retail Trade (23 | 11.3%), Wholesale Trade (21 | 10.3%), and Transportation & Warehousing (18 | 8.8%).
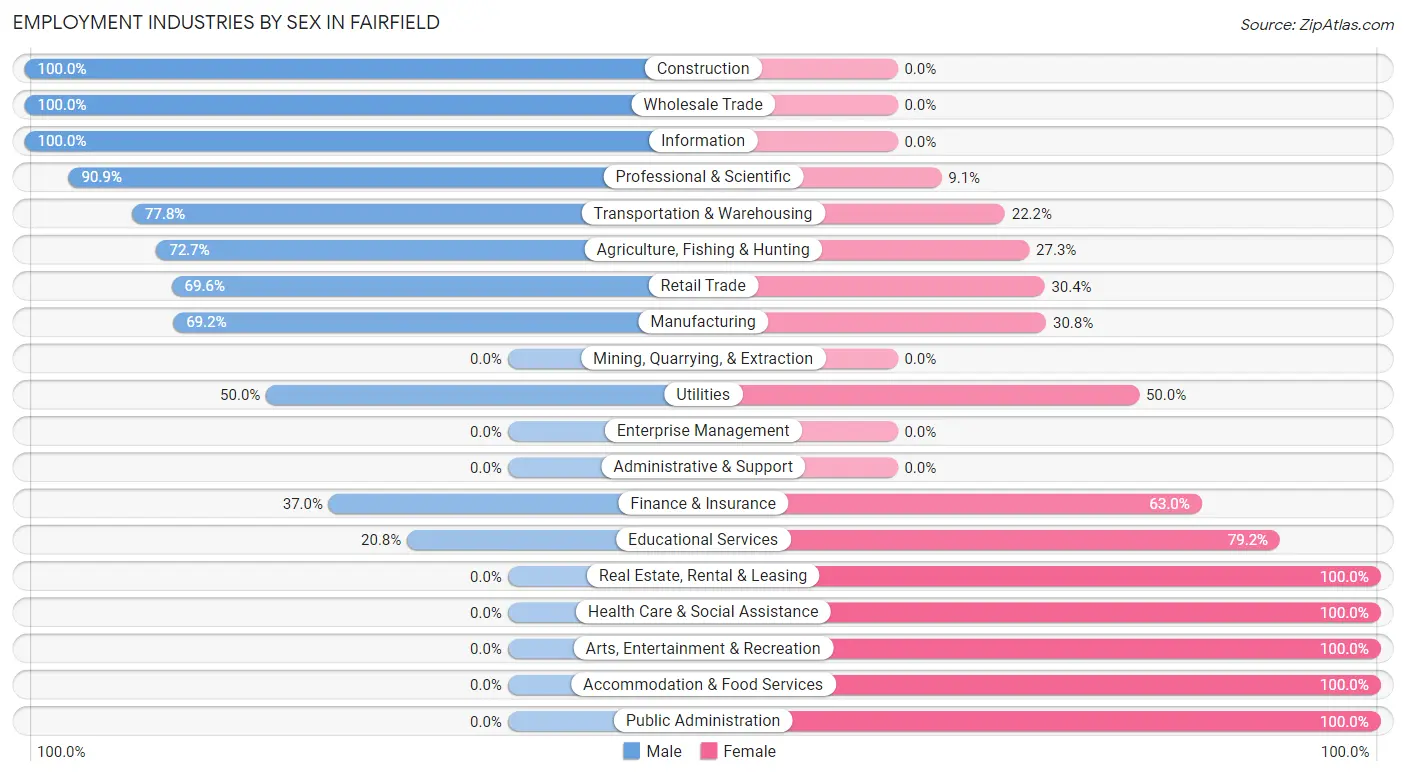
Employment Industries by Sex in Fairfield
The Fairfield industries that see more men than women are Construction (100.0%), Wholesale Trade (100.0%), and Information (100.0%), whereas the industries that tend to have a higher number of women are Real Estate, Rental & Leasing (100.0%), Health Care & Social Assistance (100.0%), and Arts, Entertainment & Recreation (100.0%).
| Industry | Male | Female |
| Agriculture, Fishing & Hunting | 8 (72.7%) | 3 (27.3%) |
| Mining, Quarrying, & Extraction | 0 (0.0%) | 0 (0.0%) |
| Construction | 8 (100.0%) | 0 (0.0%) |
| Manufacturing | 9 (69.2%) | 4 (30.8%) |
| Wholesale Trade | 21 (100.0%) | 0 (0.0%) |
| Retail Trade | 16 (69.6%) | 7 (30.4%) |
| Transportation & Warehousing | 14 (77.8%) | 4 (22.2%) |
| Utilities | 1 (50.0%) | 1 (50.0%) |
| Information | 1 (100.0%) | 0 (0.0%) |
| Finance & Insurance | 10 (37.0%) | 17 (63.0%) |
| Real Estate, Rental & Leasing | 0 (0.0%) | 2 (100.0%) |
| Professional & Scientific | 10 (90.9%) | 1 (9.1%) |
| Enterprise Management | 0 (0.0%) | 0 (0.0%) |
| Administrative & Support | 0 (0.0%) | 0 (0.0%) |
| Educational Services | 5 (20.8%) | 19 (79.2%) |
| Health Care & Social Assistance | 0 (0.0%) | 18 (100.0%) |
| Arts, Entertainment & Recreation | 0 (0.0%) | 1 (100.0%) |
| Accommodation & Food Services | 0 (0.0%) | 6 (100.0%) |
| Public Administration | 0 (0.0%) | 3 (100.0%) |
| Total | 110 (53.9%) | 94 (46.1%) |
Education in Fairfield
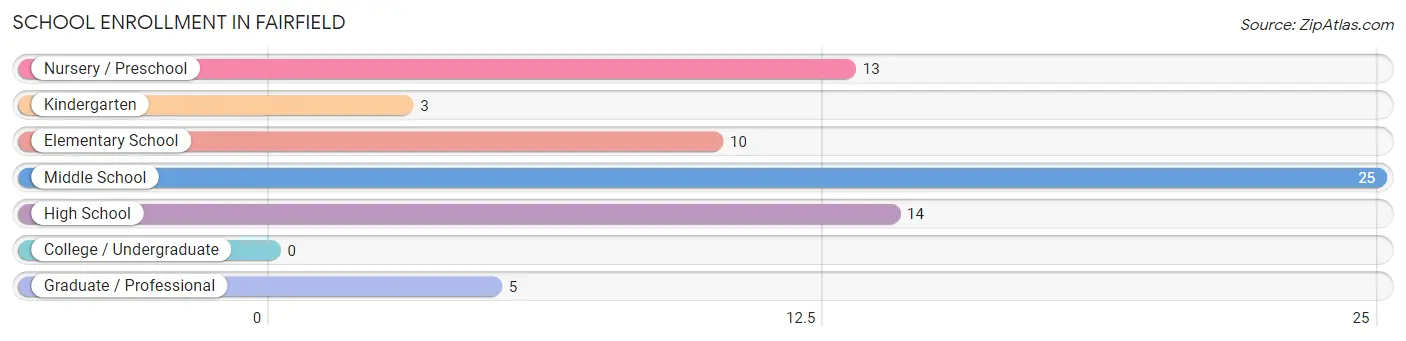
School Enrollment in Fairfield
The most common levels of schooling among the 70 students in Fairfield are middle school (25 | 35.7%), high school (14 | 20.0%), and nursery / preschool (13 | 18.6%).
| School Level | # Students | % Students |
| Nursery / Preschool | 13 | 18.6% |
| Kindergarten | 3 | 4.3% |
| Elementary School | 10 | 14.3% |
| Middle School | 25 | 35.7% |
| High School | 14 | 20.0% |
| College / Undergraduate | 0 | 0.0% |
| Graduate / Professional | 5 | 7.1% |
| Total | 70 | 100.0% |
School Enrollment by Age by Funding Source in Fairfield
Out of a total of 70 students who are enrolled in schools in Fairfield, 12 (17.1%) attend a private institution, while the remaining 58 (82.9%) are enrolled in public schools. The age group of 10 to 14 year olds has the highest likelihood of being enrolled in private schools, with 8 (30.8% in the age bracket) enrolled. Conversely, the age group of 3 to 4 year olds has the lowest likelihood of being enrolled in a private school, with 9 (100.0% in the age bracket) attending a public institution.
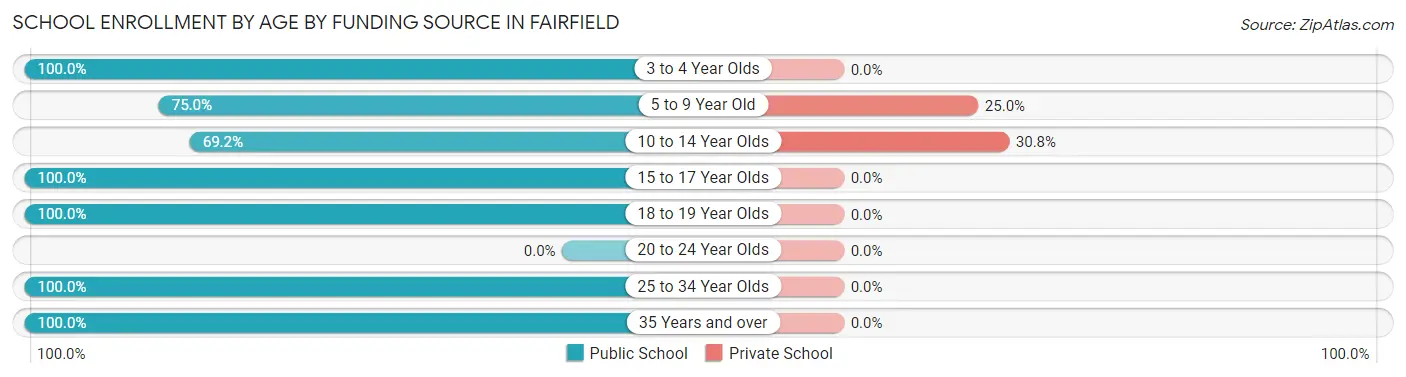
| Age Bracket | Public School | Private School |
| 3 to 4 Year Olds | 9 (100.0%) | 0 (0.0%) |
| 5 to 9 Year Old | 12 (75.0%) | 4 (25.0%) |
| 10 to 14 Year Olds | 18 (69.2%) | 8 (30.8%) |
| 15 to 17 Year Olds | 11 (100.0%) | 0 (0.0%) |
| 18 to 19 Year Olds | 3 (100.0%) | 0 (0.0%) |
| 20 to 24 Year Olds | 0 (0.0%) | 0 (0.0%) |
| 25 to 34 Year Olds | 4 (100.0%) | 0 (0.0%) |
| 35 Years and over | 1 (100.0%) | 0 (0.0%) |
| Total | 58 (82.9%) | 12 (17.1%) |
Educational Attainment by Field of Study in Fairfield
Education (11 | 24.4%), science & technology (10 | 22.2%), business (7 | 15.6%), bio, nature & agricultural (4 | 8.9%), and literature & languages (3 | 6.7%) are the most common fields of study among 45 individuals in Fairfield who have obtained a bachelor's degree or higher.
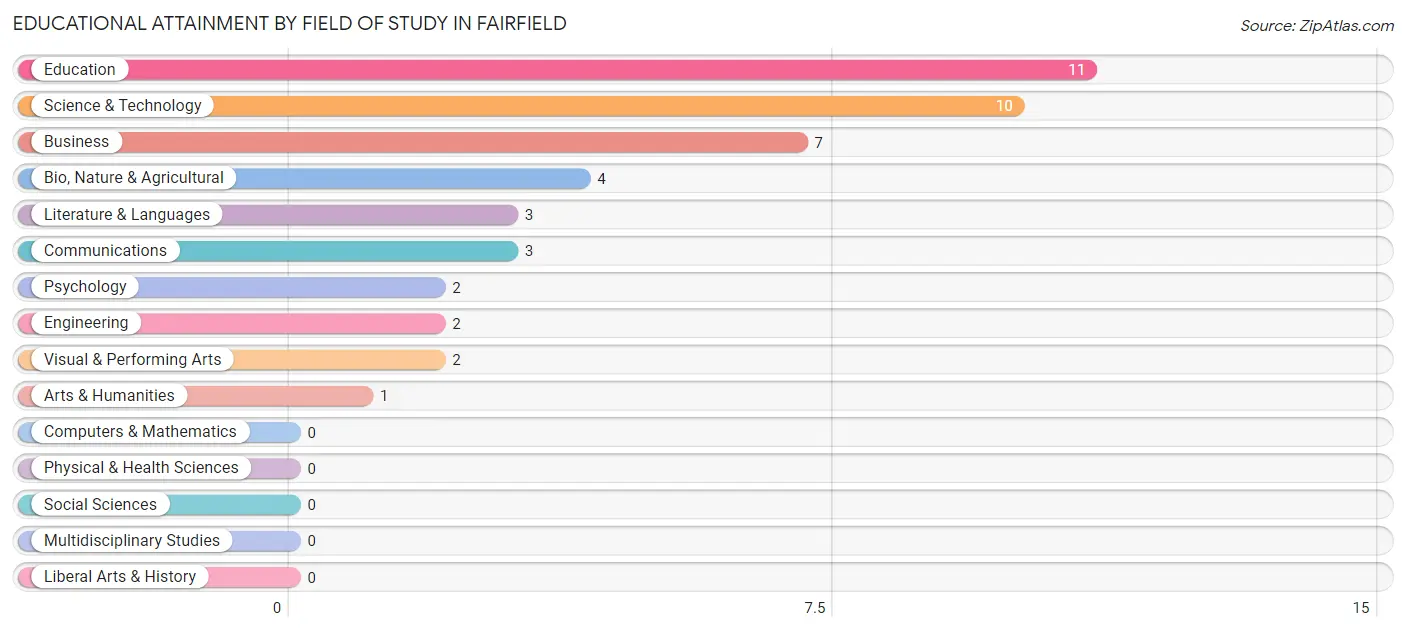
| Field of Study | # Graduates | % Graduates |
| Computers & Mathematics | 0 | 0.0% |
| Bio, Nature & Agricultural | 4 | 8.9% |
| Physical & Health Sciences | 0 | 0.0% |
| Psychology | 2 | 4.4% |
| Social Sciences | 0 | 0.0% |
| Engineering | 2 | 4.4% |
| Multidisciplinary Studies | 0 | 0.0% |
| Science & Technology | 10 | 22.2% |
| Business | 7 | 15.6% |
| Education | 11 | 24.4% |
| Literature & Languages | 3 | 6.7% |
| Liberal Arts & History | 0 | 0.0% |
| Visual & Performing Arts | 2 | 4.4% |
| Communications | 3 | 6.7% |
| Arts & Humanities | 1 | 2.2% |
| Total | 45 | 100.0% |
Transportation & Commute in Fairfield
Vehicle Availability by Sex in Fairfield
The most prevalent vehicle ownership categories in Fairfield are males with 2 vehicles (47, accounting for 42.7%) and females with 2 vehicles (41, making up 50.0%).
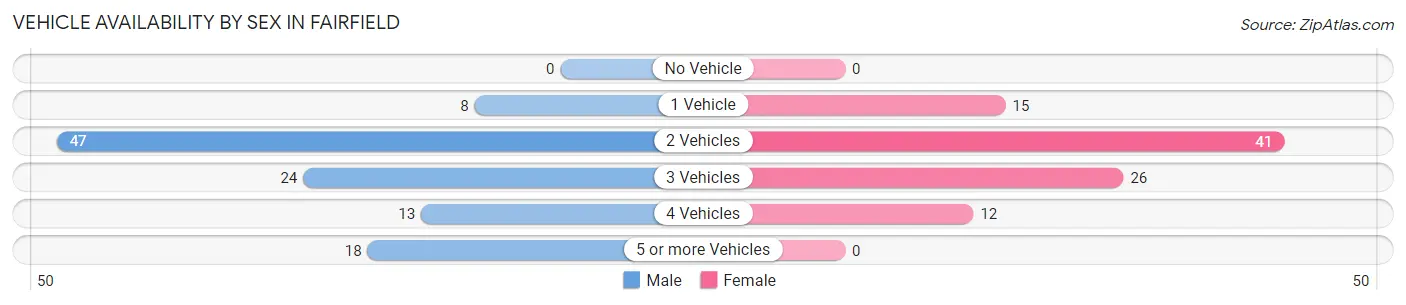
| Vehicles Available | Male | Female |
| No Vehicle | 0 (0.0%) | 0 (0.0%) |
| 1 Vehicle | 8 (7.3%) | 15 (16.0%) |
| 2 Vehicles | 47 (42.7%) | 41 (43.6%) |
| 3 Vehicles | 24 (21.8%) | 26 (27.7%) |
| 4 Vehicles | 13 (11.8%) | 12 (12.8%) |
| 5 or more Vehicles | 18 (16.4%) | 0 (0.0%) |
| Total | 110 (100.0%) | 94 (100.0%) |
Commute Time in Fairfield
The most frequently occuring commute durations in Fairfield are 35 to 39 minutes (29 commuters, 16.0%), 5 to 9 minutes (28 commuters, 15.5%), and 60 to 89 minutes (24 commuters, 13.3%).
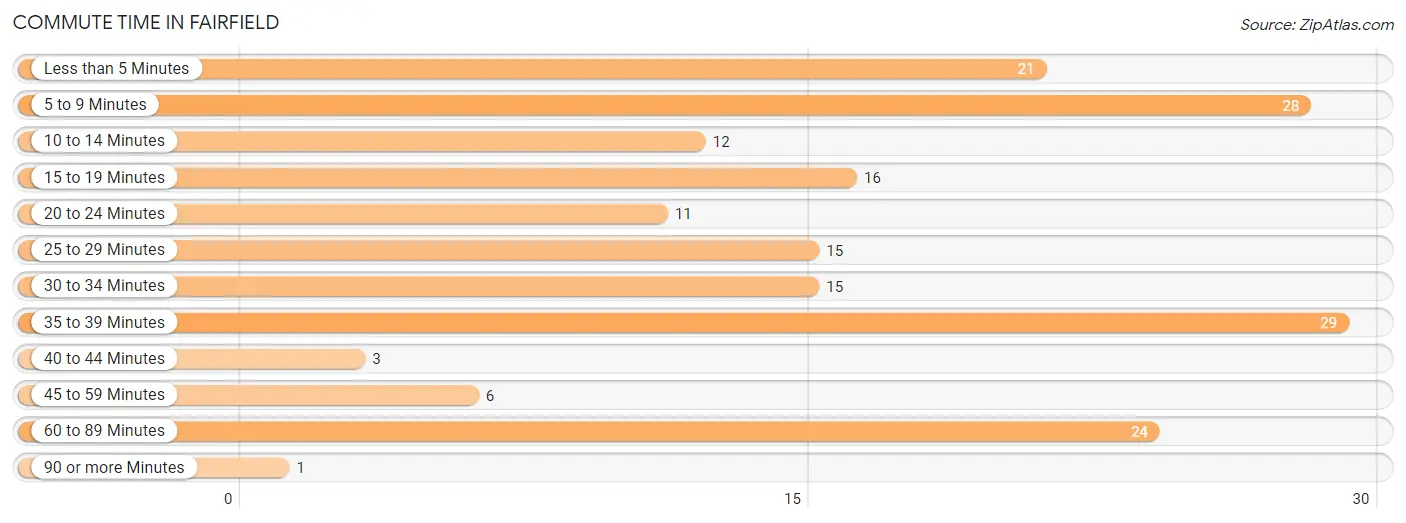
| Commute Time | # Commuters | % Commuters |
| Less than 5 Minutes | 21 | 11.6% |
| 5 to 9 Minutes | 28 | 15.5% |
| 10 to 14 Minutes | 12 | 6.6% |
| 15 to 19 Minutes | 16 | 8.8% |
| 20 to 24 Minutes | 11 | 6.1% |
| 25 to 29 Minutes | 15 | 8.3% |
| 30 to 34 Minutes | 15 | 8.3% |
| 35 to 39 Minutes | 29 | 16.0% |
| 40 to 44 Minutes | 3 | 1.7% |
| 45 to 59 Minutes | 6 | 3.3% |
| 60 to 89 Minutes | 24 | 13.3% |
| 90 or more Minutes | 1 | 0.5% |
Commute Time by Sex in Fairfield
The most common commute times in Fairfield are less than 5 minutes (16 commuters, 15.4%) for males and 5 to 9 minutes (17 commuters, 22.1%) for females.
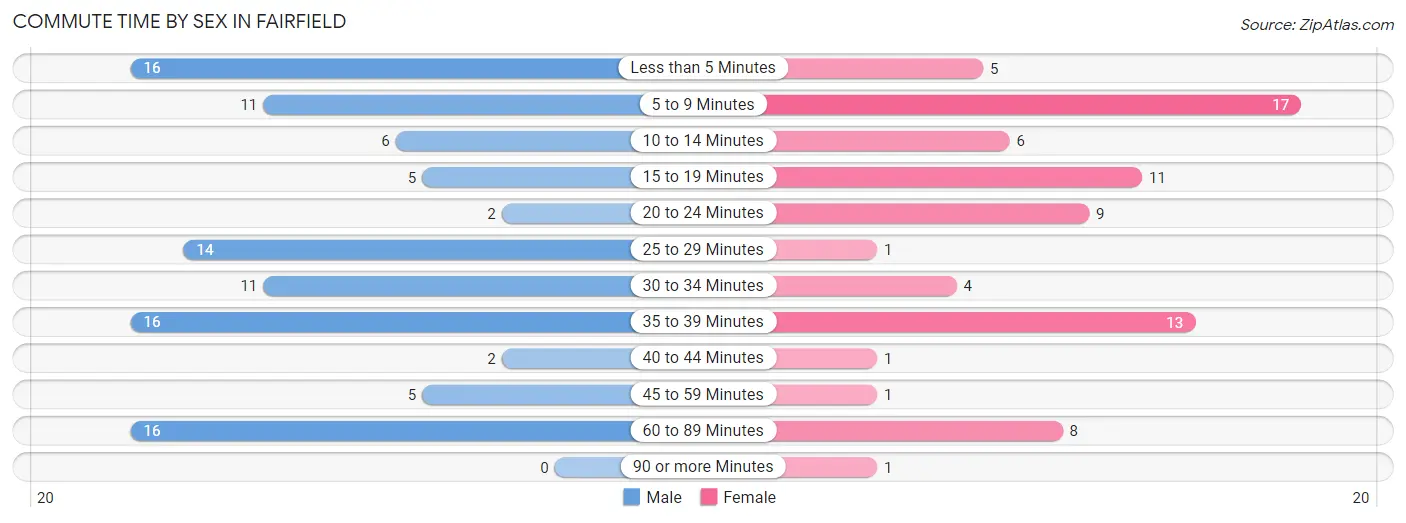
| Commute Time | Male | Female |
| Less than 5 Minutes | 16 (15.4%) | 5 (6.5%) |
| 5 to 9 Minutes | 11 (10.6%) | 17 (22.1%) |
| 10 to 14 Minutes | 6 (5.8%) | 6 (7.8%) |
| 15 to 19 Minutes | 5 (4.8%) | 11 (14.3%) |
| 20 to 24 Minutes | 2 (1.9%) | 9 (11.7%) |
| 25 to 29 Minutes | 14 (13.5%) | 1 (1.3%) |
| 30 to 34 Minutes | 11 (10.6%) | 4 (5.2%) |
| 35 to 39 Minutes | 16 (15.4%) | 13 (16.9%) |
| 40 to 44 Minutes | 2 (1.9%) | 1 (1.3%) |
| 45 to 59 Minutes | 5 (4.8%) | 1 (1.3%) |
| 60 to 89 Minutes | 16 (15.4%) | 8 (10.4%) |
| 90 or more Minutes | 0 (0.0%) | 1 (1.3%) |
Time of Departure to Work by Sex in Fairfield
The most frequent times of departure to work in Fairfield are 5:30 AM to 5:59 AM (26, 25.0%) for males and 7:30 AM to 7:59 AM (33, 42.9%) for females.
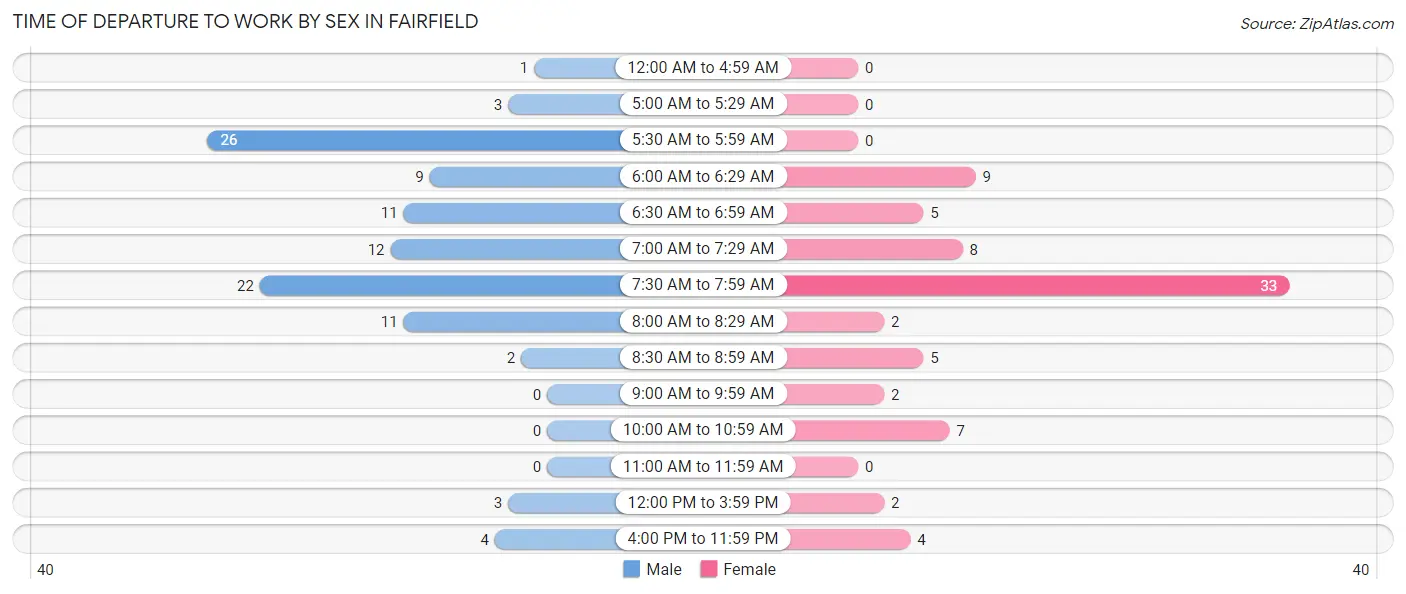
| Time of Departure | Male | Female |
| 12:00 AM to 4:59 AM | 1 (1.0%) | 0 (0.0%) |
| 5:00 AM to 5:29 AM | 3 (2.9%) | 0 (0.0%) |
| 5:30 AM to 5:59 AM | 26 (25.0%) | 0 (0.0%) |
| 6:00 AM to 6:29 AM | 9 (8.6%) | 9 (11.7%) |
| 6:30 AM to 6:59 AM | 11 (10.6%) | 5 (6.5%) |
| 7:00 AM to 7:29 AM | 12 (11.5%) | 8 (10.4%) |
| 7:30 AM to 7:59 AM | 22 (21.1%) | 33 (42.9%) |
| 8:00 AM to 8:29 AM | 11 (10.6%) | 2 (2.6%) |
| 8:30 AM to 8:59 AM | 2 (1.9%) | 5 (6.5%) |
| 9:00 AM to 9:59 AM | 0 (0.0%) | 2 (2.6%) |
| 10:00 AM to 10:59 AM | 0 (0.0%) | 7 (9.1%) |
| 11:00 AM to 11:59 AM | 0 (0.0%) | 0 (0.0%) |
| 12:00 PM to 3:59 PM | 3 (2.9%) | 2 (2.6%) |
| 4:00 PM to 11:59 PM | 4 (3.8%) | 4 (5.2%) |
| Total | 104 (100.0%) | 77 (100.0%) |
Housing Occupancy in Fairfield
Occupancy by Ownership in Fairfield
Of the total 171 dwellings in Fairfield, owner-occupied units account for 134 (78.4%), while renter-occupied units make up 37 (21.6%).
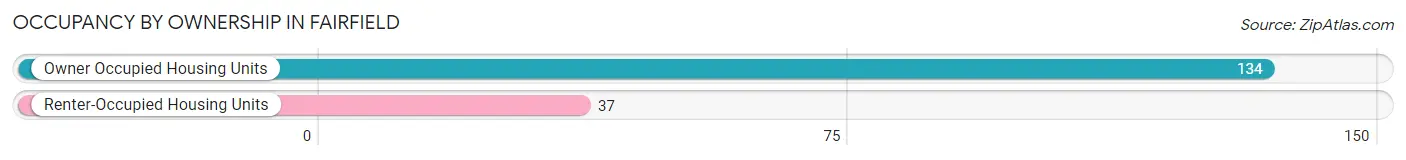
| Occupancy | # Housing Units | % Housing Units |
| Owner Occupied Housing Units | 134 | 78.4% |
| Renter-Occupied Housing Units | 37 | 21.6% |
| Total Occupied Housing Units | 171 | 100.0% |
Occupancy by Household Size in Fairfield
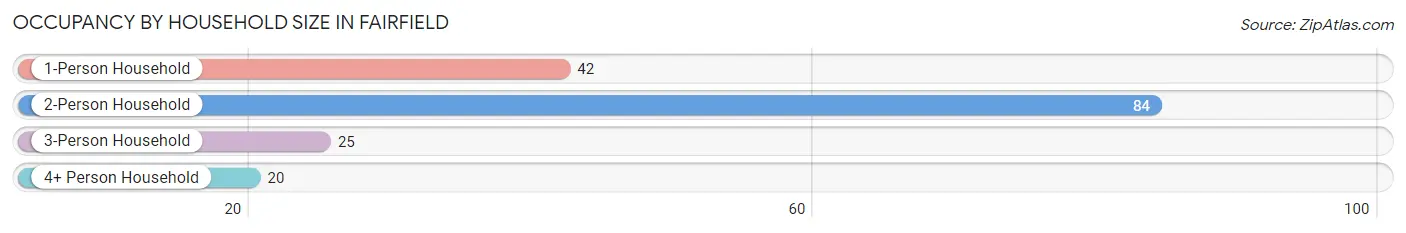
| Household Size | # Housing Units | % Housing Units |
| 1-Person Household | 42 | 24.6% |
| 2-Person Household | 84 | 49.1% |
| 3-Person Household | 25 | 14.6% |
| 4+ Person Household | 20 | 11.7% |
| Total Housing Units | 171 | 100.0% |
Occupancy by Ownership by Household Size in Fairfield
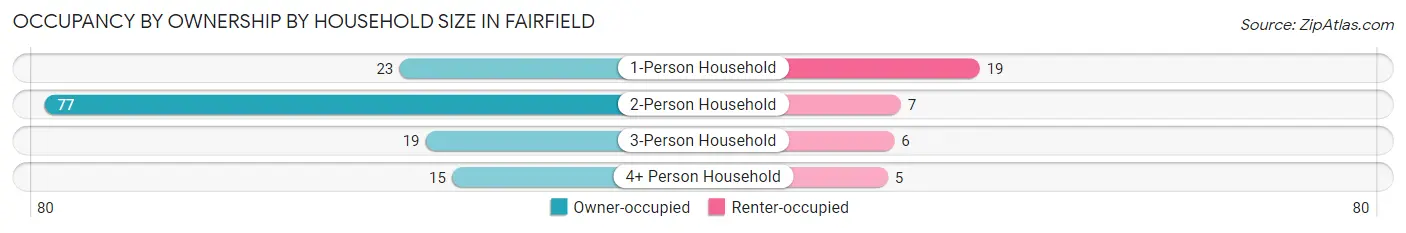
| Household Size | Owner-occupied | Renter-occupied |
| 1-Person Household | 23 (54.8%) | 19 (45.2%) |
| 2-Person Household | 77 (91.7%) | 7 (8.3%) |
| 3-Person Household | 19 (76.0%) | 6 (24.0%) |
| 4+ Person Household | 15 (75.0%) | 5 (25.0%) |
| Total Housing Units | 134 (78.4%) | 37 (21.6%) |
Occupancy by Educational Attainment in Fairfield
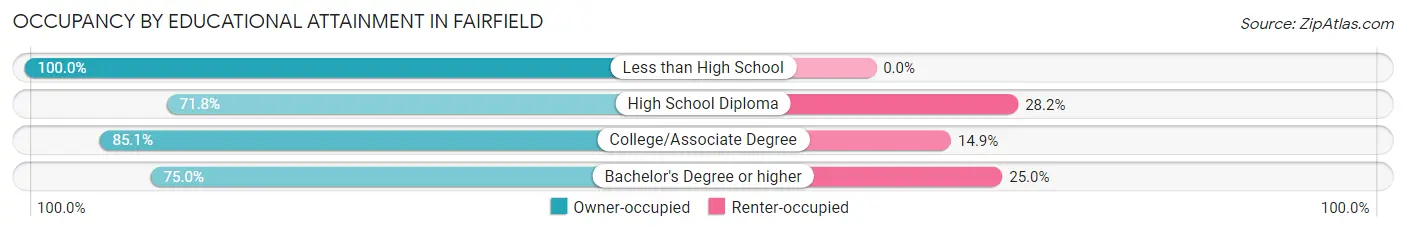
| Household Size | Owner-occupied | Renter-occupied |
| Less than High School | 2 (100.0%) | 0 (0.0%) |
| High School Diploma | 51 (71.8%) | 20 (28.2%) |
| College/Associate Degree | 63 (85.1%) | 11 (14.9%) |
| Bachelor's Degree or higher | 18 (75.0%) | 6 (25.0%) |
Occupancy by Age of Householder in Fairfield
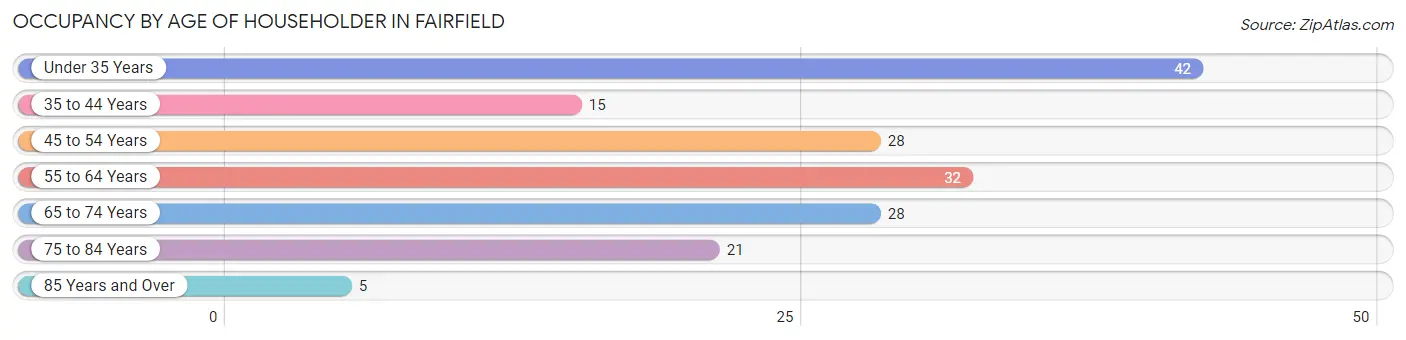
| Age Bracket | # Households | % Households |
| Under 35 Years | 42 | 24.6% |
| 35 to 44 Years | 15 | 8.8% |
| 45 to 54 Years | 28 | 16.4% |
| 55 to 64 Years | 32 | 18.7% |
| 65 to 74 Years | 28 | 16.4% |
| 75 to 84 Years | 21 | 12.3% |
| 85 Years and Over | 5 | 2.9% |
| Total | 171 | 100.0% |
Housing Finances in Fairfield
Median Income by Occupancy in Fairfield
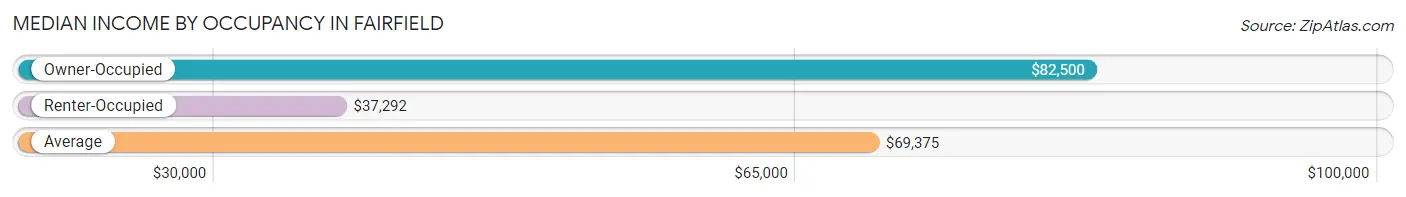
| Occupancy Type | # Households | Median Income |
| Owner-Occupied | 134 (78.4%) | $82,500 |
| Renter-Occupied | 37 (21.6%) | $37,292 |
| Average | 171 (100.0%) | $69,375 |
Occupancy by Householder Income Bracket in Fairfield
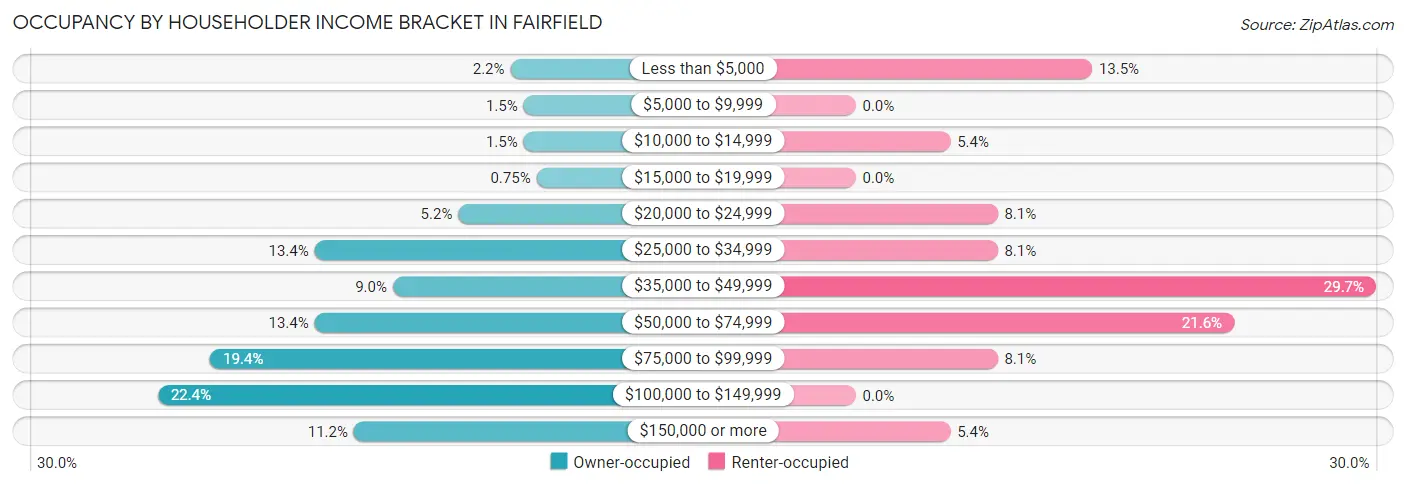
| Income Bracket | Owner-occupied | Renter-occupied |
| Less than $5,000 | 3 (2.2%) | 5 (13.5%) |
| $5,000 to $9,999 | 2 (1.5%) | 0 (0.0%) |
| $10,000 to $14,999 | 2 (1.5%) | 2 (5.4%) |
| $15,000 to $19,999 | 1 (0.7%) | 0 (0.0%) |
| $20,000 to $24,999 | 7 (5.2%) | 3 (8.1%) |
| $25,000 to $34,999 | 18 (13.4%) | 3 (8.1%) |
| $35,000 to $49,999 | 12 (9.0%) | 11 (29.7%) |
| $50,000 to $74,999 | 18 (13.4%) | 8 (21.6%) |
| $75,000 to $99,999 | 26 (19.4%) | 3 (8.1%) |
| $100,000 to $149,999 | 30 (22.4%) | 0 (0.0%) |
| $150,000 or more | 15 (11.2%) | 2 (5.4%) |
| Total | 134 (100.0%) | 37 (100.0%) |
Monthly Housing Cost Tiers in Fairfield
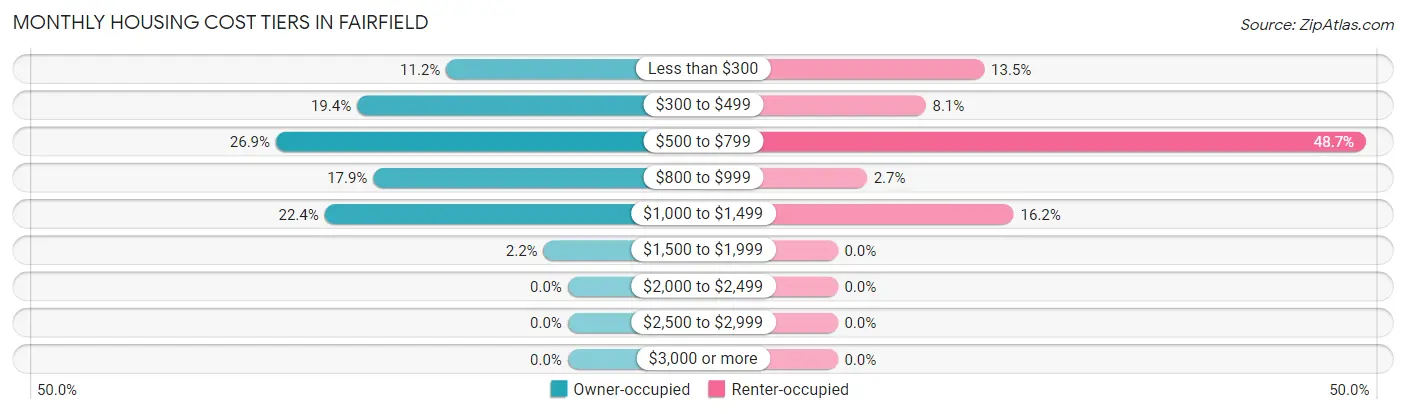
| Monthly Cost | Owner-occupied | Renter-occupied |
| Less than $300 | 15 (11.2%) | 5 (13.5%) |
| $300 to $499 | 26 (19.4%) | 3 (8.1%) |
| $500 to $799 | 36 (26.9%) | 18 (48.6%) |
| $800 to $999 | 24 (17.9%) | 1 (2.7%) |
| $1,000 to $1,499 | 30 (22.4%) | 6 (16.2%) |
| $1,500 to $1,999 | 3 (2.2%) | 0 (0.0%) |
| $2,000 to $2,499 | 0 (0.0%) | 0 (0.0%) |
| $2,500 to $2,999 | 0 (0.0%) | 0 (0.0%) |
| $3,000 or more | 0 (0.0%) | 0 (0.0%) |
| Total | 134 (100.0%) | 37 (100.0%) |
Physical Housing Characteristics in Fairfield
Housing Structures in Fairfield
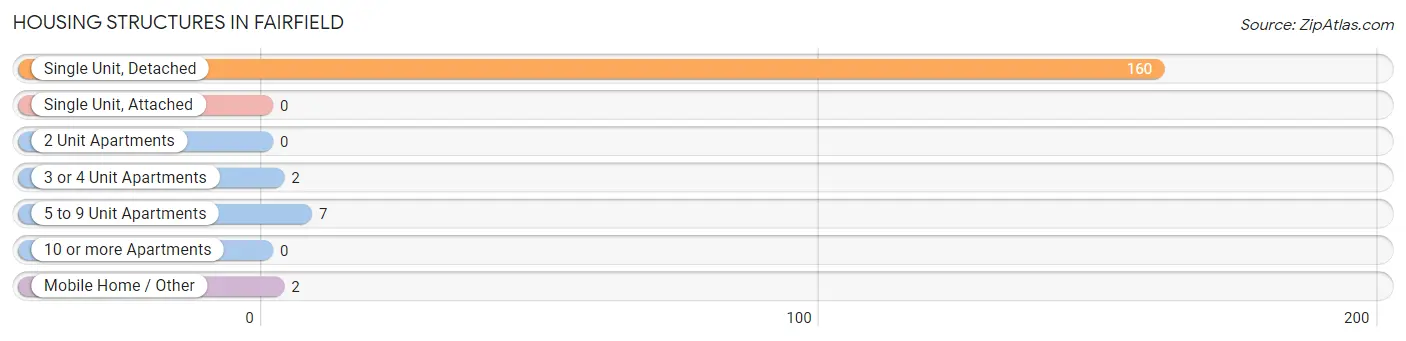
| Structure Type | # Housing Units | % Housing Units |
| Single Unit, Detached | 160 | 93.6% |
| Single Unit, Attached | 0 | 0.0% |
| 2 Unit Apartments | 0 | 0.0% |
| 3 or 4 Unit Apartments | 2 | 1.2% |
| 5 to 9 Unit Apartments | 7 | 4.1% |
| 10 or more Apartments | 0 | 0.0% |
| Mobile Home / Other | 2 | 1.2% |
| Total | 171 | 100.0% |
Housing Structures by Occupancy in Fairfield
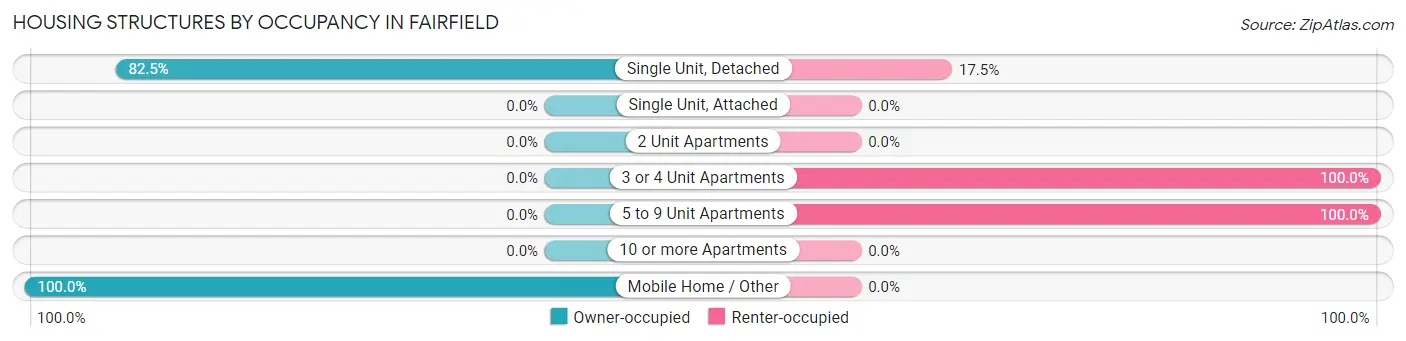
| Structure Type | Owner-occupied | Renter-occupied |
| Single Unit, Detached | 132 (82.5%) | 28 (17.5%) |
| Single Unit, Attached | 0 (0.0%) | 0 (0.0%) |
| 2 Unit Apartments | 0 (0.0%) | 0 (0.0%) |
| 3 or 4 Unit Apartments | 0 (0.0%) | 2 (100.0%) |
| 5 to 9 Unit Apartments | 0 (0.0%) | 7 (100.0%) |
| 10 or more Apartments | 0 (0.0%) | 0 (0.0%) |
| Mobile Home / Other | 2 (100.0%) | 0 (0.0%) |
| Total | 134 (78.4%) | 37 (21.6%) |
Housing Structures by Number of Rooms in Fairfield
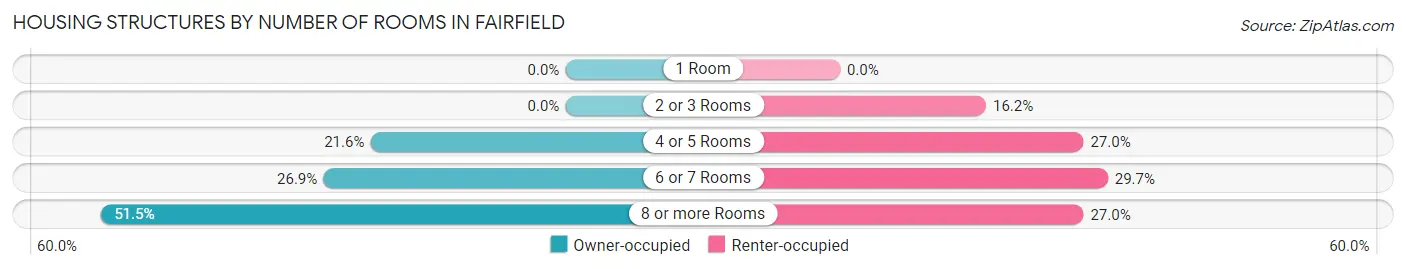
| Number of Rooms | Owner-occupied | Renter-occupied |
| 1 Room | 0 (0.0%) | 0 (0.0%) |
| 2 or 3 Rooms | 0 (0.0%) | 6 (16.2%) |
| 4 or 5 Rooms | 29 (21.6%) | 10 (27.0%) |
| 6 or 7 Rooms | 36 (26.9%) | 11 (29.7%) |
| 8 or more Rooms | 69 (51.5%) | 10 (27.0%) |
| Total | 134 (100.0%) | 37 (100.0%) |
Housing Structure by Heating Type in Fairfield
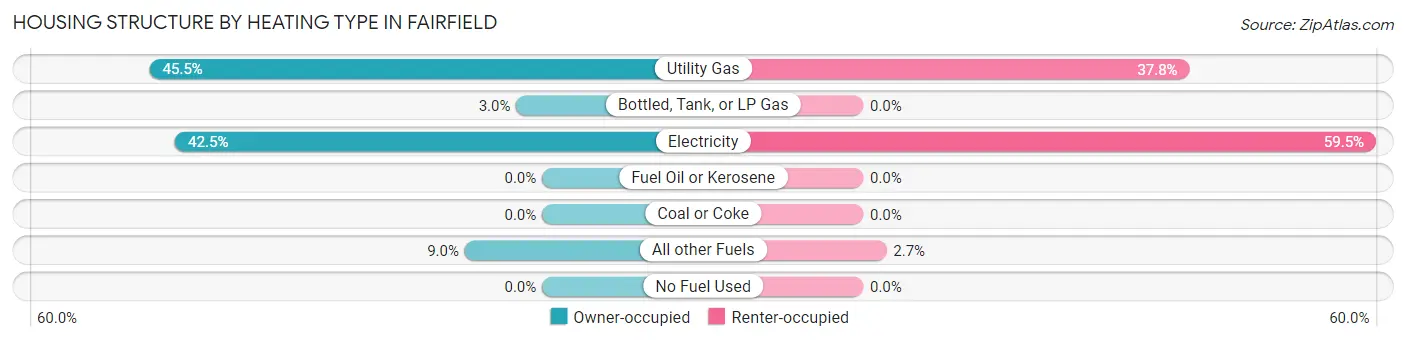
| Heating Type | Owner-occupied | Renter-occupied |
| Utility Gas | 61 (45.5%) | 14 (37.8%) |
| Bottled, Tank, or LP Gas | 4 (3.0%) | 0 (0.0%) |
| Electricity | 57 (42.5%) | 22 (59.5%) |
| Fuel Oil or Kerosene | 0 (0.0%) | 0 (0.0%) |
| Coal or Coke | 0 (0.0%) | 0 (0.0%) |
| All other Fuels | 12 (9.0%) | 1 (2.7%) |
| No Fuel Used | 0 (0.0%) | 0 (0.0%) |
| Total | 134 (100.0%) | 37 (100.0%) |
Household Vehicle Usage in Fairfield
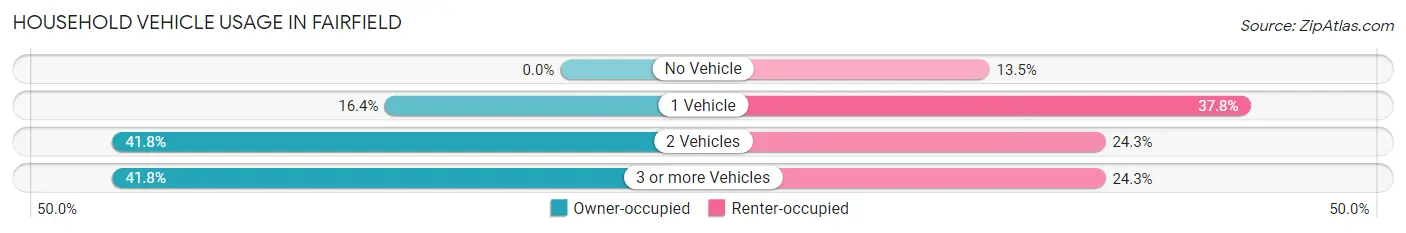
| Vehicles per Household | Owner-occupied | Renter-occupied |
| No Vehicle | 0 (0.0%) | 5 (13.5%) |
| 1 Vehicle | 22 (16.4%) | 14 (37.8%) |
| 2 Vehicles | 56 (41.8%) | 9 (24.3%) |
| 3 or more Vehicles | 56 (41.8%) | 9 (24.3%) |
| Total | 134 (100.0%) | 37 (100.0%) |
Real Estate & Mortgages in Fairfield
Real Estate and Mortgage Overview in Fairfield
| Characteristic | Without Mortgage | With Mortgage |
| Housing Units | 83 | 51 |
| Median Property Value | $58,300 | $102,500 |
| Median Household Income | $60,625 | $1 |
| Monthly Housing Costs | $503 | $0 |
| Real Estate Taxes | $1,193 | $1 |
Property Value by Mortgage Status in Fairfield
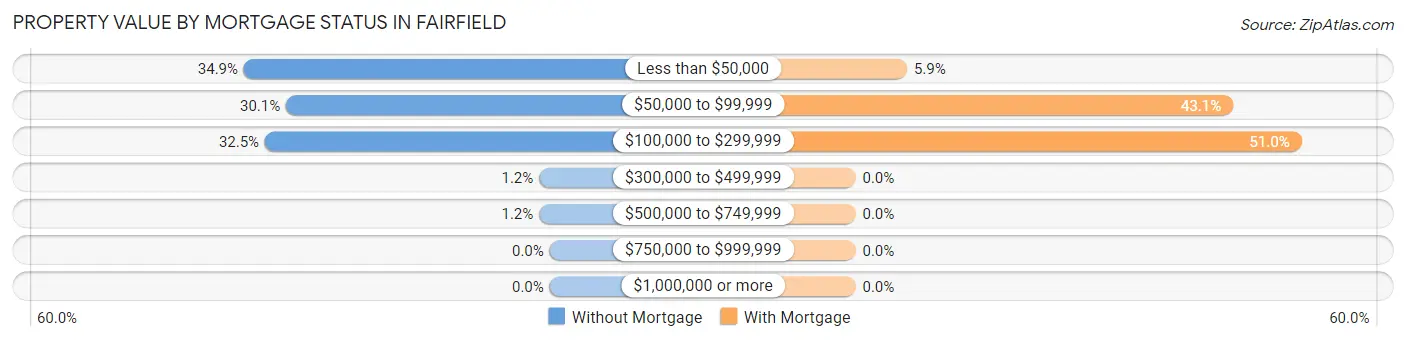
| Property Value | Without Mortgage | With Mortgage |
| Less than $50,000 | 29 (34.9%) | 3 (5.9%) |
| $50,000 to $99,999 | 25 (30.1%) | 22 (43.1%) |
| $100,000 to $299,999 | 27 (32.5%) | 26 (51.0%) |
| $300,000 to $499,999 | 1 (1.2%) | 0 (0.0%) |
| $500,000 to $749,999 | 1 (1.2%) | 0 (0.0%) |
| $750,000 to $999,999 | 0 (0.0%) | 0 (0.0%) |
| $1,000,000 or more | 0 (0.0%) | 0 (0.0%) |
| Total | 83 (100.0%) | 51 (100.0%) |
Household Income by Mortgage Status in Fairfield
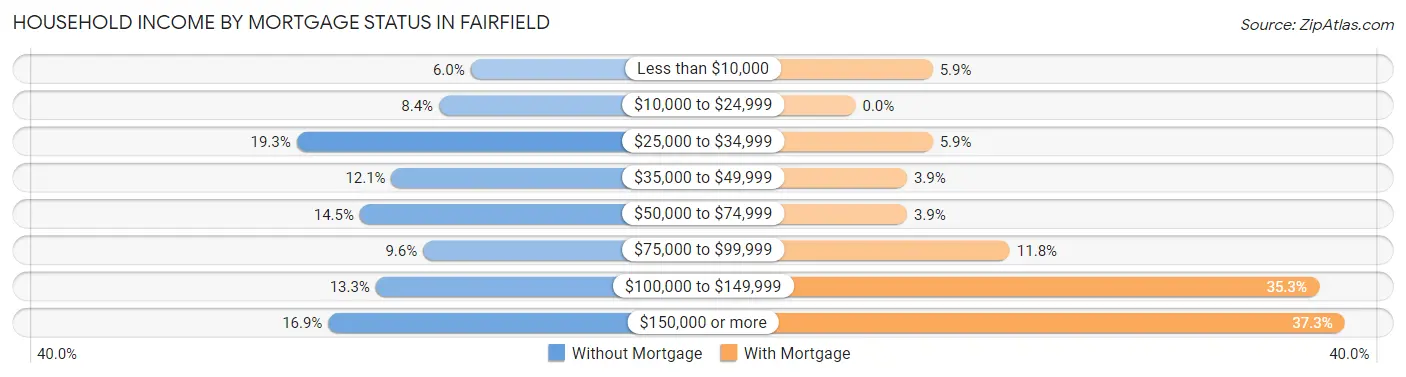
| Household Income | Without Mortgage | With Mortgage |
| Less than $10,000 | 5 (6.0%) | 3 (5.9%) |
| $10,000 to $24,999 | 7 (8.4%) | 0 (0.0%) |
| $25,000 to $34,999 | 16 (19.3%) | 3 (5.9%) |
| $35,000 to $49,999 | 10 (12.0%) | 2 (3.9%) |
| $50,000 to $74,999 | 12 (14.5%) | 2 (3.9%) |
| $75,000 to $99,999 | 8 (9.6%) | 6 (11.8%) |
| $100,000 to $149,999 | 11 (13.3%) | 18 (35.3%) |
| $150,000 or more | 14 (16.9%) | 19 (37.2%) |
| Total | 83 (100.0%) | 51 (100.0%) |
Property Value to Household Income Ratio in Fairfield
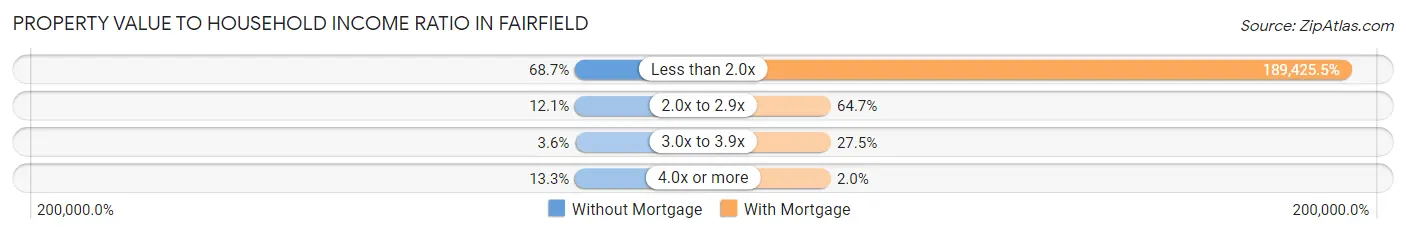
| Value-to-Income Ratio | Without Mortgage | With Mortgage |
| Less than 2.0x | 57 (68.7%) | 96,607 (189,425.5%) |
| 2.0x to 2.9x | 10 (12.0%) | 33 (64.7%) |
| 3.0x to 3.9x | 3 (3.6%) | 14 (27.5%) |
| 4.0x or more | 11 (13.3%) | 1 (2.0%) |
| Total | 83 (100.0%) | 51 (100.0%) |
Real Estate Taxes by Mortgage Status in Fairfield
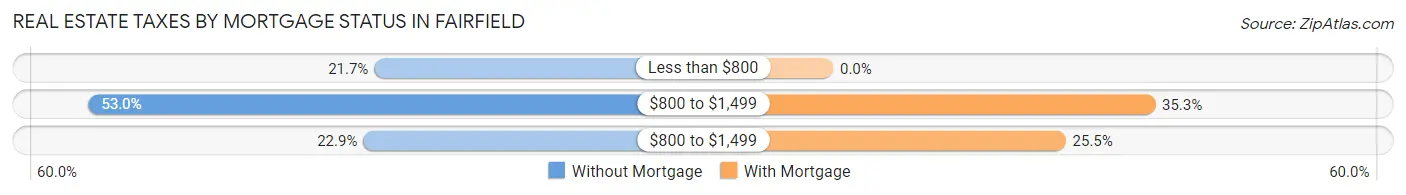
| Property Taxes | Without Mortgage | With Mortgage |
| Less than $800 | 18 (21.7%) | 0 (0.0%) |
| $800 to $1,499 | 44 (53.0%) | 18 (35.3%) |
| $800 to $1,499 | 19 (22.9%) | 13 (25.5%) |
| Total | 83 (100.0%) | 51 (100.0%) |
Health & Disability in Fairfield
Health Insurance Coverage by Age in Fairfield
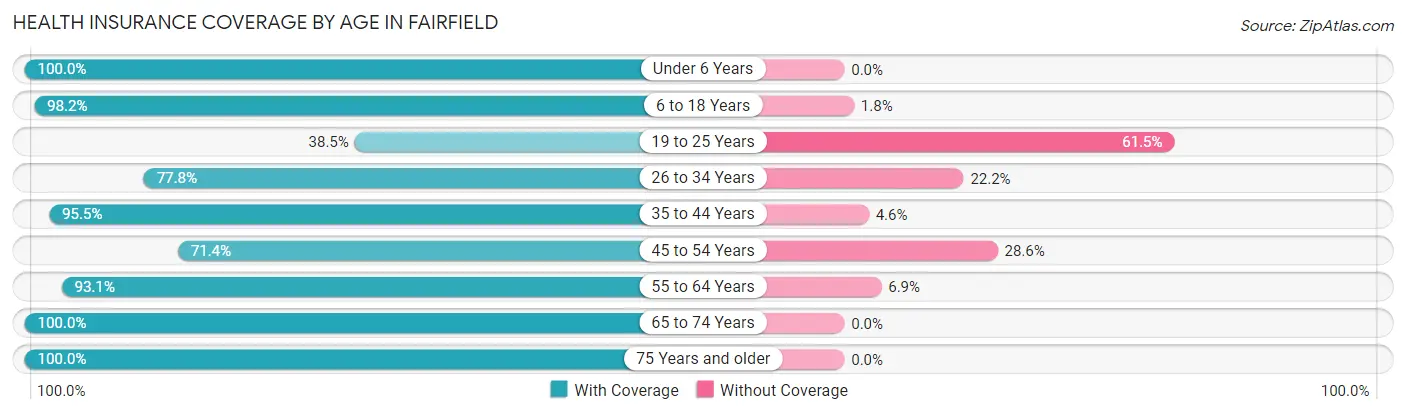
| Age Bracket | With Coverage | Without Coverage |
| Under 6 Years | 24 (100.0%) | 0 (0.0%) |
| 6 to 18 Years | 55 (98.2%) | 1 (1.8%) |
| 19 to 25 Years | 5 (38.5%) | 8 (61.5%) |
| 26 to 34 Years | 49 (77.8%) | 14 (22.2%) |
| 35 to 44 Years | 21 (95.5%) | 1 (4.5%) |
| 45 to 54 Years | 35 (71.4%) | 14 (28.6%) |
| 55 to 64 Years | 54 (93.1%) | 4 (6.9%) |
| 65 to 74 Years | 53 (100.0%) | 0 (0.0%) |
| 75 Years and older | 37 (100.0%) | 0 (0.0%) |
| Total | 333 (88.8%) | 42 (11.2%) |
Health Insurance Coverage by Citizenship Status in Fairfield
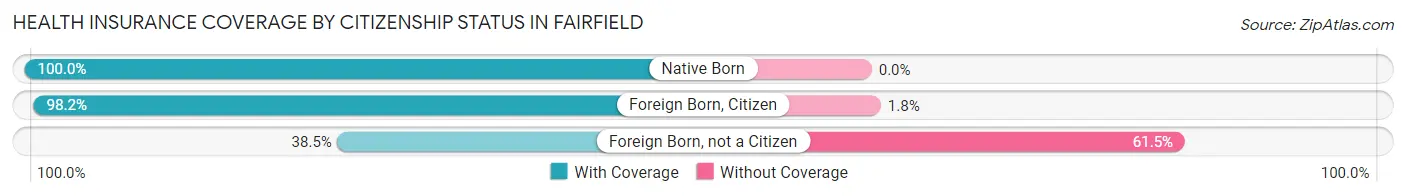
| Citizenship Status | With Coverage | Without Coverage |
| Native Born | 24 (100.0%) | 0 (0.0%) |
| Foreign Born, Citizen | 55 (98.2%) | 1 (1.8%) |
| Foreign Born, not a Citizen | 5 (38.5%) | 8 (61.5%) |
Health Insurance Coverage by Household Income in Fairfield
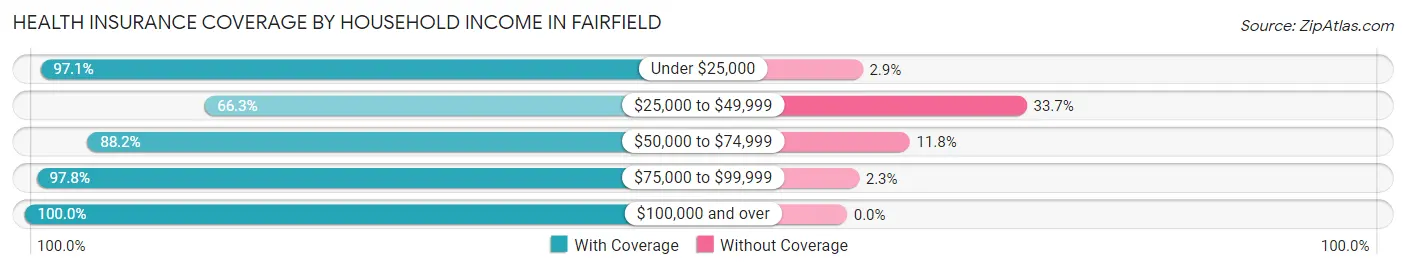
| Household Income | With Coverage | Without Coverage |
| Under $25,000 | 33 (97.1%) | 1 (2.9%) |
| $25,000 to $49,999 | 65 (66.3%) | 33 (33.7%) |
| $50,000 to $74,999 | 45 (88.2%) | 6 (11.8%) |
| $75,000 to $99,999 | 87 (97.8%) | 2 (2.2%) |
| $100,000 and over | 103 (100.0%) | 0 (0.0%) |
Public vs Private Health Insurance Coverage by Age in Fairfield
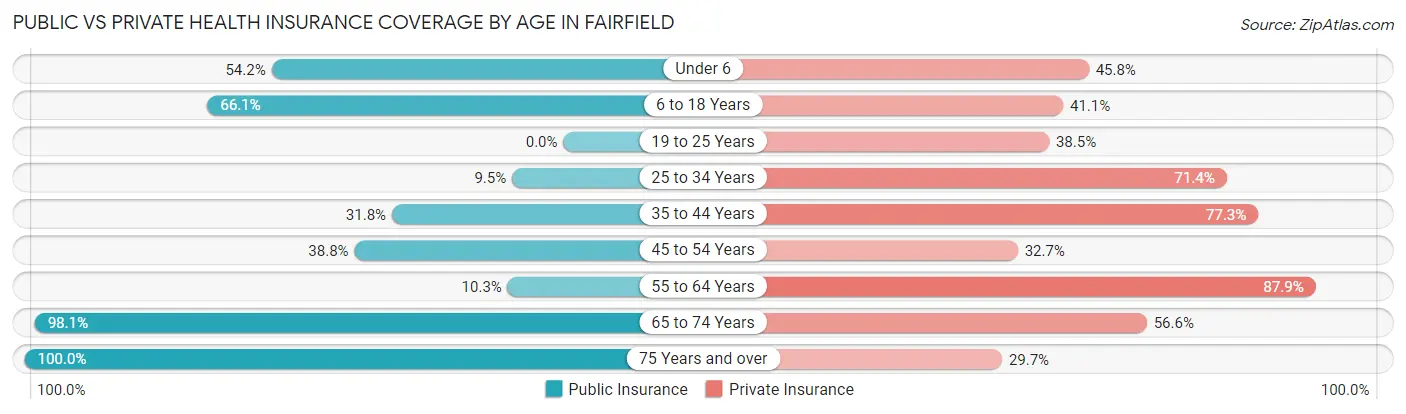
| Age Bracket | Public Insurance | Private Insurance |
| Under 6 | 13 (54.2%) | 11 (45.8%) |
| 6 to 18 Years | 37 (66.1%) | 23 (41.1%) |
| 19 to 25 Years | 0 (0.0%) | 5 (38.5%) |
| 25 to 34 Years | 6 (9.5%) | 45 (71.4%) |
| 35 to 44 Years | 7 (31.8%) | 17 (77.3%) |
| 45 to 54 Years | 19 (38.8%) | 16 (32.7%) |
| 55 to 64 Years | 6 (10.3%) | 51 (87.9%) |
| 65 to 74 Years | 52 (98.1%) | 30 (56.6%) |
| 75 Years and over | 37 (100.0%) | 11 (29.7%) |
| Total | 177 (47.2%) | 209 (55.7%) |
Disability Status by Sex by Age in Fairfield
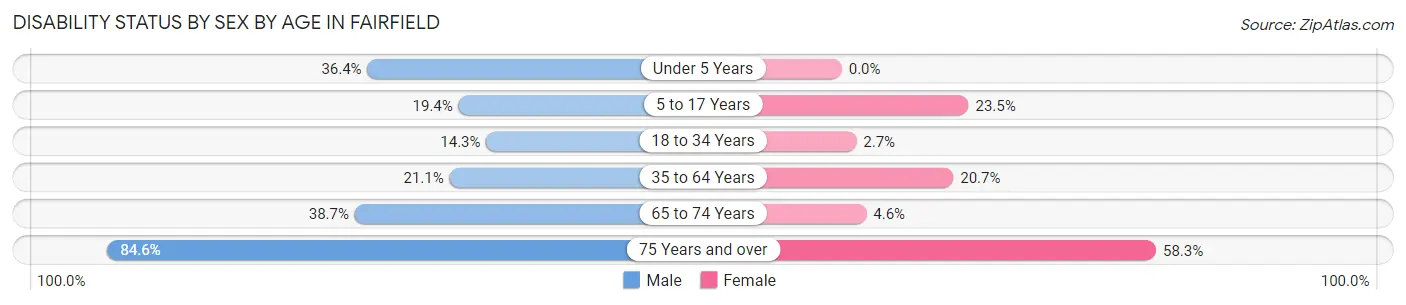
| Age Bracket | Male | Female |
| Under 5 Years | 4 (36.4%) | 0 (0.0%) |
| 5 to 17 Years | 7 (19.4%) | 4 (23.5%) |
| 18 to 34 Years | 6 (14.3%) | 1 (2.7%) |
| 35 to 64 Years | 15 (21.1%) | 12 (20.7%) |
| 65 to 74 Years | 12 (38.7%) | 1 (4.5%) |
| 75 Years and over | 11 (84.6%) | 14 (58.3%) |
Disability Class by Sex by Age in Fairfield
Disability Class: Hearing Difficulty
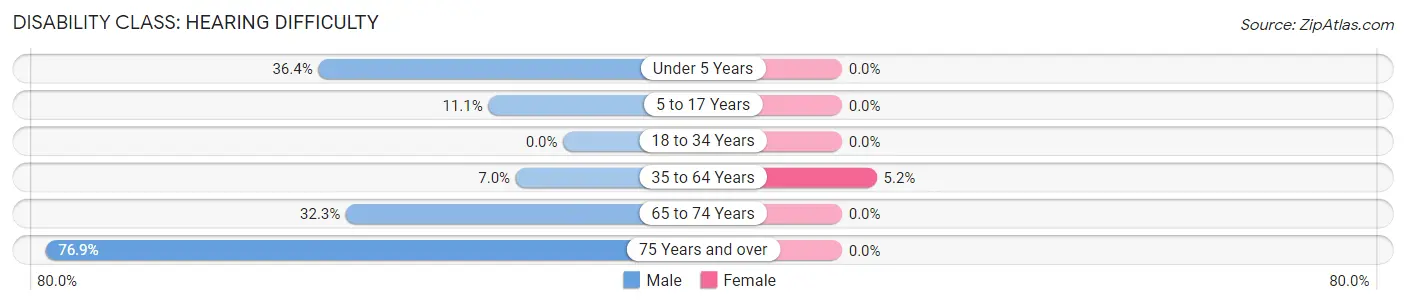
| Age Bracket | Male | Female |
| Under 5 Years | 4 (36.4%) | 0 (0.0%) |
| 5 to 17 Years | 4 (11.1%) | 0 (0.0%) |
| 18 to 34 Years | 0 (0.0%) | 0 (0.0%) |
| 35 to 64 Years | 5 (7.0%) | 3 (5.2%) |
| 65 to 74 Years | 10 (32.3%) | 0 (0.0%) |
| 75 Years and over | 10 (76.9%) | 0 (0.0%) |
Disability Class: Vision Difficulty
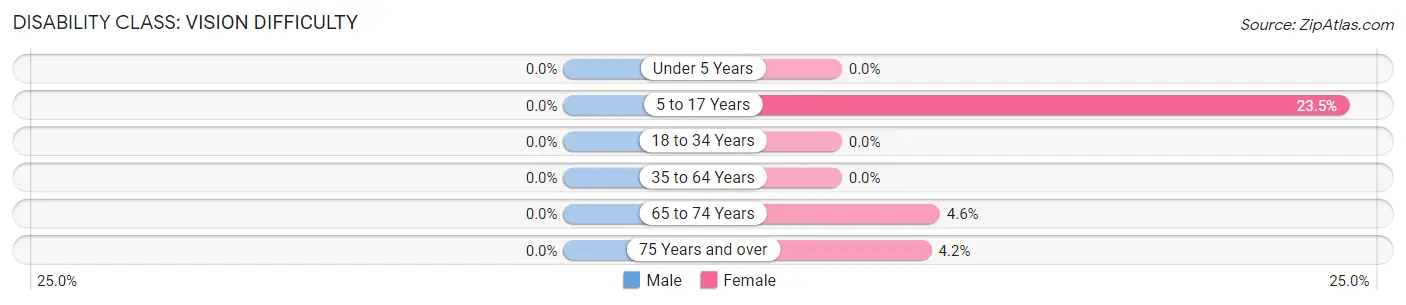
| Age Bracket | Male | Female |
| Under 5 Years | 0 (0.0%) | 0 (0.0%) |
| 5 to 17 Years | 0 (0.0%) | 4 (23.5%) |
| 18 to 34 Years | 0 (0.0%) | 0 (0.0%) |
| 35 to 64 Years | 0 (0.0%) | 0 (0.0%) |
| 65 to 74 Years | 0 (0.0%) | 1 (4.5%) |
| 75 Years and over | 0 (0.0%) | 1 (4.2%) |
Disability Class: Cognitive Difficulty
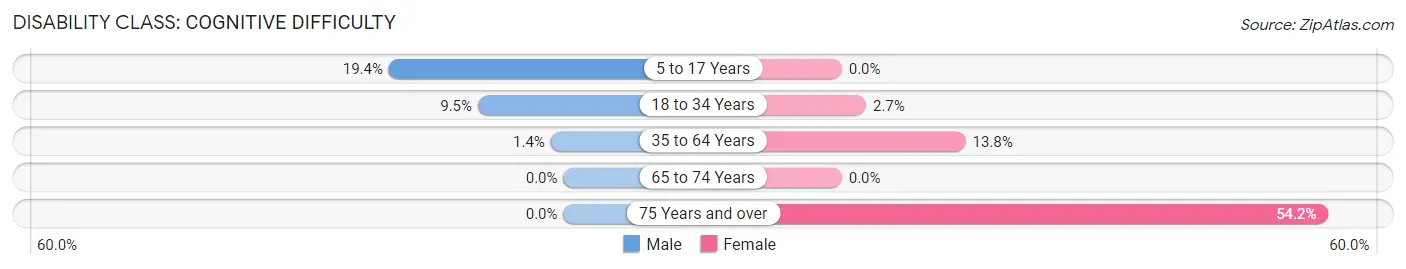
| Age Bracket | Male | Female |
| 5 to 17 Years | 7 (19.4%) | 0 (0.0%) |
| 18 to 34 Years | 4 (9.5%) | 1 (2.7%) |
| 35 to 64 Years | 1 (1.4%) | 8 (13.8%) |
| 65 to 74 Years | 0 (0.0%) | 0 (0.0%) |
| 75 Years and over | 0 (0.0%) | 13 (54.2%) |
Disability Class: Ambulatory Difficulty
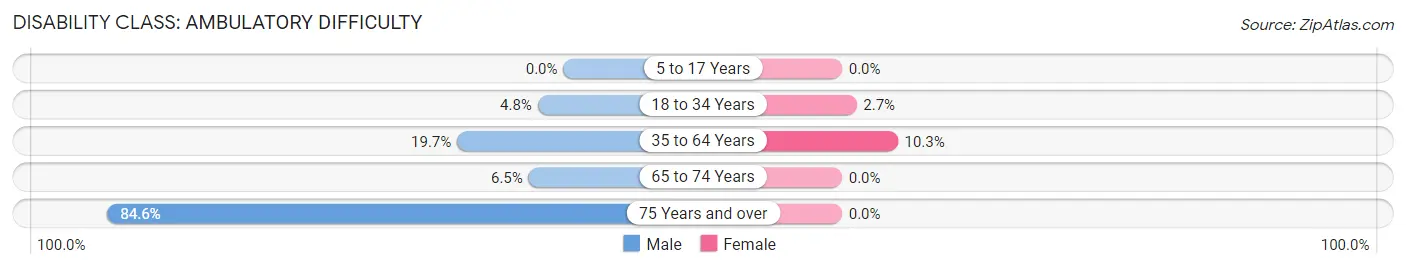
| Age Bracket | Male | Female |
| 5 to 17 Years | 0 (0.0%) | 0 (0.0%) |
| 18 to 34 Years | 2 (4.8%) | 1 (2.7%) |
| 35 to 64 Years | 14 (19.7%) | 6 (10.3%) |
| 65 to 74 Years | 2 (6.5%) | 0 (0.0%) |
| 75 Years and over | 11 (84.6%) | 0 (0.0%) |
Disability Class: Self-Care Difficulty
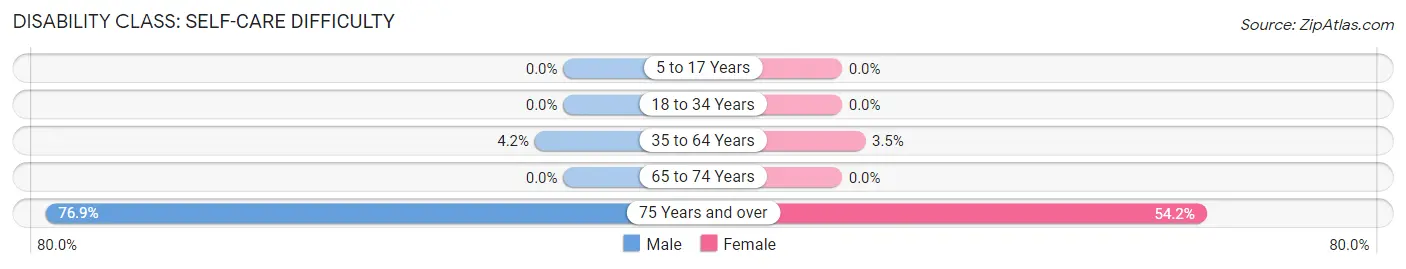
| Age Bracket | Male | Female |
| 5 to 17 Years | 0 (0.0%) | 0 (0.0%) |
| 18 to 34 Years | 0 (0.0%) | 0 (0.0%) |
| 35 to 64 Years | 3 (4.2%) | 2 (3.5%) |
| 65 to 74 Years | 0 (0.0%) | 0 (0.0%) |
| 75 Years and over | 10 (76.9%) | 13 (54.2%) |
Technology Access in Fairfield
Computing Device Access in Fairfield
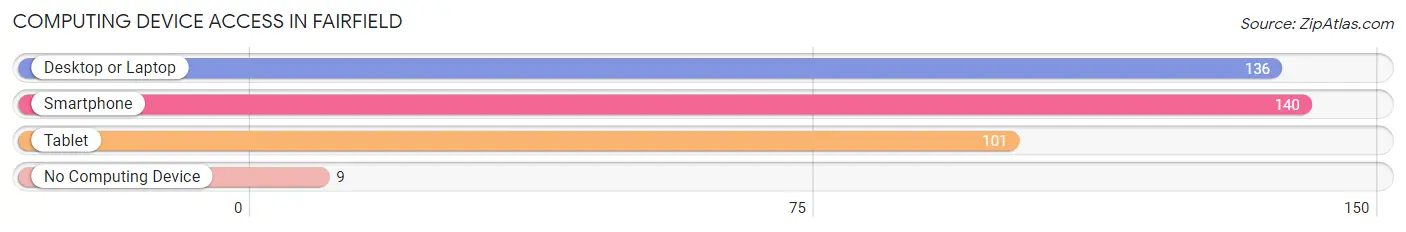
| Device Type | # Households | % Households |
| Desktop or Laptop | 136 | 79.5% |
| Smartphone | 140 | 81.9% |
| Tablet | 101 | 59.1% |
| No Computing Device | 9 | 5.3% |
| Total | 171 | 100.0% |
Internet Access in Fairfield
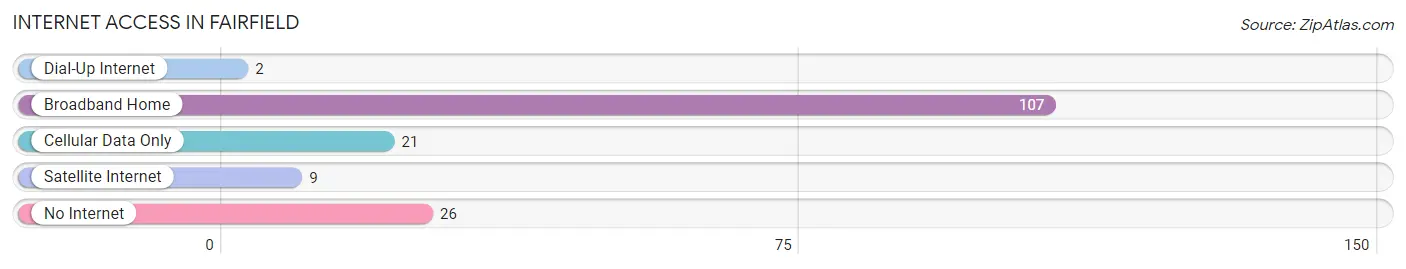
| Internet Type | # Households | % Households |
| Dial-Up Internet | 2 | 1.2% |
| Broadband Home | 107 | 62.6% |
| Cellular Data Only | 21 | 12.3% |
| Satellite Internet | 9 | 5.3% |
| No Internet | 26 | 15.2% |
| Total | 171 | 100.0% |
Fairfield Summary
Fairfield is a small town located in Clay County, Nebraska, United States. It is situated in the southeastern corner of the state, approximately 20 miles south of the state capital, Lincoln. The population of Fairfield was estimated to be 545 in 2020.
History
Fairfield was founded in 1871 by a group of settlers from Fairfield, Iowa. The town was named after the Iowa town, and the first post office was established in 1872. The town was incorporated in 1887.
In the early years, Fairfield was a farming community, with the main crops being corn, wheat, and oats. The town also had a few small businesses, including a general store, a blacksmith shop, and a hotel.
In the late 19th century, Fairfield began to grow and develop. The town was connected to the railroad in 1887, and the first bank was established in 1889. The town also had a newspaper, the Fairfield Herald, which was published from 1891 to 1895.
In the early 20th century, Fairfield continued to grow and develop. The town had a number of businesses, including a hardware store, a furniture store, a grocery store, and a movie theater. The town also had a number of churches, including the Methodist Episcopal Church, the Congregational Church, and the Catholic Church.
Geography
Fairfield is located in southeastern Nebraska, approximately 20 miles south of the state capital, Lincoln. The town is situated in Clay County, and is bordered by the Platte River to the east and the Loup River to the west. The town is located in the Central Plains region of the state, and is characterized by rolling hills and flat plains.
The climate in Fairfield is generally mild, with hot summers and cold winters. The average temperature in the summer is around 80 degrees Fahrenheit, and the average temperature in the winter is around 20 degrees Fahrenheit.
Economy
The economy of Fairfield is largely based on agriculture. The main crops grown in the area are corn, wheat, and oats. The town also has a number of small businesses, including a hardware store, a furniture store, a grocery store, and a movie theater.
Demographics
As of 2020, the population of Fairfield was estimated to be 545. The racial makeup of the town was 97.3% White, 0.7% African American, 0.4% Native American, 0.2% Asian, and 1.4% from other races. The median household income in Fairfield was $45,000, and the median home value was $125,000. The town had a poverty rate of 11.3%.
Common Questions
What is Per Capita Income in Fairfield?
Per Capita income in Fairfield is $37,654.
What is the Median Family Income in Fairfield?
Median Family Income in Fairfield is $82,857.
What is the Median Household income in Fairfield?
Median Household Income in Fairfield is $69,375.
What is Income or Wage Gap in Fairfield?
Income or Wage Gap in Fairfield is 52.4%.
Women in Fairfield earn 47.6 cents for every dollar earned by a man.
What is Inequality or Gini Index in Fairfield?
Inequality or Gini Index in Fairfield is 0.47.
What is the Total Population of Fairfield?
Total Population of Fairfield is 375.
What is the Total Male Population of Fairfield?
Total Male Population of Fairfield is 204.
What is the Total Female Population of Fairfield?
Total Female Population of Fairfield is 171.
What is the Ratio of Males per 100 Females in Fairfield?
There are 119.30 Males per 100 Females in Fairfield.
What is the Ratio of Females per 100 Males in Fairfield?
There are 83.82 Females per 100 Males in Fairfield.
What is the Median Population Age in Fairfield?
Median Population Age in Fairfield is 46.0 Years.
What is the Average Family Size in Fairfield
Average Family Size in Fairfield is 2.5 People.
What is the Average Household Size in Fairfield
Average Household Size in Fairfield is 2.2 People.
How Large is the Labor Force in Fairfield?
There are 207 People in the Labor Forcein in Fairfield.
What is the Percentage of People in the Labor Force in Fairfield?
67.9% of People are in the Labor Force in Fairfield.
What is the Unemployment Rate in Fairfield?
Unemployment Rate in Fairfield is 1.4%.