Brownville, NE Map & Demographics
Brownville Map
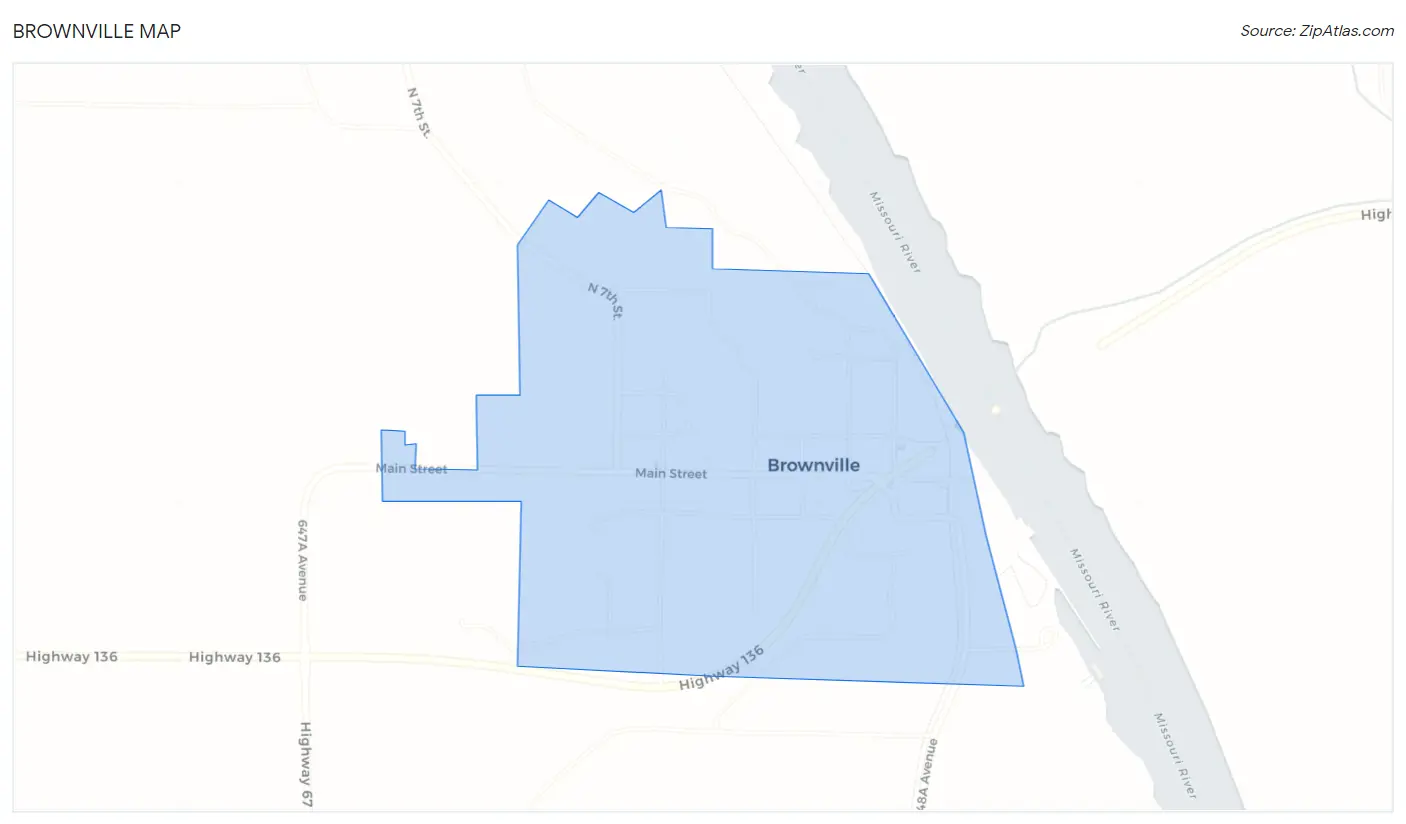
Brownville Overview
$48,828
PER CAPITA INCOME
$111,250
AVG FAMILY INCOME
$105,625
AVG HOUSEHOLD INCOME
66.8%
WAGE / INCOME GAP [ % ]
33.2¢/ $1
WAGE / INCOME GAP [ $ ]
0.42
INEQUALITY / GINI INDEX
138
TOTAL POPULATION
69
MALE POPULATION
69
FEMALE POPULATION
100.00
MALES / 100 FEMALES
100.00
FEMALES / 100 MALES
52.3
MEDIAN AGE
2.9
AVG FAMILY SIZE
2.2
AVG HOUSEHOLD SIZE
64
LABOR FORCE [ PEOPLE ]
57.1%
PERCENT IN LABOR FORCE
9.4%
UNEMPLOYMENT RATE
Brownville Zip Codes
Brownville Area Codes
Income in Brownville
Income Overview in Brownville
Per Capita Income in Brownville is $48,828, while median incomes of families and households are $111,250 and $105,625 respectively.
| Characteristic | Number | Measure |
| Per Capita Income | 138 | $48,828 |
| Median Family Income | 34 | $111,250 |
| Mean Family Income | 34 | $114,365 |
| Median Household Income | 62 | $105,625 |
| Mean Household Income | 62 | $103,763 |
| Income Deficit | 34 | $0 |
| Wage / Income Gap (%) | 138 | 66.76% |
| Wage / Income Gap ($) | 138 | 33.24¢ per $1 |
| Gini / Inequality Index | 138 | 0.42 |
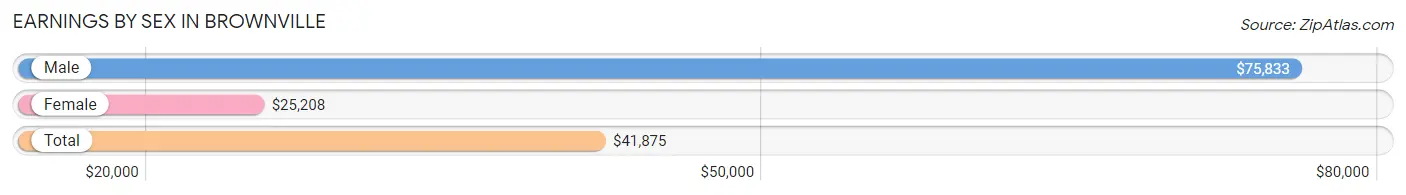
Earnings by Sex in Brownville
Average Earnings in Brownville are $41,875, $75,833 for men and $25,208 for women, a difference of 66.8%.
| Sex | Number | Average Earnings |
| Male | 38 (49.3%) | $75,833 |
| Female | 39 (50.6%) | $25,208 |
| Total | 77 (100.0%) | $41,875 |
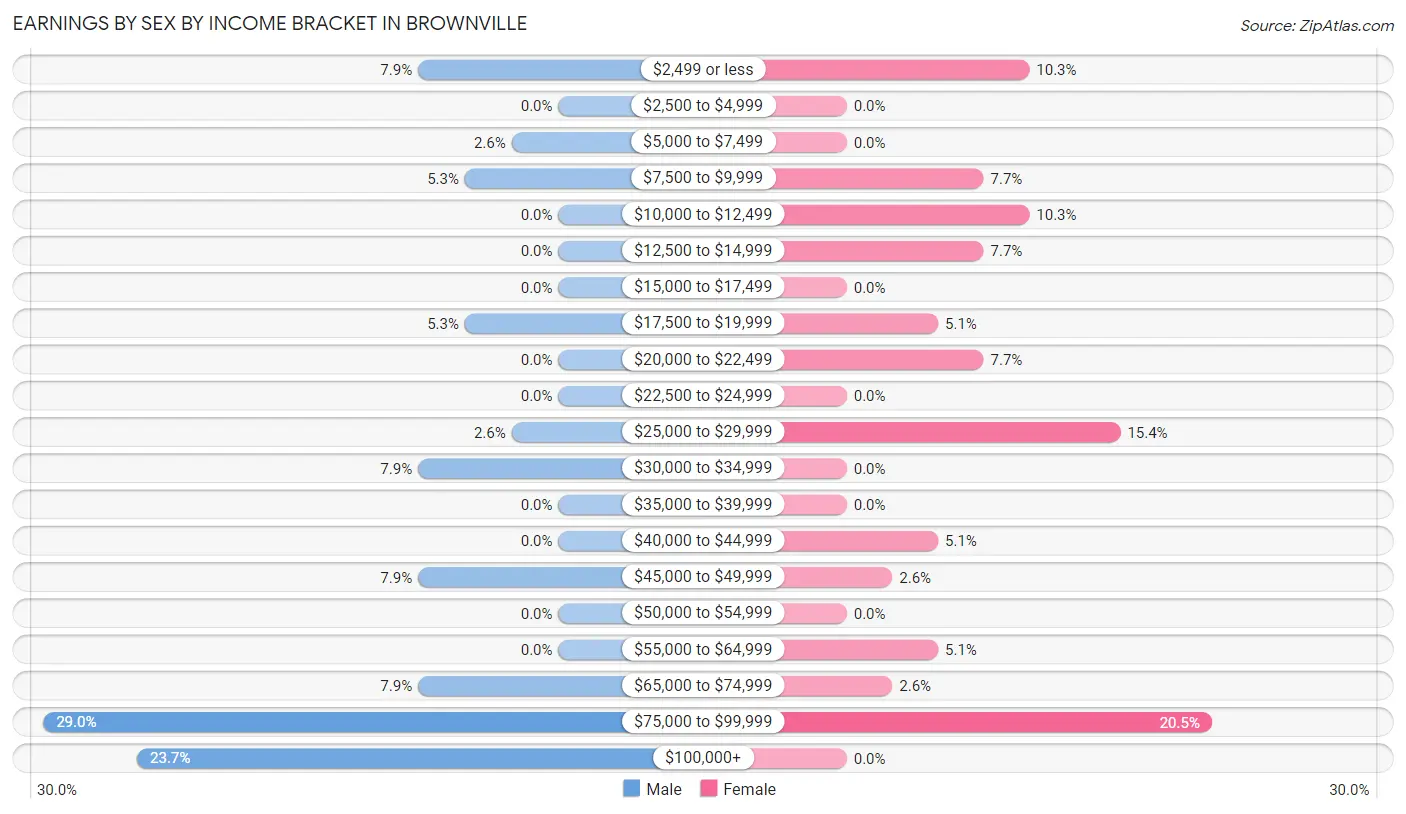
Earnings by Sex by Income Bracket in Brownville
The most common earnings brackets in Brownville are $75,000 to $99,999 for men (11 | 28.9%) and $75,000 to $99,999 for women (8 | 20.5%).
| Income | Male | Female |
| $2,499 or less | 3 (7.9%) | 4 (10.3%) |
| $2,500 to $4,999 | 0 (0.0%) | 0 (0.0%) |
| $5,000 to $7,499 | 1 (2.6%) | 0 (0.0%) |
| $7,500 to $9,999 | 2 (5.3%) | 3 (7.7%) |
| $10,000 to $12,499 | 0 (0.0%) | 4 (10.3%) |
| $12,500 to $14,999 | 0 (0.0%) | 3 (7.7%) |
| $15,000 to $17,499 | 0 (0.0%) | 0 (0.0%) |
| $17,500 to $19,999 | 2 (5.3%) | 2 (5.1%) |
| $20,000 to $22,499 | 0 (0.0%) | 3 (7.7%) |
| $22,500 to $24,999 | 0 (0.0%) | 0 (0.0%) |
| $25,000 to $29,999 | 1 (2.6%) | 6 (15.4%) |
| $30,000 to $34,999 | 3 (7.9%) | 0 (0.0%) |
| $35,000 to $39,999 | 0 (0.0%) | 0 (0.0%) |
| $40,000 to $44,999 | 0 (0.0%) | 2 (5.1%) |
| $45,000 to $49,999 | 3 (7.9%) | 1 (2.6%) |
| $50,000 to $54,999 | 0 (0.0%) | 0 (0.0%) |
| $55,000 to $64,999 | 0 (0.0%) | 2 (5.1%) |
| $65,000 to $74,999 | 3 (7.9%) | 1 (2.6%) |
| $75,000 to $99,999 | 11 (28.9%) | 8 (20.5%) |
| $100,000+ | 9 (23.7%) | 0 (0.0%) |
| Total | 38 (100.0%) | 39 (100.0%) |
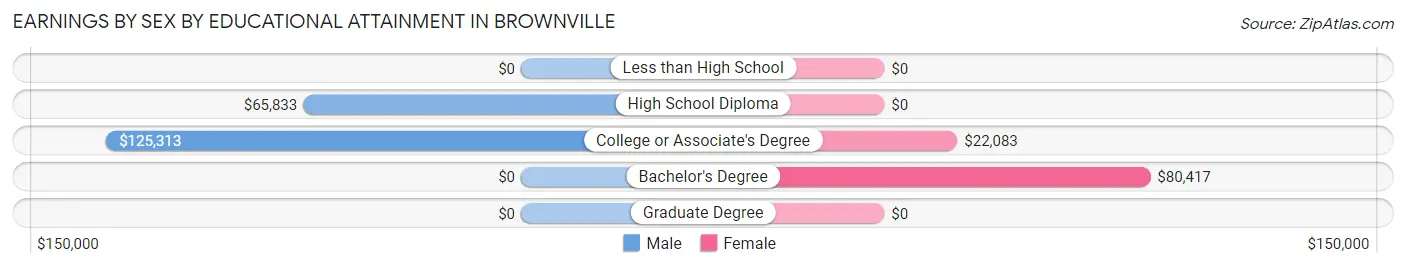
Earnings by Sex by Educational Attainment in Brownville
Average earnings in Brownville are $82,917 for men and $22,083 for women, a difference of 73.4%. Men with an educational attainment of college or associate's degree enjoy the highest average annual earnings of $125,313, while those with high school diploma education earn the least with $65,833. Women with an educational attainment of bachelor's degree earn the most with the average annual earnings of $80,417, while those with college or associate's degree education have the smallest earnings of $22,083.
| Educational Attainment | Male Income | Female Income |
| Less than High School | - | - |
| High School Diploma | $65,833 | $0 |
| College or Associate's Degree | $125,313 | $22,083 |
| Bachelor's Degree | - | - |
| Graduate Degree | - | - |
| Total | $82,917 | $22,083 |
Family Income in Brownville
Family Income Brackets in Brownville
According to the Brownville family income data, there are 11 families falling into the $100,000 to $149,999 income range, which is the most common income bracket and makes up 32.4% of all families.
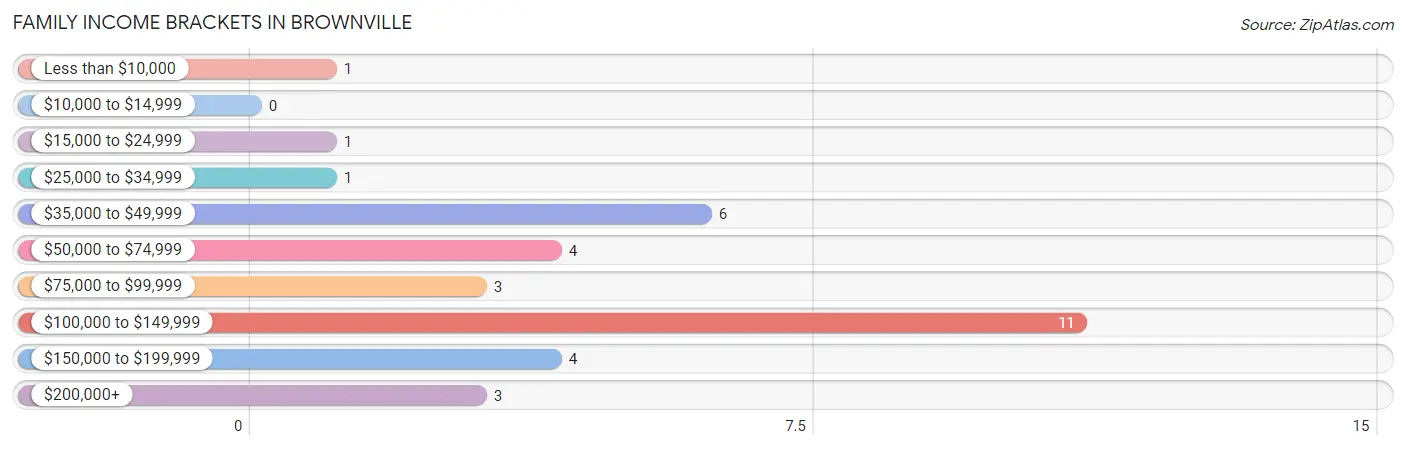
| Income Bracket | # Families | % Families |
| Less than $10,000 | 1 | 2.9% |
| $10,000 to $14,999 | 0 | 0.0% |
| $15,000 to $24,999 | 1 | 2.9% |
| $25,000 to $34,999 | 1 | 2.9% |
| $35,000 to $49,999 | 6 | 17.6% |
| $50,000 to $74,999 | 4 | 11.8% |
| $75,000 to $99,999 | 3 | 8.8% |
| $100,000 to $149,999 | 11 | 32.4% |
| $150,000 to $199,999 | 4 | 11.8% |
| $200,000+ | 3 | 8.8% |
Family Income by Famaliy Size in Brownville
2-person families (23 | 67.6%) account for the highest median family income in Brownville with $82,083 per family, while 2-person families (23 | 67.6%) have the highest median income of $41,042 per family member.
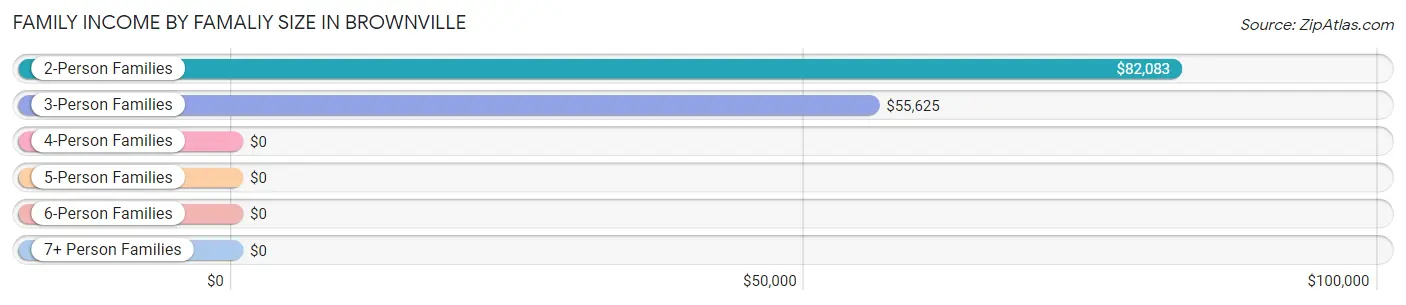
| Income Bracket | # Families | Median Income |
| 2-Person Families | 23 (67.6%) | $82,083 |
| 3-Person Families | 5 (14.7%) | $55,625 |
| 4-Person Families | 2 (5.9%) | $0 |
| 5-Person Families | 0 (0.0%) | $0 |
| 6-Person Families | 0 (0.0%) | $0 |
| 7+ Person Families | 4 (11.8%) | $0 |
| Total | 34 (100.0%) | $111,250 |
Family Income by Number of Earners in Brownville
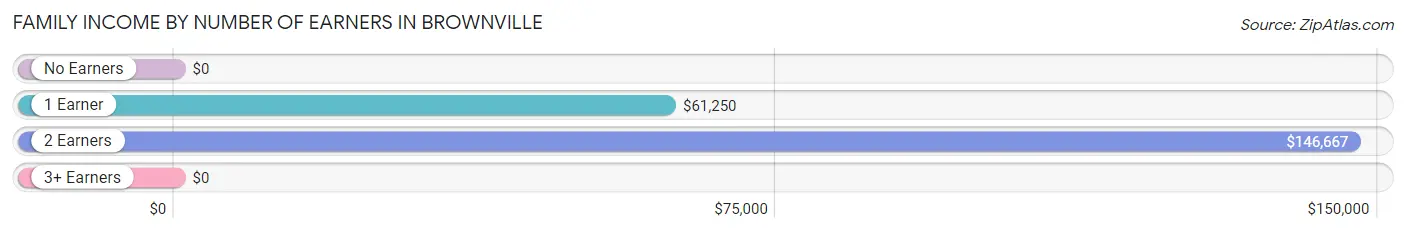
| Number of Earners | # Families | Median Income |
| No Earners | 4 (11.8%) | $0 |
| 1 Earner | 10 (29.4%) | $61,250 |
| 2 Earners | 16 (47.1%) | $146,667 |
| 3+ Earners | 4 (11.8%) | $0 |
| Total | 34 (100.0%) | $111,250 |
Household Income in Brownville
Household Income Brackets in Brownville
With 18 households falling in the category, the $100,000 to $149,999 income range is the most frequent in Brownville, accounting for 29.0% of all households.
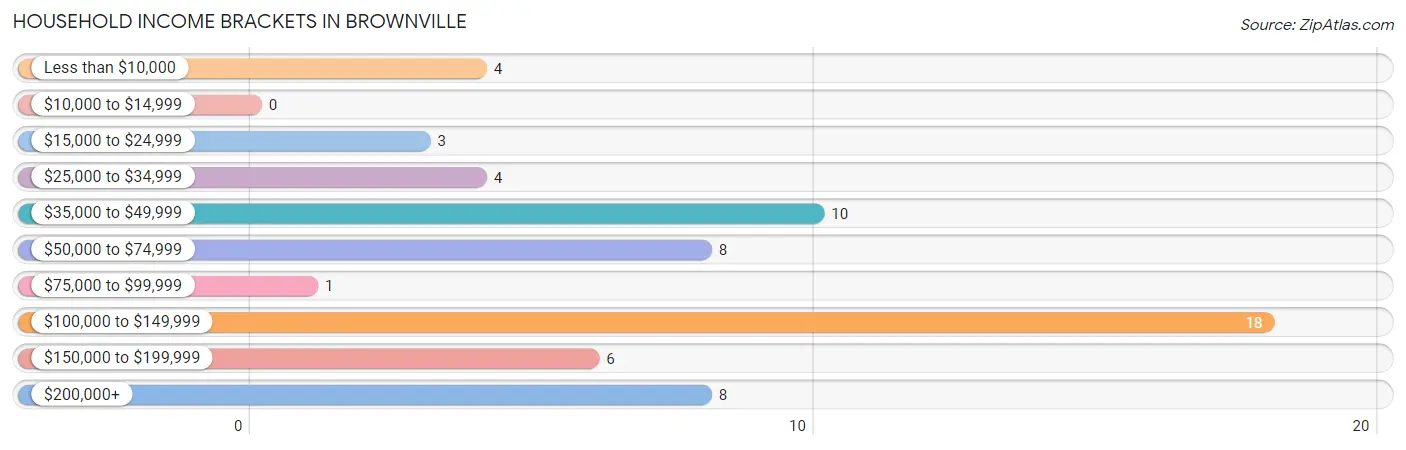
| Income Bracket | # Households | % Households |
| Less than $10,000 | 4 | 6.5% |
| $10,000 to $14,999 | 0 | 0.0% |
| $15,000 to $24,999 | 3 | 4.8% |
| $25,000 to $34,999 | 4 | 6.5% |
| $35,000 to $49,999 | 10 | 16.1% |
| $50,000 to $74,999 | 8 | 12.9% |
| $75,000 to $99,999 | 1 | 1.6% |
| $100,000 to $149,999 | 18 | 29.0% |
| $150,000 to $199,999 | 6 | 9.7% |
| $200,000+ | 8 | 12.9% |
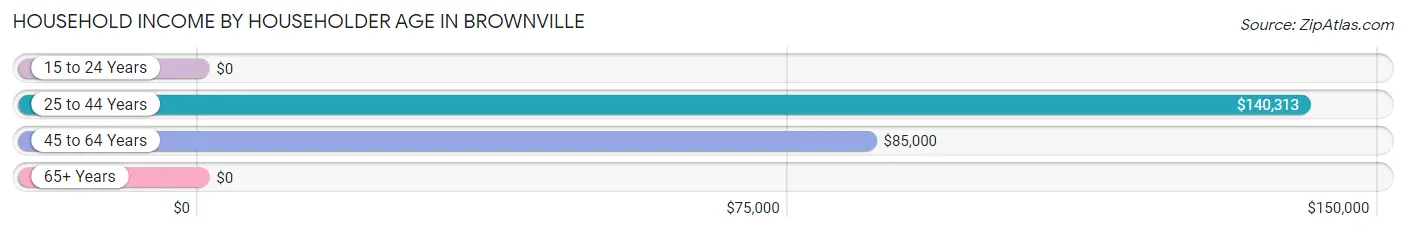
Household Income by Householder Age in Brownville
The median household income in Brownville is $105,625, with the highest median household income of $140,313 found in the 25 to 44 years age bracket for the primary householder. A total of 15 households (24.2%) fall into this category.
| Income Bracket | # Households | Median Income |
| 15 to 24 Years | 0 (0.0%) | $0 |
| 25 to 44 Years | 15 (24.2%) | $140,313 |
| 45 to 64 Years | 20 (32.3%) | $85,000 |
| 65+ Years | 27 (43.5%) | $0 |
| Total | 62 (100.0%) | $105,625 |
Poverty in Brownville
Income Below Poverty by Sex and Age in Brownville
With 8.7% poverty level for males and 8.7% for females among the residents of Brownville, 18 to 24 year old males and 45 to 54 year old females are the most vulnerable to poverty, with 2 males (100.0%) and 1 females (20.0%) in their respective age groups living below the poverty level.
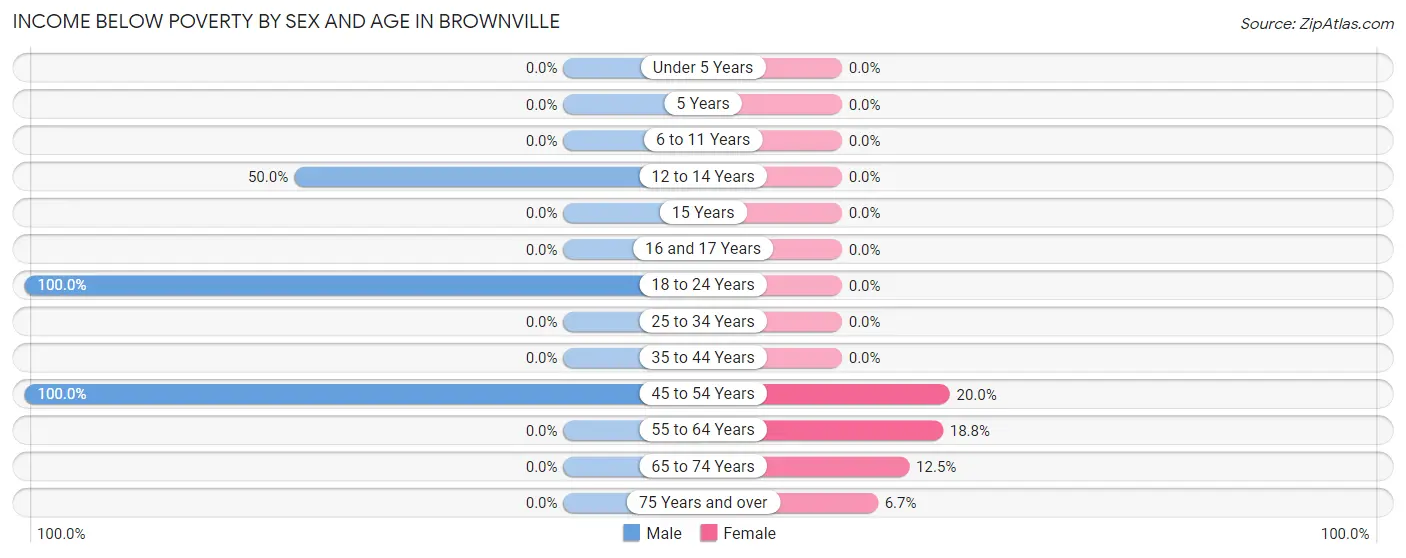
| Age Bracket | Male | Female |
| Under 5 Years | 0 (0.0%) | 0 (0.0%) |
| 5 Years | 0 (0.0%) | 0 (0.0%) |
| 6 to 11 Years | 0 (0.0%) | 0 (0.0%) |
| 12 to 14 Years | 3 (50.0%) | 0 (0.0%) |
| 15 Years | 0 (0.0%) | 0 (0.0%) |
| 16 and 17 Years | 0 (0.0%) | 0 (0.0%) |
| 18 to 24 Years | 2 (100.0%) | 0 (0.0%) |
| 25 to 34 Years | 0 (0.0%) | 0 (0.0%) |
| 35 to 44 Years | 0 (0.0%) | 0 (0.0%) |
| 45 to 54 Years | 1 (100.0%) | 1 (20.0%) |
| 55 to 64 Years | 0 (0.0%) | 3 (18.8%) |
| 65 to 74 Years | 0 (0.0%) | 1 (12.5%) |
| 75 Years and over | 0 (0.0%) | 1 (6.7%) |
| Total | 6 (8.7%) | 6 (8.7%) |
Income Above Poverty by Sex and Age in Brownville
According to the poverty statistics in Brownville, males aged under 5 years and females aged under 5 years are the age groups that are most secure financially, with 100.0% of males and 100.0% of females in these age groups living above the poverty line.
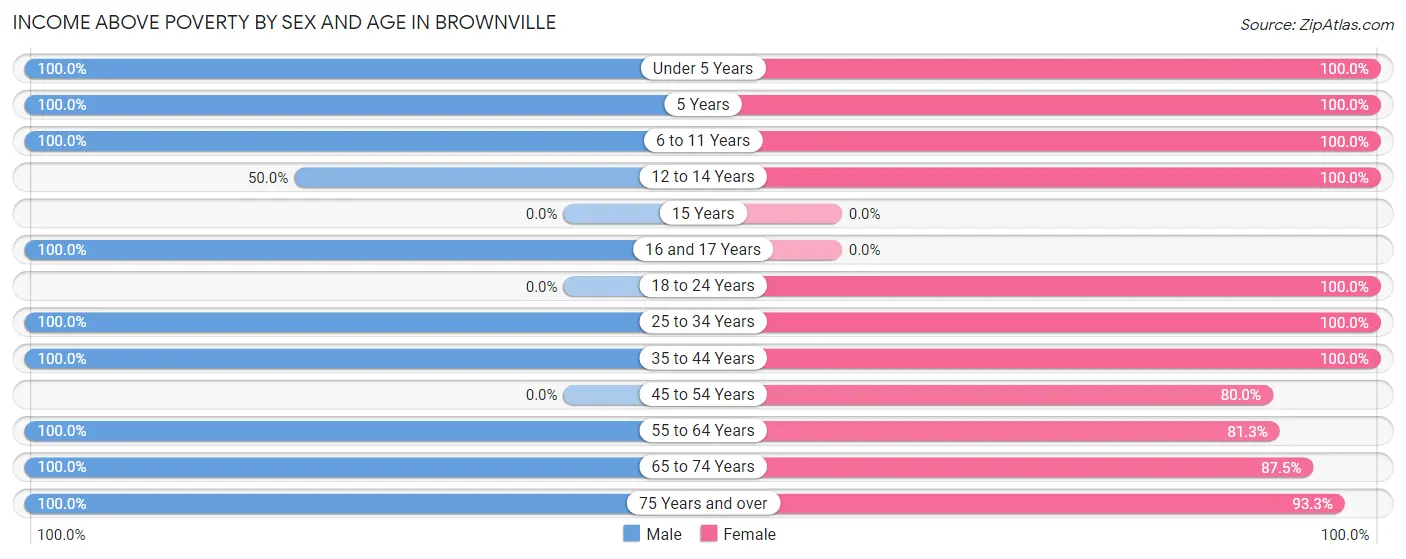
| Age Bracket | Male | Female |
| Under 5 Years | 2 (100.0%) | 4 (100.0%) |
| 5 Years | 5 (100.0%) | 1 (100.0%) |
| 6 to 11 Years | 2 (100.0%) | 3 (100.0%) |
| 12 to 14 Years | 3 (50.0%) | 3 (100.0%) |
| 15 Years | 0 (0.0%) | 0 (0.0%) |
| 16 and 17 Years | 3 (100.0%) | 0 (0.0%) |
| 18 to 24 Years | 0 (0.0%) | 2 (100.0%) |
| 25 to 34 Years | 11 (100.0%) | 7 (100.0%) |
| 35 to 44 Years | 10 (100.0%) | 5 (100.0%) |
| 45 to 54 Years | 0 (0.0%) | 4 (80.0%) |
| 55 to 64 Years | 6 (100.0%) | 13 (81.2%) |
| 65 to 74 Years | 17 (100.0%) | 7 (87.5%) |
| 75 Years and over | 4 (100.0%) | 14 (93.3%) |
| Total | 63 (91.3%) | 63 (91.3%) |
Income Below Poverty Among Married-Couple Families in Brownville
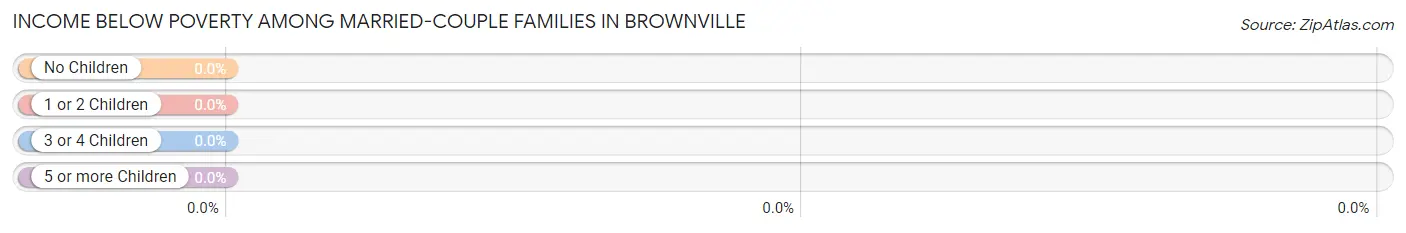
| Children | Above Poverty | Below Poverty |
| No Children | 19 (100.0%) | 0 (0.0%) |
| 1 or 2 Children | 5 (100.0%) | 0 (0.0%) |
| 3 or 4 Children | 0 (0.0%) | 0 (0.0%) |
| 5 or more Children | 4 (100.0%) | 0 (0.0%) |
| Total | 28 (100.0%) | 0 (0.0%) |
Income Below Poverty Among Single-Parent Households in Brownville
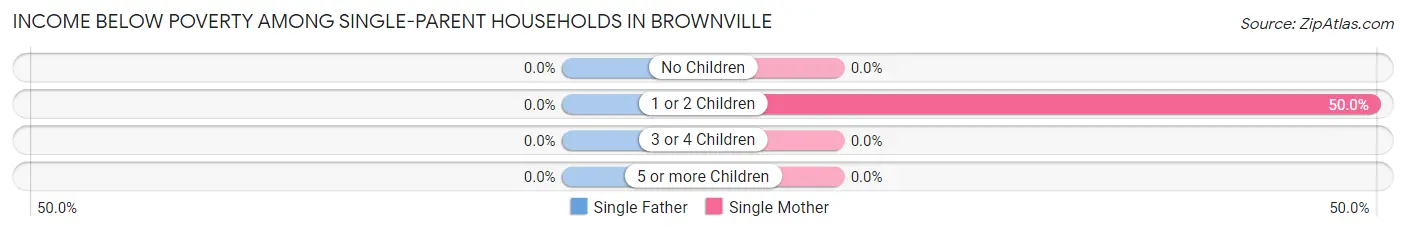
| Children | Single Father | Single Mother |
| No Children | 0 (0.0%) | 0 (0.0%) |
| 1 or 2 Children | 0 (0.0%) | 1 (50.0%) |
| 3 or 4 Children | 0 (0.0%) | 0 (0.0%) |
| 5 or more Children | 0 (0.0%) | 0 (0.0%) |
| Total | 0 (0.0%) | 1 (20.0%) |
Income Below Poverty Among Married-Couple vs Single-Parent Households in Brownville
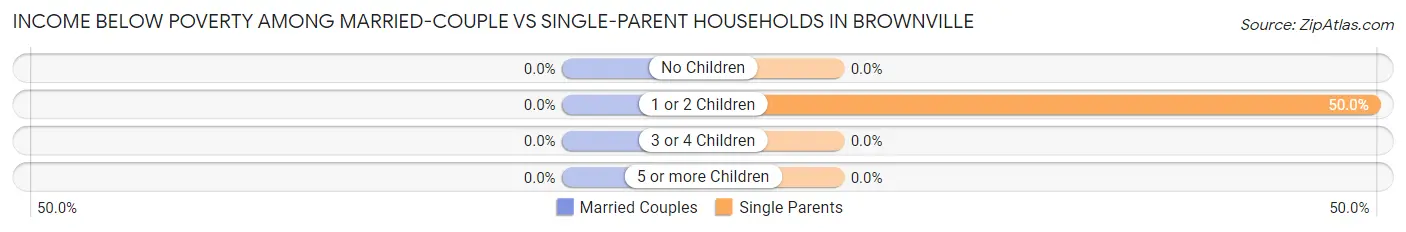
| Children | Married-Couple Families | Single-Parent Households |
| No Children | 0 (0.0%) | 0 (0.0%) |
| 1 or 2 Children | 0 (0.0%) | 1 (50.0%) |
| 3 or 4 Children | 0 (0.0%) | 0 (0.0%) |
| 5 or more Children | 0 (0.0%) | 0 (0.0%) |
| Total | 0 (0.0%) | 1 (16.7%) |
Race in Brownville
The most populous races in Brownville are White / Caucasian (126 | 91.3%), Two or more Races (9 | 6.5%), and Native / Alaskan (3 | 2.2%).
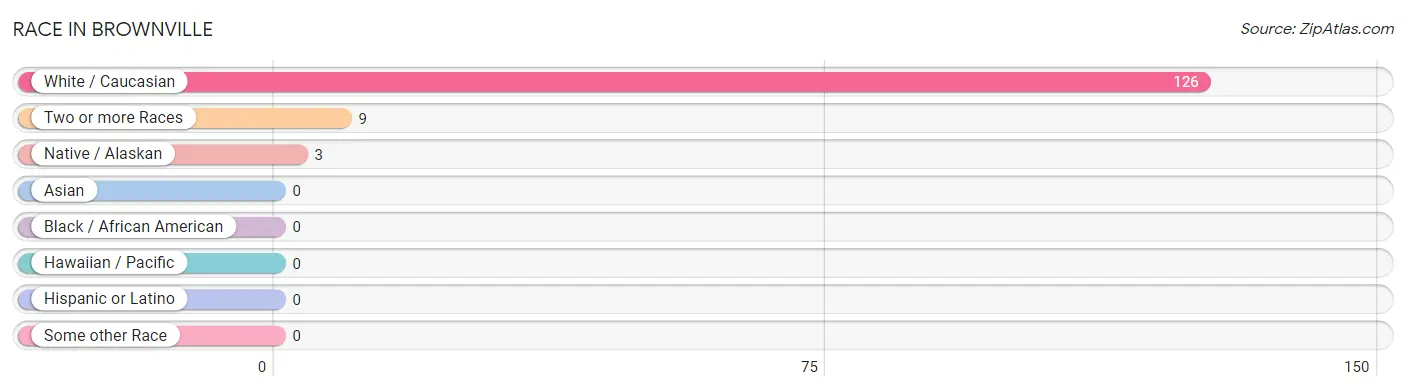
| Race | # Population | % Population |
| Asian | 0 | 0.0% |
| Black / African American | 0 | 0.0% |
| Hawaiian / Pacific | 0 | 0.0% |
| Hispanic or Latino | 0 | 0.0% |
| Native / Alaskan | 3 | 2.2% |
| White / Caucasian | 126 | 91.3% |
| Two or more Races | 9 | 6.5% |
| Some other Race | 0 | 0.0% |
| Total | 138 | 100.0% |
Ancestry in Brownville
The most populous ancestries reported in Brownville are German (72 | 52.2%), English (18 | 13.0%), American (16 | 11.6%), Norwegian (15 | 10.9%), and French (13 | 9.4%), together accounting for 97.1% of all Brownville residents.
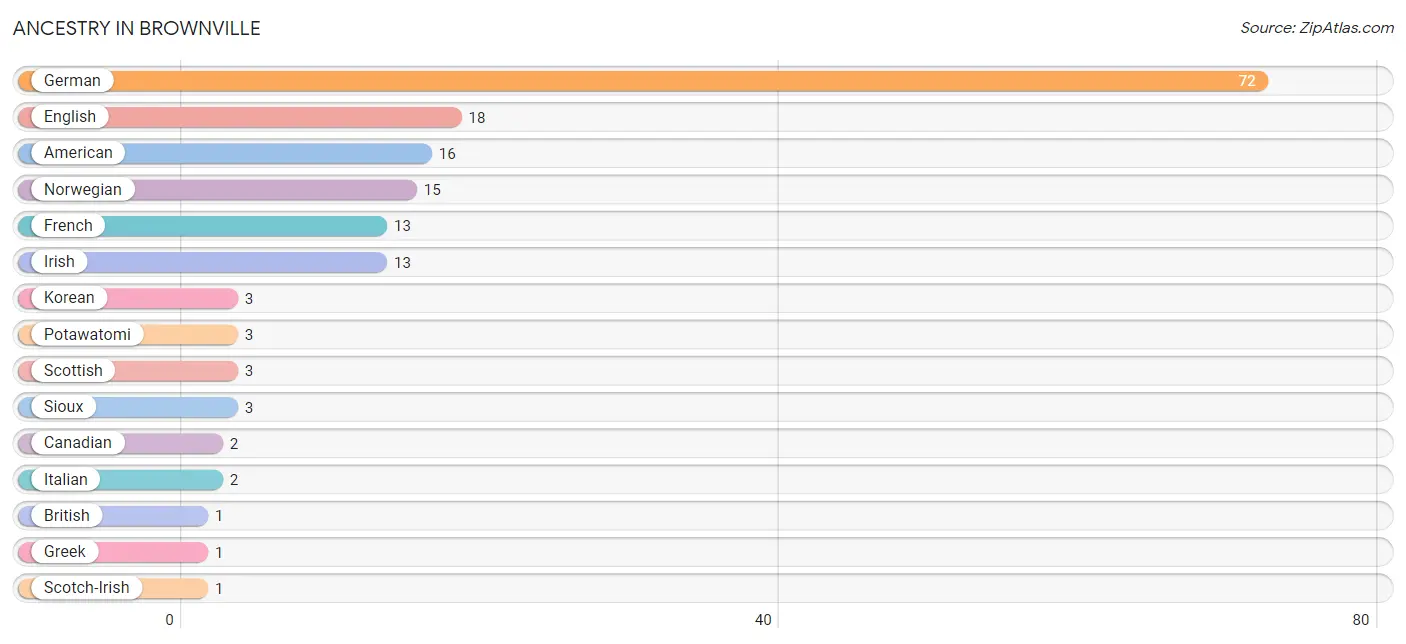
| Ancestry | # Population | % Population |
| American | 16 | 11.6% |
| British | 1 | 0.7% |
| Canadian | 2 | 1.5% |
| English | 18 | 13.0% |
| French | 13 | 9.4% |
| German | 72 | 52.2% |
| Greek | 1 | 0.7% |
| Irish | 13 | 9.4% |
| Italian | 2 | 1.5% |
| Korean | 3 | 2.2% |
| Norwegian | 15 | 10.9% |
| Potawatomi | 3 | 2.2% |
| Scotch-Irish | 1 | 0.7% |
| Scottish | 3 | 2.2% |
| Sioux | 3 | 2.2% | View All 15 Rows |
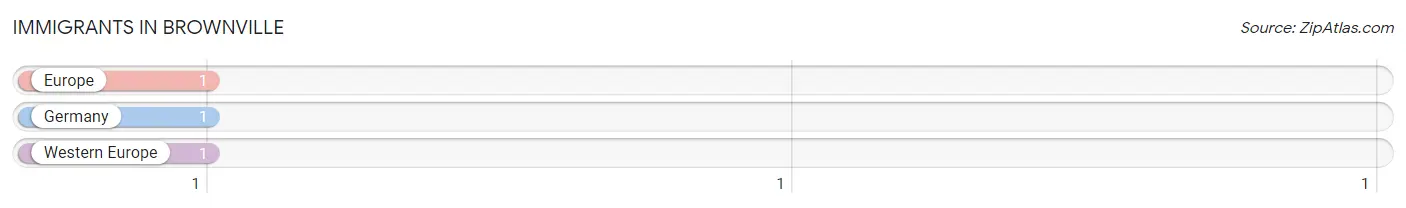
Immigrants in Brownville
The most numerous immigrant groups reported in Brownville came from Europe (1 | 0.7%), Germany (1 | 0.7%), and Western Europe (1 | 0.7%), together accounting for 2.2% of all Brownville residents.
| Immigration Origin | # Population | % Population |
| Europe | 1 | 0.7% |
| Germany | 1 | 0.7% |
| Western Europe | 1 | 0.7% | View All 3 Rows |
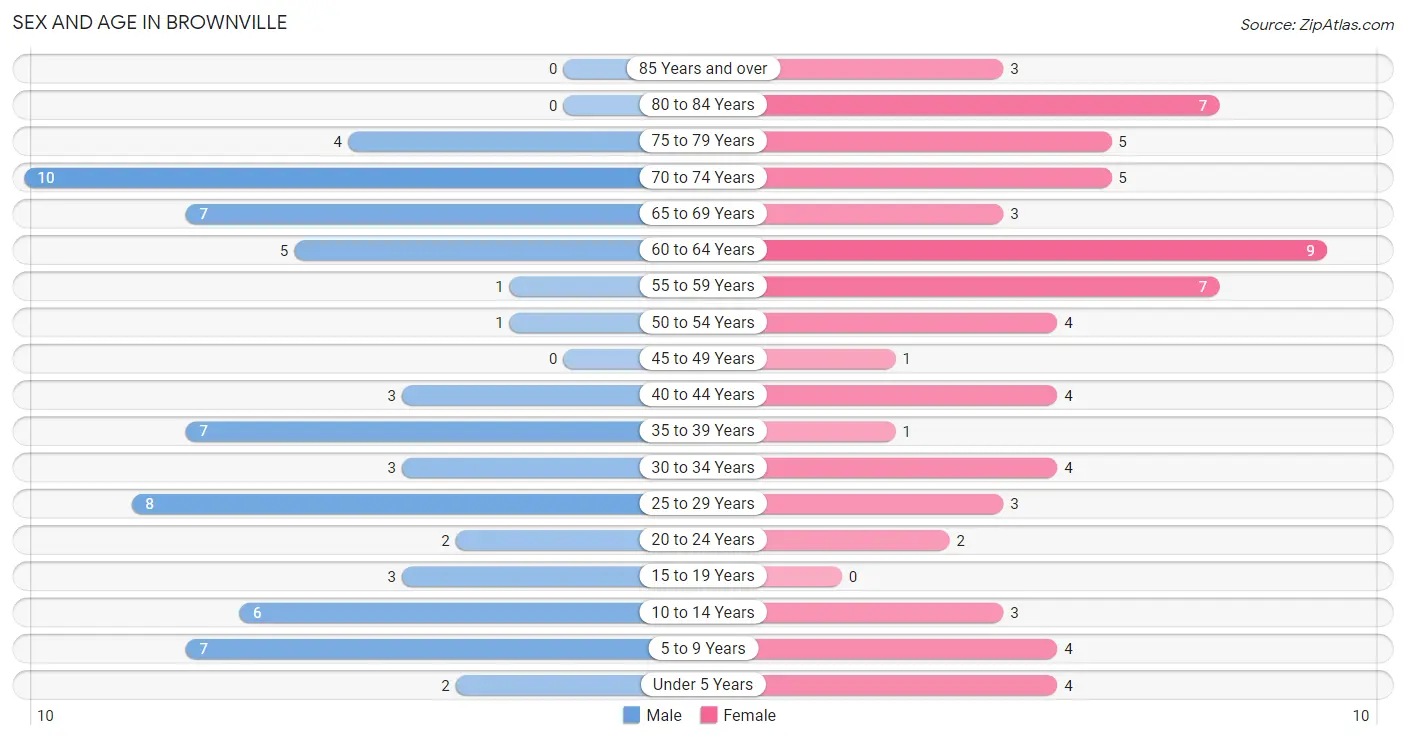
Sex and Age in Brownville
Sex and Age in Brownville
The most populous age groups in Brownville are 70 to 74 Years (10 | 14.5%) for men and 60 to 64 Years (9 | 13.0%) for women.
| Age Bracket | Male | Female |
| Under 5 Years | 2 (2.9%) | 4 (5.8%) |
| 5 to 9 Years | 7 (10.1%) | 4 (5.8%) |
| 10 to 14 Years | 6 (8.7%) | 3 (4.3%) |
| 15 to 19 Years | 3 (4.3%) | 0 (0.0%) |
| 20 to 24 Years | 2 (2.9%) | 2 (2.9%) |
| 25 to 29 Years | 8 (11.6%) | 3 (4.3%) |
| 30 to 34 Years | 3 (4.3%) | 4 (5.8%) |
| 35 to 39 Years | 7 (10.1%) | 1 (1.5%) |
| 40 to 44 Years | 3 (4.3%) | 4 (5.8%) |
| 45 to 49 Years | 0 (0.0%) | 1 (1.5%) |
| 50 to 54 Years | 1 (1.5%) | 4 (5.8%) |
| 55 to 59 Years | 1 (1.5%) | 7 (10.1%) |
| 60 to 64 Years | 5 (7.2%) | 9 (13.0%) |
| 65 to 69 Years | 7 (10.1%) | 3 (4.3%) |
| 70 to 74 Years | 10 (14.5%) | 5 (7.2%) |
| 75 to 79 Years | 4 (5.8%) | 5 (7.2%) |
| 80 to 84 Years | 0 (0.0%) | 7 (10.1%) |
| 85 Years and over | 0 (0.0%) | 3 (4.3%) |
| Total | 69 (100.0%) | 69 (100.0%) |
Families and Households in Brownville
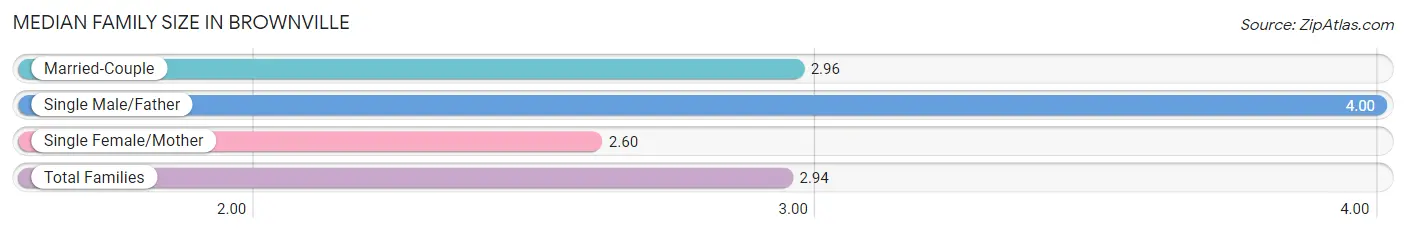
Median Family Size in Brownville
The median family size in Brownville is 2.94 persons per family, with single male/father families (1 | 2.9%) accounting for the largest median family size of 4 persons per family. On the other hand, single female/mother families (5 | 14.7%) represent the smallest median family size with 2.60 persons per family.
| Family Type | # Families | Family Size |
| Married-Couple | 28 (82.4%) | 2.96 |
| Single Male/Father | 1 (2.9%) | 4.00 |
| Single Female/Mother | 5 (14.7%) | 2.60 |
| Total Families | 34 (100.0%) | 2.94 |
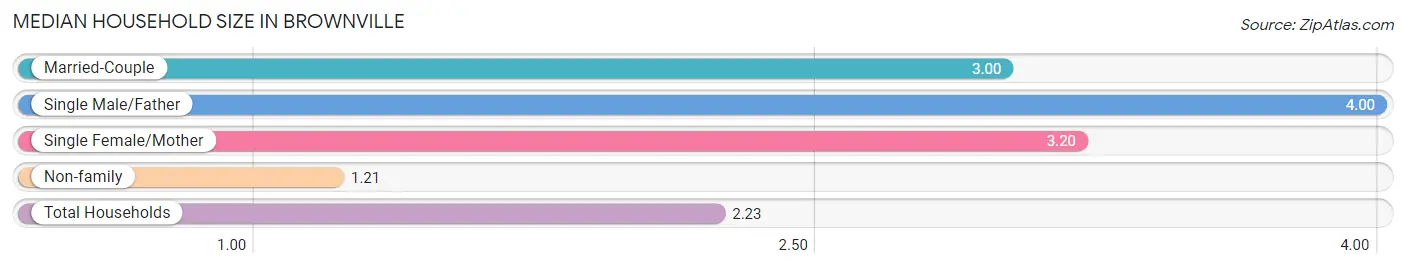
Median Household Size in Brownville
The median household size in Brownville is 2.23 persons per household, with single male/father households (1 | 1.6%) accounting for the largest median household size of 4 persons per household. non-family households (28 | 45.2%) represent the smallest median household size with 1.21 persons per household.
| Household Type | # Households | Household Size |
| Married-Couple | 28 (45.2%) | 3.00 |
| Single Male/Father | 1 (1.6%) | 4.00 |
| Single Female/Mother | 5 (8.1%) | 3.20 |
| Non-family | 28 (45.2%) | 1.21 |
| Total Households | 62 (100.0%) | 2.23 |
Household Size by Marriage Status in Brownville
Out of a total of 62 households in Brownville, 34 (54.8%) are family households, while 28 (45.2%) are nonfamily households. The most numerous type of family households are 2-person households, comprising 19, and the most common type of nonfamily households are 1-person households, comprising 23.
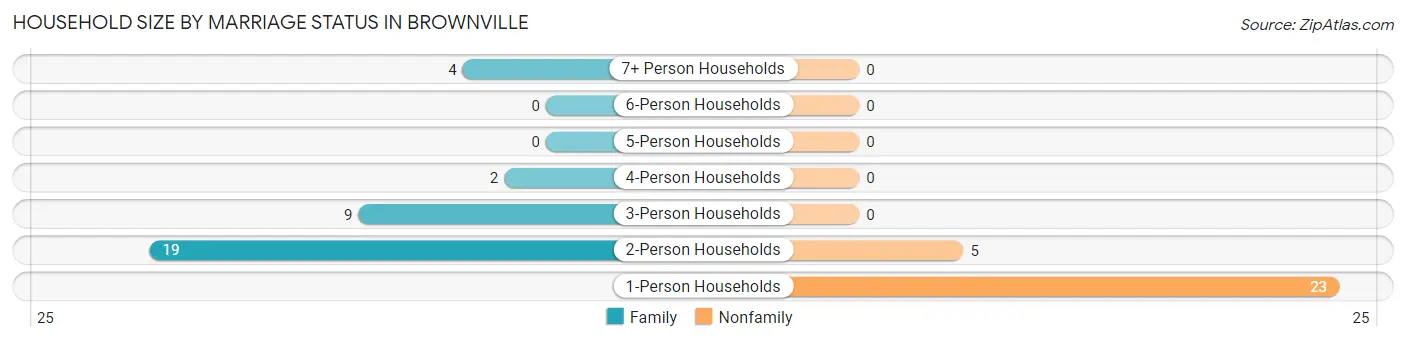
| Household Size | Family Households | Nonfamily Households |
| 1-Person Households | - | 23 (37.1%) |
| 2-Person Households | 19 (30.6%) | 5 (8.1%) |
| 3-Person Households | 9 (14.5%) | 0 (0.0%) |
| 4-Person Households | 2 (3.2%) | 0 (0.0%) |
| 5-Person Households | 0 (0.0%) | 0 (0.0%) |
| 6-Person Households | 0 (0.0%) | 0 (0.0%) |
| 7+ Person Households | 4 (6.5%) | 0 (0.0%) |
| Total | 34 (54.8%) | 28 (45.2%) |
Female Fertility in Brownville
Fertility by Age in Brownville
Average fertility rate in Brownville is 67.0 births per 1,000 women. Women in the age bracket of 35 to 50 years have the highest fertility rate with 167.0 births per 1,000 women. Women in the age bracket of 35 to 50 years acount for 100.0% of all women with births.
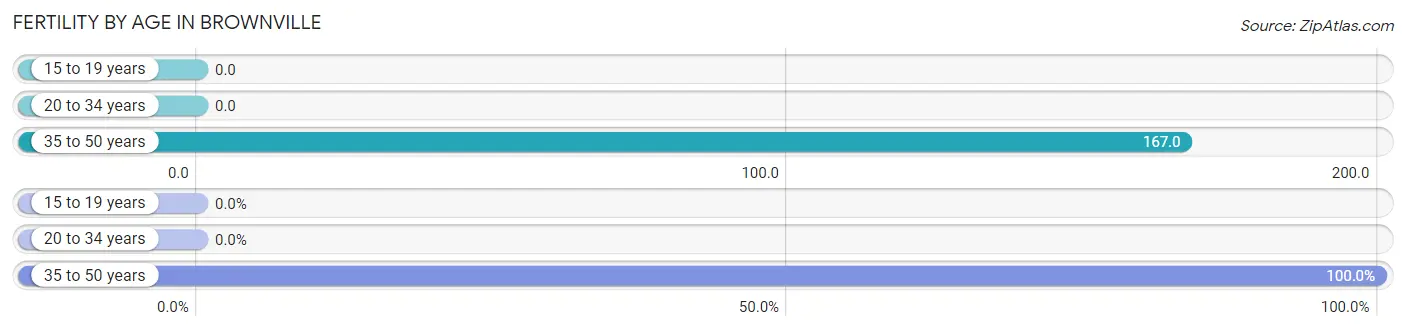
| Age Bracket | Women with Births | Births / 1,000 Women |
| 15 to 19 years | 0 (0.0%) | 0.0 |
| 20 to 34 years | 0 (0.0%) | 0.0 |
| 35 to 50 years | 1 (100.0%) | 167.0 |
| Total | 1 (100.0%) | 67.0 |
Fertility by Age by Marriage Status in Brownville
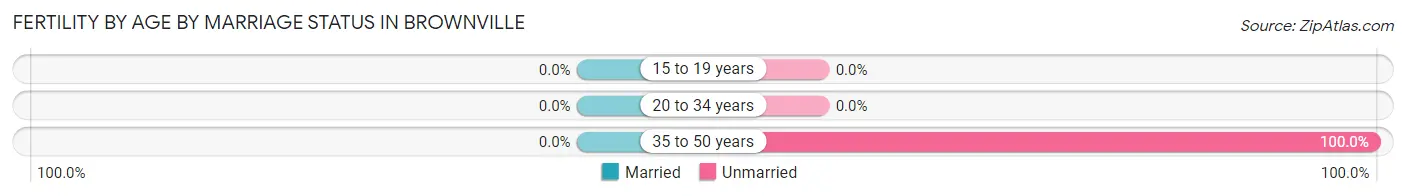
| Age Bracket | Married | Unmarried |
| 15 to 19 years | 0 (0.0%) | 0 (0.0%) |
| 20 to 34 years | 0 (0.0%) | 0 (0.0%) |
| 35 to 50 years | 0 (0.0%) | 1 (100.0%) |
| Total | 0 (0.0%) | 1 (100.0%) |
Fertility by Education in Brownville
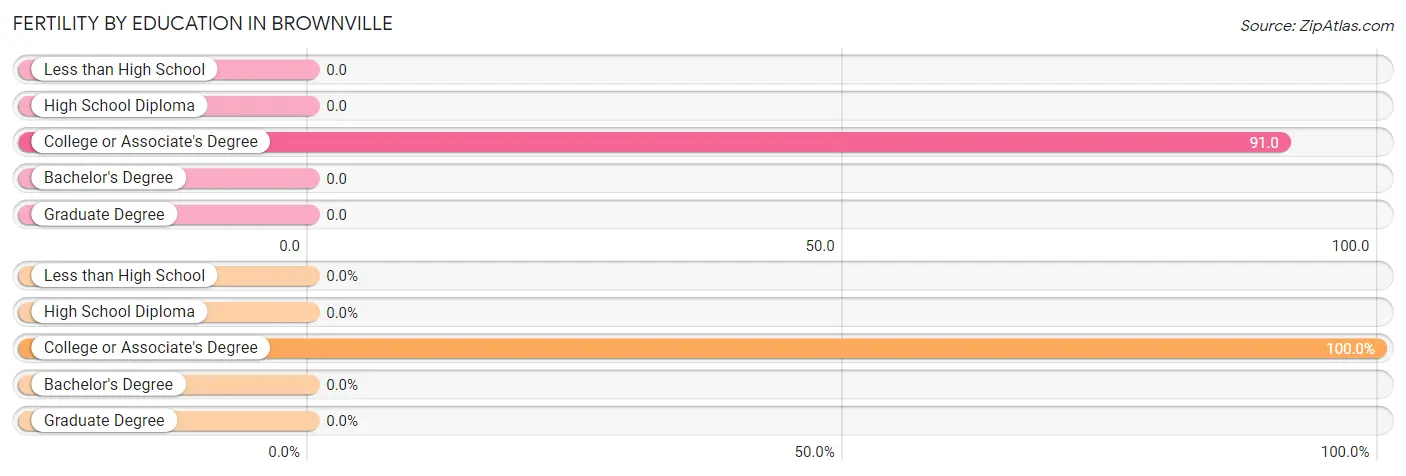
| Educational Attainment | Women with Births | Births / 1,000 Women |
| Less than High School | 0 (0.0%) | 0.0 |
| High School Diploma | 0 (0.0%) | 0.0 |
| College or Associate's Degree | 1 (100.0%) | 91.0 |
| Bachelor's Degree | 0 (0.0%) | 0.0 |
| Graduate Degree | 0 (0.0%) | 0.0 |
| Total | 1 (100.0%) | 67.0 |
Fertility by Education by Marriage Status in Brownville
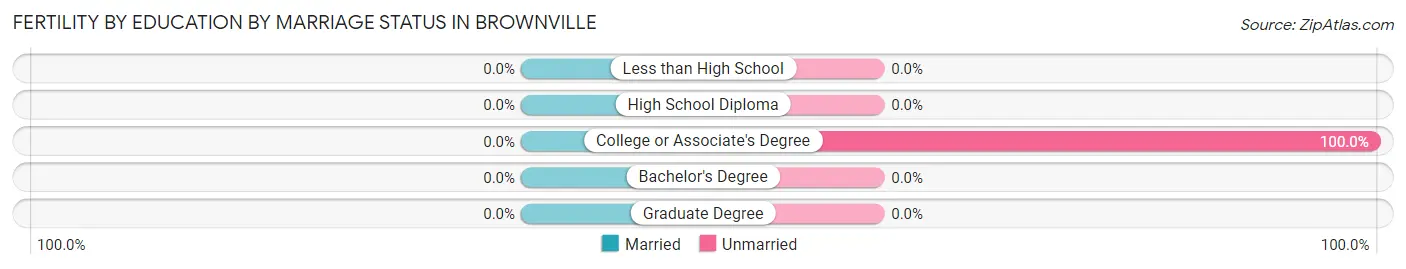
| Educational Attainment | Married | Unmarried |
| Less than High School | 0 (0.0%) | 0 (0.0%) |
| High School Diploma | 0 (0.0%) | 0 (0.0%) |
| College or Associate's Degree | 0 (0.0%) | 1 (100.0%) |
| Bachelor's Degree | 0 (0.0%) | 0 (0.0%) |
| Graduate Degree | 0 (0.0%) | 0 (0.0%) |
| Total | 0 (0.0%) | 1 (100.0%) |
Employment Characteristics in Brownville
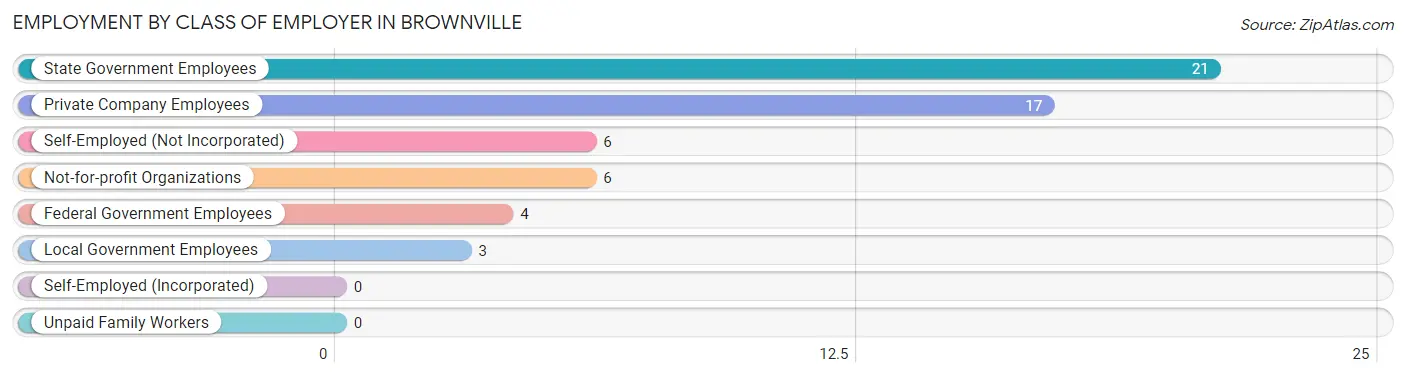
Employment by Class of Employer in Brownville
Among the 57 employed individuals in Brownville, state government employees (21 | 36.8%), private company employees (17 | 29.8%), and self-employed (not incorporated) (6 | 10.5%) make up the most common classes of employment.
| Employer Class | # Employees | % Employees |
| Private Company Employees | 17 | 29.8% |
| Self-Employed (Incorporated) | 0 | 0.0% |
| Self-Employed (Not Incorporated) | 6 | 10.5% |
| Not-for-profit Organizations | 6 | 10.5% |
| Local Government Employees | 3 | 5.3% |
| State Government Employees | 21 | 36.8% |
| Federal Government Employees | 4 | 7.0% |
| Unpaid Family Workers | 0 | 0.0% |
| Total | 57 | 100.0% |
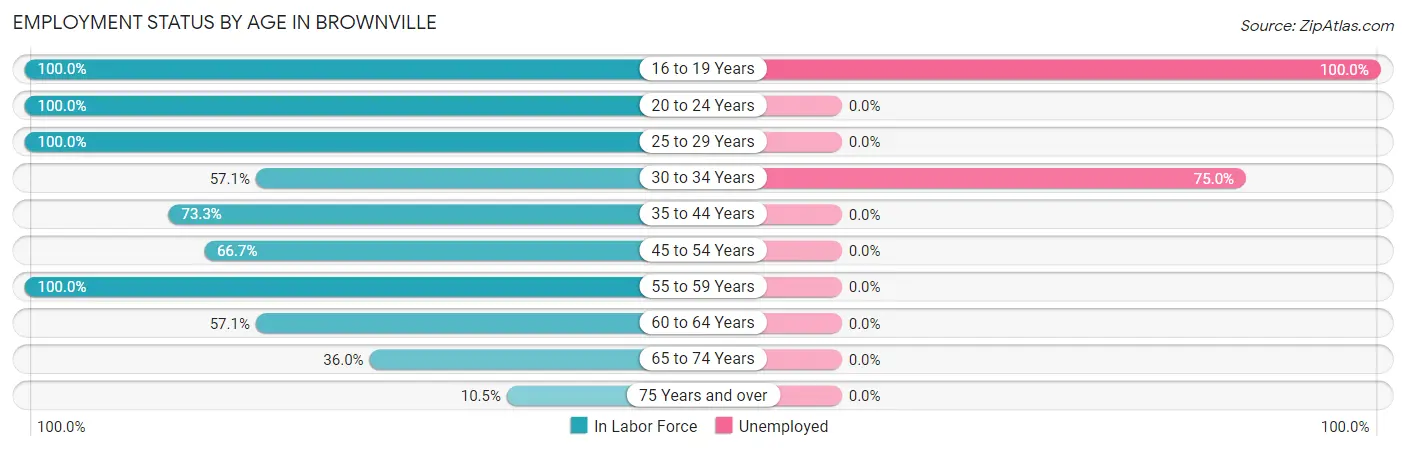
Employment Status by Age in Brownville
According to the labor force statistics for Brownville, out of the total population over 16 years of age (112), 57.1% or 64 individuals are in the labor force, with 9.4% or 6 of them unemployed. The age group with the highest labor force participation rate is 16 to 19 years, with 100.0% or 3 individuals in the labor force. Within the labor force, the 16 to 19 years age range has the highest percentage of unemployed individuals, with 100.0% or 3 of them being unemployed.
| Age Bracket | In Labor Force | Unemployed |
| 16 to 19 Years | 3 (100.0%) | 3 (100.0%) |
| 20 to 24 Years | 4 (100.0%) | 0 (0.0%) |
| 25 to 29 Years | 11 (100.0%) | 0 (0.0%) |
| 30 to 34 Years | 4 (57.1%) | 3 (75.0%) |
| 35 to 44 Years | 11 (73.3%) | 0 (0.0%) |
| 45 to 54 Years | 4 (66.7%) | 0 (0.0%) |
| 55 to 59 Years | 8 (100.0%) | 0 (0.0%) |
| 60 to 64 Years | 8 (57.1%) | 0 (0.0%) |
| 65 to 74 Years | 9 (36.0%) | 0 (0.0%) |
| 75 Years and over | 2 (10.5%) | 0 (0.0%) |
| Total | 64 (57.1%) | 6 (9.4%) |
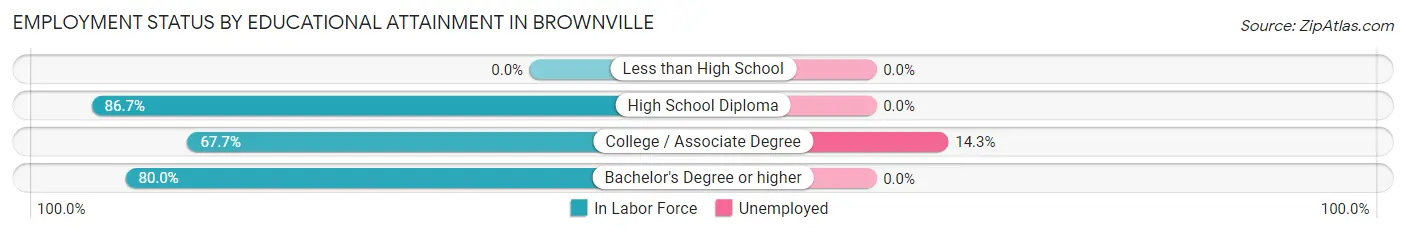
Employment Status by Educational Attainment in Brownville
According to labor force statistics for Brownville, 75.4% of individuals (46) out of the total population between 25 and 64 years of age (61) are in the labor force, with 6.5% or 3 of them being unemployed. The group with the highest labor force participation rate are those with the educational attainment of high school diploma, with 86.7% or 13 individuals in the labor force. Within the labor force, individuals with college / associate degree education have the highest percentage of unemployment, with 14.3% or 3 of them being unemployed.
| Educational Attainment | In Labor Force | Unemployed |
| Less than High School | 0 (0.0%) | 0 (0.0%) |
| High School Diploma | 13 (86.7%) | 0 (0.0%) |
| College / Associate Degree | 21 (67.7%) | 4 (14.3%) |
| Bachelor's Degree or higher | 12 (80.0%) | 0 (0.0%) |
| Total | 46 (75.4%) | 4 (6.5%) |
Employment Occupations by Sex in Brownville
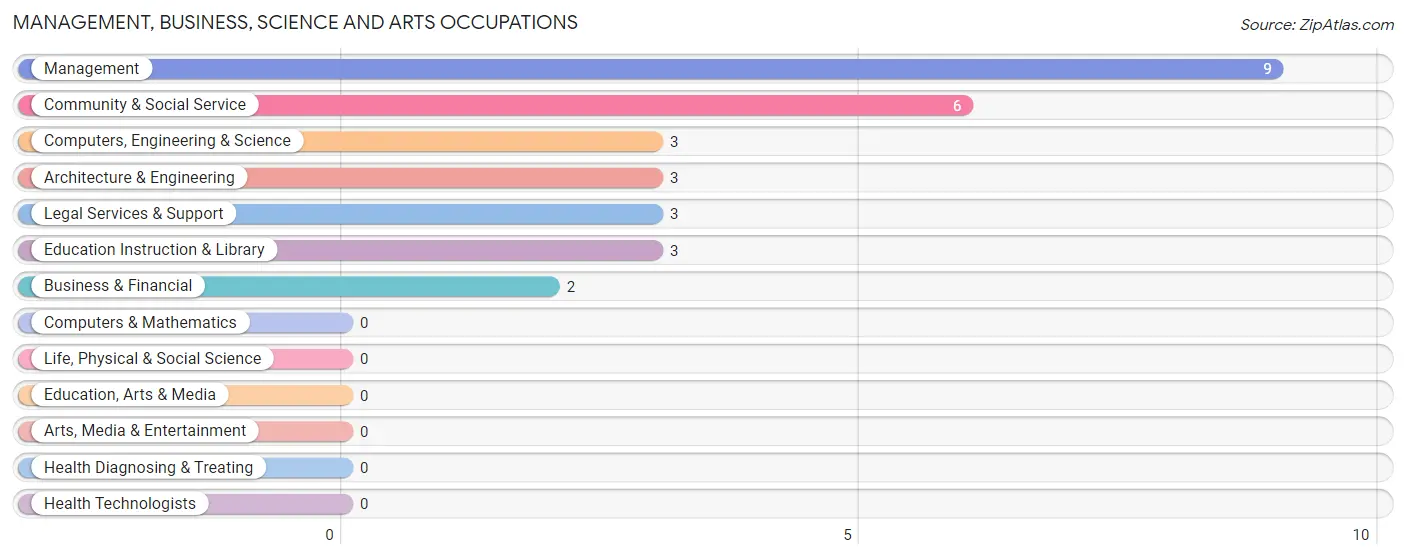
Management, Business, Science and Arts Occupations
The most common Management, Business, Science and Arts occupations in Brownville are Management (9 | 15.5%), Community & Social Service (6 | 10.3%), Computers, Engineering & Science (3 | 5.2%), Architecture & Engineering (3 | 5.2%), and Legal Services & Support (3 | 5.2%).
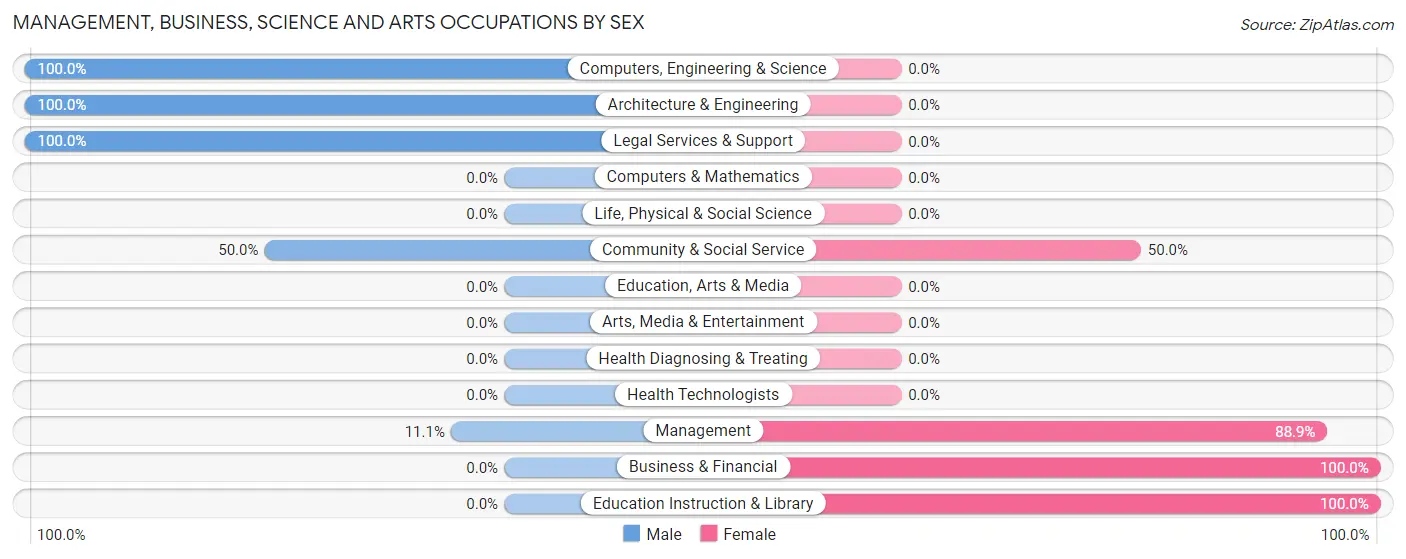
Management, Business, Science and Arts Occupations by Sex
Within the Management, Business, Science and Arts occupations in Brownville, the most male-oriented occupations are Computers, Engineering & Science (100.0%), Architecture & Engineering (100.0%), and Legal Services & Support (100.0%), while the most female-oriented occupations are Business & Financial (100.0%), Education Instruction & Library (100.0%), and Management (88.9%).
| Occupation | Male | Female |
| Management | 1 (11.1%) | 8 (88.9%) |
| Business & Financial | 0 (0.0%) | 2 (100.0%) |
| Computers, Engineering & Science | 3 (100.0%) | 0 (0.0%) |
| Computers & Mathematics | 0 (0.0%) | 0 (0.0%) |
| Architecture & Engineering | 3 (100.0%) | 0 (0.0%) |
| Life, Physical & Social Science | 0 (0.0%) | 0 (0.0%) |
| Community & Social Service | 3 (50.0%) | 3 (50.0%) |
| Education, Arts & Media | 0 (0.0%) | 0 (0.0%) |
| Legal Services & Support | 3 (100.0%) | 0 (0.0%) |
| Education Instruction & Library | 0 (0.0%) | 3 (100.0%) |
| Arts, Media & Entertainment | 0 (0.0%) | 0 (0.0%) |
| Health Diagnosing & Treating | 0 (0.0%) | 0 (0.0%) |
| Health Technologists | 0 (0.0%) | 0 (0.0%) |
| Total (Category) | 7 (35.0%) | 13 (65.0%) |
| Total (Overall) | 32 (55.2%) | 26 (44.8%) |
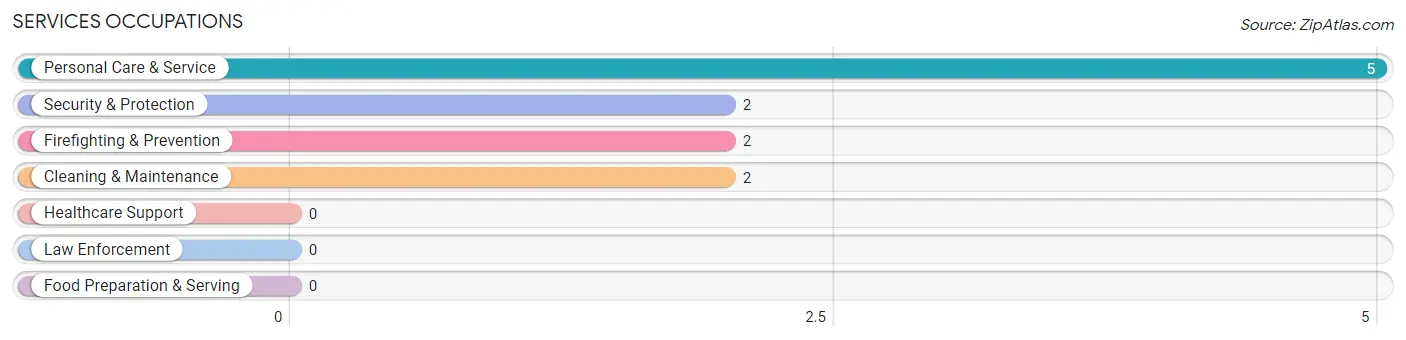
Services Occupations
The most common Services occupations in Brownville are Personal Care & Service (5 | 8.6%), Security & Protection (2 | 3.5%), Firefighting & Prevention (2 | 3.5%), and Cleaning & Maintenance (2 | 3.5%).
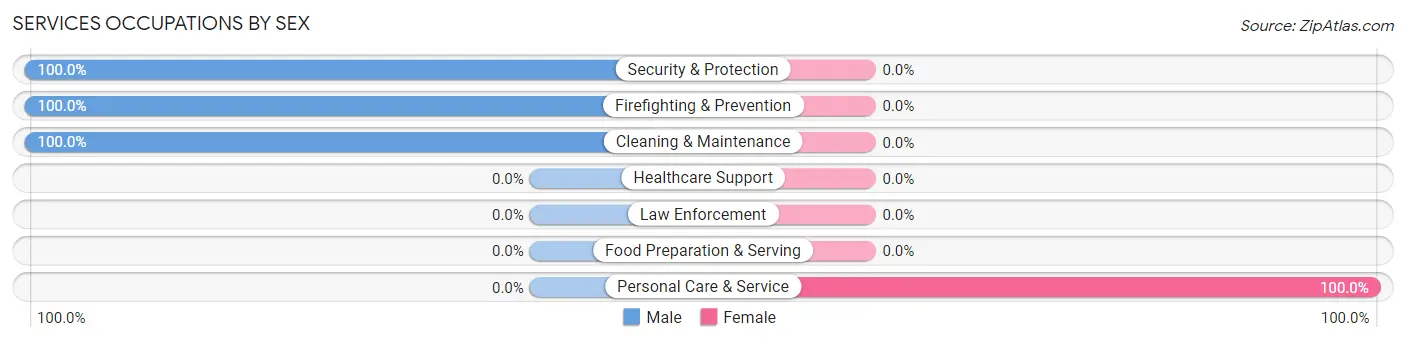
Services Occupations by Sex
| Occupation | Male | Female |
| Healthcare Support | 0 (0.0%) | 0 (0.0%) |
| Security & Protection | 2 (100.0%) | 0 (0.0%) |
| Firefighting & Prevention | 2 (100.0%) | 0 (0.0%) |
| Law Enforcement | 0 (0.0%) | 0 (0.0%) |
| Food Preparation & Serving | 0 (0.0%) | 0 (0.0%) |
| Cleaning & Maintenance | 2 (100.0%) | 0 (0.0%) |
| Personal Care & Service | 0 (0.0%) | 5 (100.0%) |
| Total (Category) | 4 (44.4%) | 5 (55.6%) |
| Total (Overall) | 32 (55.2%) | 26 (44.8%) |
Sales and Office Occupations
The most common Sales and Office occupations in Brownville are Office & Administration (7 | 12.1%), and Sales & Related (5 | 8.6%).

Sales and Office Occupations by Sex

| Occupation | Male | Female |
| Sales & Related | 5 (100.0%) | 0 (0.0%) |
| Office & Administration | 2 (28.6%) | 5 (71.4%) |
| Total (Category) | 7 (58.3%) | 5 (41.7%) |
| Total (Overall) | 32 (55.2%) | 26 (44.8%) |
Natural Resources, Construction and Maintenance Occupations
The most common Natural Resources, Construction and Maintenance occupations in Brownville are , and Construction & Extraction (3 | 5.2%).

Natural Resources, Construction and Maintenance Occupations by Sex
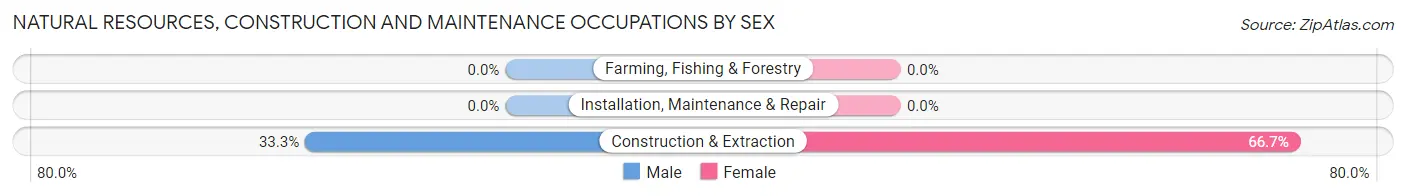
| Occupation | Male | Female |
| Farming, Fishing & Forestry | 0 (0.0%) | 0 (0.0%) |
| Construction & Extraction | 1 (33.3%) | 2 (66.7%) |
| Installation, Maintenance & Repair | 0 (0.0%) | 0 (0.0%) |
| Total (Category) | 1 (33.3%) | 2 (66.7%) |
| Total (Overall) | 32 (55.2%) | 26 (44.8%) |
Production, Transportation and Moving Occupations
The most common Production, Transportation and Moving occupations in Brownville are Production (13 | 22.4%), and Material Moving (1 | 1.7%).
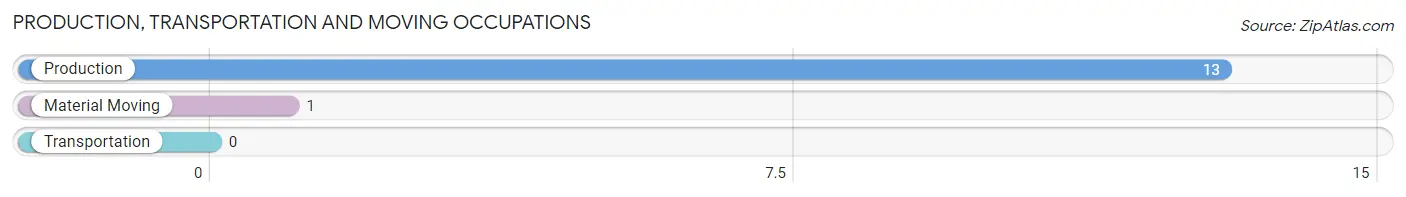
Production, Transportation and Moving Occupations by Sex
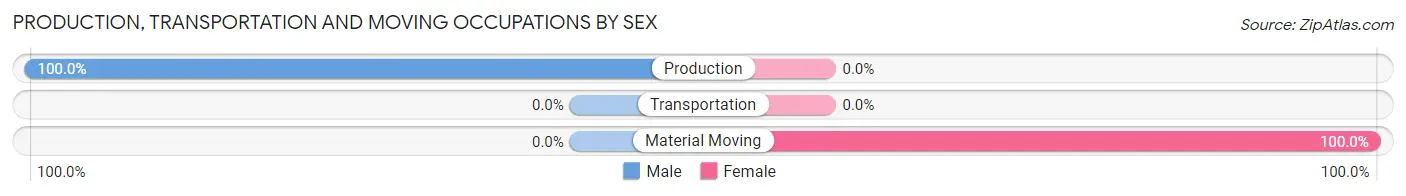
| Occupation | Male | Female |
| Production | 13 (100.0%) | 0 (0.0%) |
| Transportation | 0 (0.0%) | 0 (0.0%) |
| Material Moving | 0 (0.0%) | 1 (100.0%) |
| Total (Category) | 13 (92.9%) | 1 (7.1%) |
| Total (Overall) | 32 (55.2%) | 26 (44.8%) |
Employment Industries by Sex in Brownville
Employment Industries in Brownville
The major employment industries in Brownville include Utilities (16 | 27.6%), Educational Services (10 | 17.2%), Public Administration (8 | 13.8%), Manufacturing (4 | 6.9%), and Health Care & Social Assistance (4 | 6.9%).
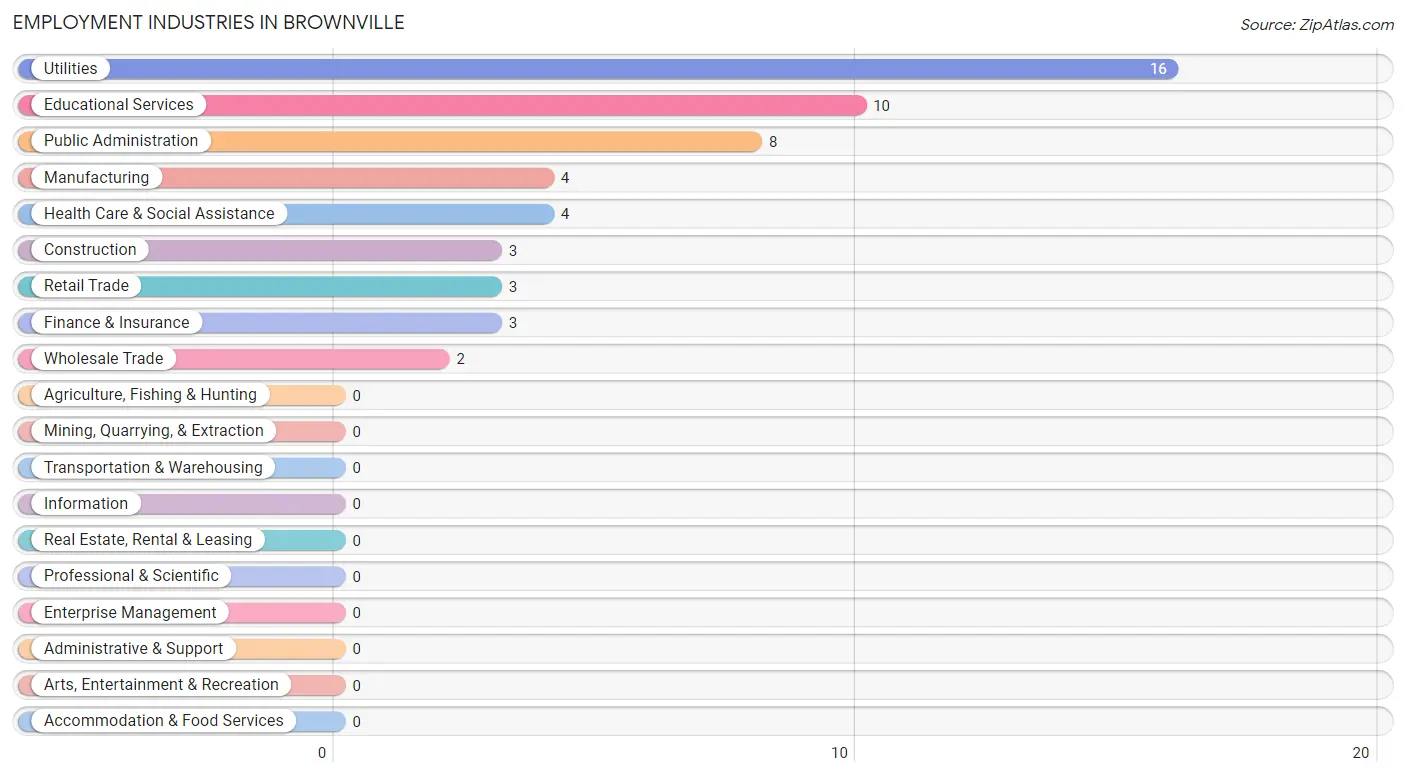
Employment Industries by Sex in Brownville
The Brownville industries that see more men than women are Manufacturing (100.0%), Wholesale Trade (100.0%), and Retail Trade (100.0%), whereas the industries that tend to have a higher number of women are Finance & Insurance (100.0%), Health Care & Social Assistance (100.0%), and Construction (66.7%).
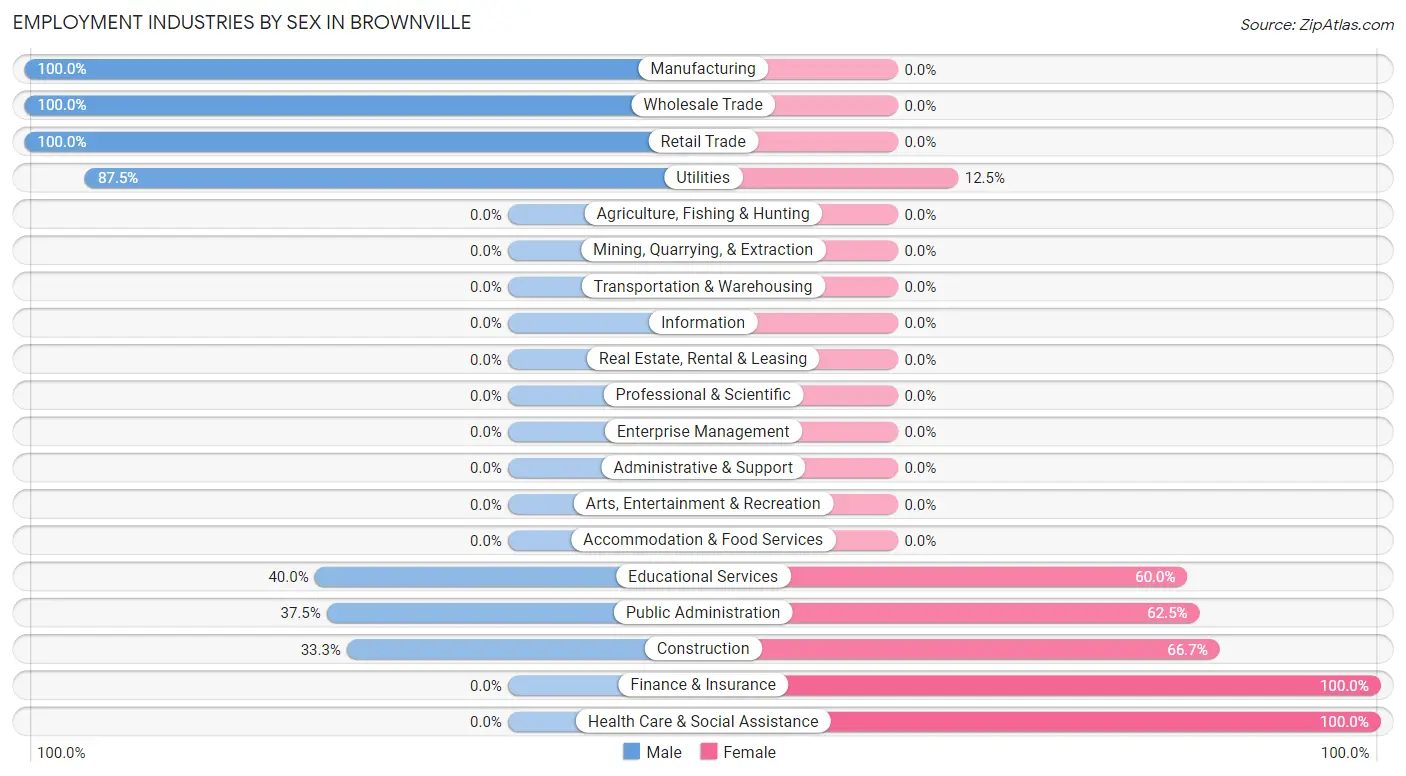
| Industry | Male | Female |
| Agriculture, Fishing & Hunting | 0 (0.0%) | 0 (0.0%) |
| Mining, Quarrying, & Extraction | 0 (0.0%) | 0 (0.0%) |
| Construction | 1 (33.3%) | 2 (66.7%) |
| Manufacturing | 4 (100.0%) | 0 (0.0%) |
| Wholesale Trade | 2 (100.0%) | 0 (0.0%) |
| Retail Trade | 3 (100.0%) | 0 (0.0%) |
| Transportation & Warehousing | 0 (0.0%) | 0 (0.0%) |
| Utilities | 14 (87.5%) | 2 (12.5%) |
| Information | 0 (0.0%) | 0 (0.0%) |
| Finance & Insurance | 0 (0.0%) | 3 (100.0%) |
| Real Estate, Rental & Leasing | 0 (0.0%) | 0 (0.0%) |
| Professional & Scientific | 0 (0.0%) | 0 (0.0%) |
| Enterprise Management | 0 (0.0%) | 0 (0.0%) |
| Administrative & Support | 0 (0.0%) | 0 (0.0%) |
| Educational Services | 4 (40.0%) | 6 (60.0%) |
| Health Care & Social Assistance | 0 (0.0%) | 4 (100.0%) |
| Arts, Entertainment & Recreation | 0 (0.0%) | 0 (0.0%) |
| Accommodation & Food Services | 0 (0.0%) | 0 (0.0%) |
| Public Administration | 3 (37.5%) | 5 (62.5%) |
| Total | 32 (55.2%) | 26 (44.8%) |
Education in Brownville
School Enrollment in Brownville
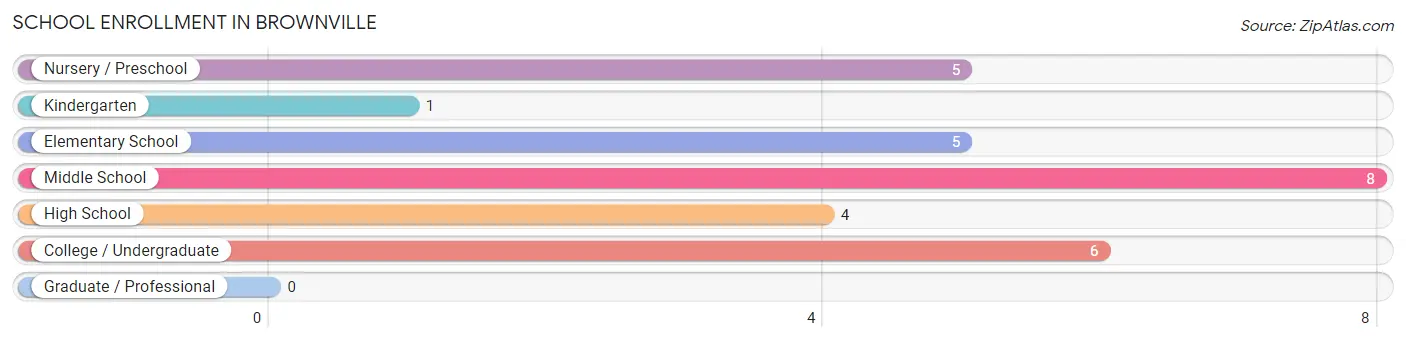
The most common levels of schooling among the 29 students in Brownville are middle school (8 | 27.6%), college / undergraduate (6 | 20.7%), and nursery / preschool (5 | 17.2%).
| School Level | # Students | % Students |
| Nursery / Preschool | 5 | 17.2% |
| Kindergarten | 1 | 3.5% |
| Elementary School | 5 | 17.2% |
| Middle School | 8 | 27.6% |
| High School | 4 | 13.8% |
| College / Undergraduate | 6 | 20.7% |
| Graduate / Professional | 0 | 0.0% |
| Total | 29 | 100.0% |
School Enrollment by Age by Funding Source in Brownville
Out of a total of 29 students who are enrolled in schools in Brownville, 5 (17.2%) attend a private institution, while the remaining 24 (82.8%) are enrolled in public schools. The age group of 5 to 9 year old has the highest likelihood of being enrolled in private schools, with 5 (45.5% in the age bracket) enrolled. Conversely, the age group of 10 to 14 year olds has the lowest likelihood of being enrolled in a private school, with 9 (100.0% in the age bracket) attending a public institution.
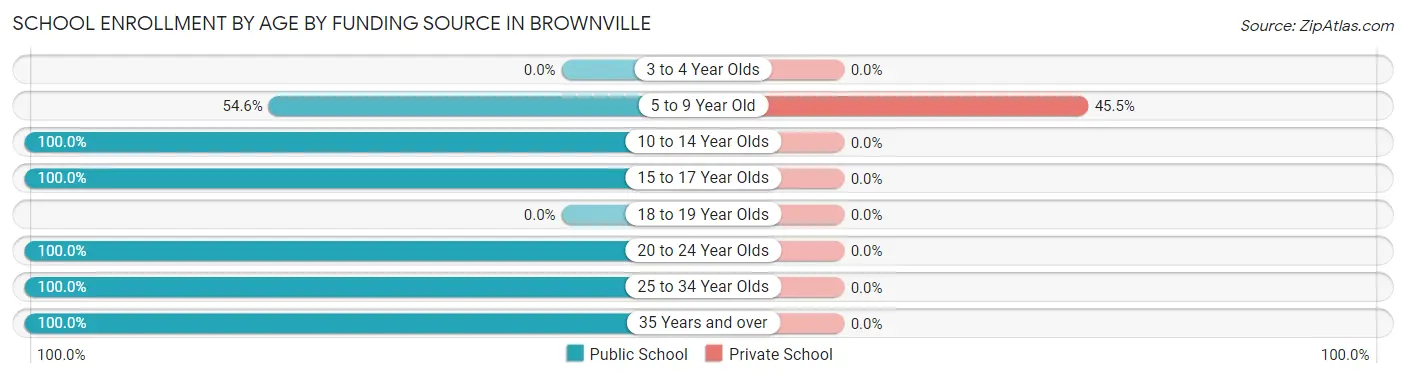
| Age Bracket | Public School | Private School |
| 3 to 4 Year Olds | 0 (0.0%) | 0 (0.0%) |
| 5 to 9 Year Old | 6 (54.5%) | 5 (45.5%) |
| 10 to 14 Year Olds | 9 (100.0%) | 0 (0.0%) |
| 15 to 17 Year Olds | 3 (100.0%) | 0 (0.0%) |
| 18 to 19 Year Olds | 0 (0.0%) | 0 (0.0%) |
| 20 to 24 Year Olds | 2 (100.0%) | 0 (0.0%) |
| 25 to 34 Year Olds | 1 (100.0%) | 0 (0.0%) |
| 35 Years and over | 3 (100.0%) | 0 (0.0%) |
| Total | 24 (82.8%) | 5 (17.2%) |
Educational Attainment by Field of Study in Brownville
Business (11 | 34.4%), visual & performing arts (8 | 25.0%), engineering (4 | 12.5%), education (3 | 9.4%), and liberal arts & history (3 | 9.4%) are the most common fields of study among 32 individuals in Brownville who have obtained a bachelor's degree or higher.
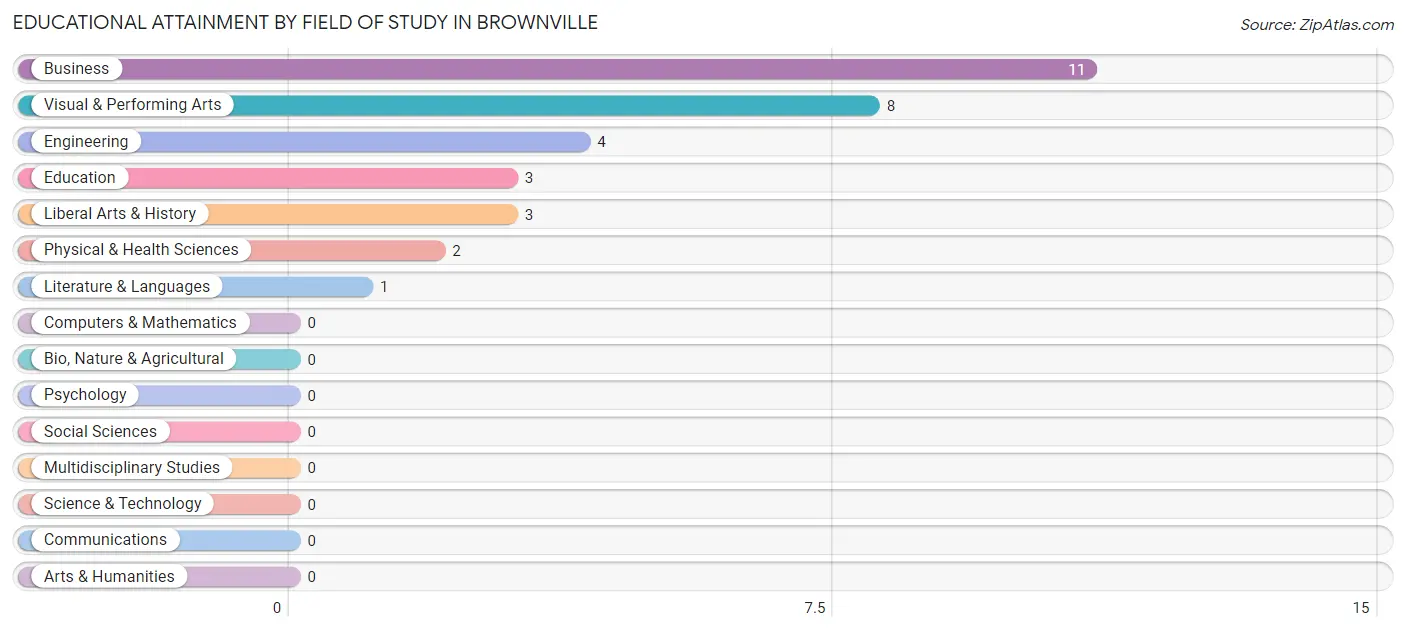
| Field of Study | # Graduates | % Graduates |
| Computers & Mathematics | 0 | 0.0% |
| Bio, Nature & Agricultural | 0 | 0.0% |
| Physical & Health Sciences | 2 | 6.2% |
| Psychology | 0 | 0.0% |
| Social Sciences | 0 | 0.0% |
| Engineering | 4 | 12.5% |
| Multidisciplinary Studies | 0 | 0.0% |
| Science & Technology | 0 | 0.0% |
| Business | 11 | 34.4% |
| Education | 3 | 9.4% |
| Literature & Languages | 1 | 3.1% |
| Liberal Arts & History | 3 | 9.4% |
| Visual & Performing Arts | 8 | 25.0% |
| Communications | 0 | 0.0% |
| Arts & Humanities | 0 | 0.0% |
| Total | 32 | 100.0% |
Transportation & Commute in Brownville
Vehicle Availability by Sex in Brownville
The most prevalent vehicle ownership categories in Brownville are males with 2 vehicles (12, accounting for 38.7%) and females with 2 vehicles (12, making up 46.2%).
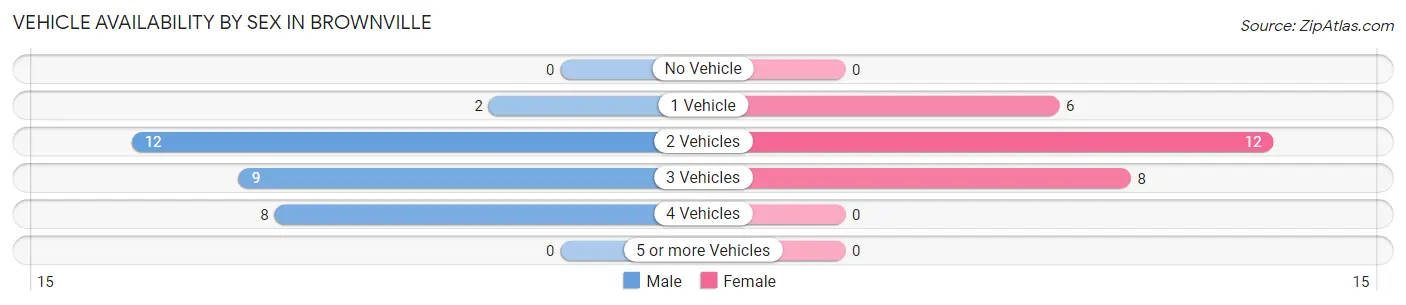
| Vehicles Available | Male | Female |
| No Vehicle | 0 (0.0%) | 0 (0.0%) |
| 1 Vehicle | 2 (6.5%) | 6 (23.1%) |
| 2 Vehicles | 12 (38.7%) | 12 (46.2%) |
| 3 Vehicles | 9 (29.0%) | 8 (30.8%) |
| 4 Vehicles | 8 (25.8%) | 0 (0.0%) |
| 5 or more Vehicles | 0 (0.0%) | 0 (0.0%) |
| Total | 31 (100.0%) | 26 (100.0%) |
Commute Time in Brownville
The most frequently occuring commute durations in Brownville are 10 to 14 minutes (19 commuters, 41.3%), 15 to 19 minutes (11 commuters, 23.9%), and 5 to 9 minutes (7 commuters, 15.2%).
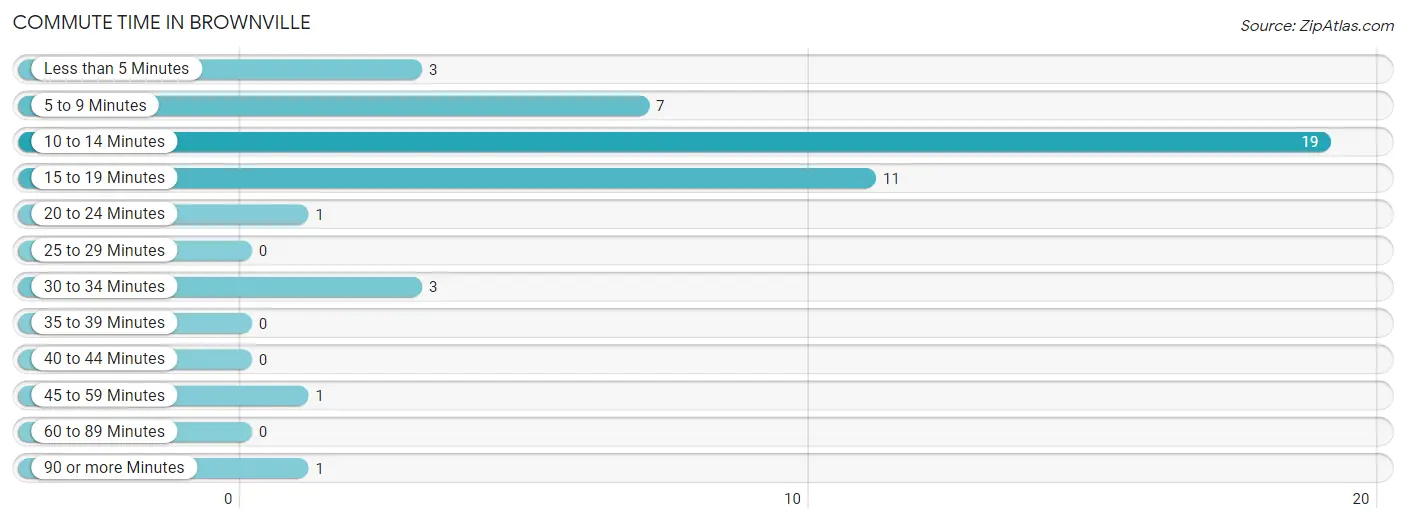
| Commute Time | # Commuters | % Commuters |
| Less than 5 Minutes | 3 | 6.5% |
| 5 to 9 Minutes | 7 | 15.2% |
| 10 to 14 Minutes | 19 | 41.3% |
| 15 to 19 Minutes | 11 | 23.9% |
| 20 to 24 Minutes | 1 | 2.2% |
| 25 to 29 Minutes | 0 | 0.0% |
| 30 to 34 Minutes | 3 | 6.5% |
| 35 to 39 Minutes | 0 | 0.0% |
| 40 to 44 Minutes | 0 | 0.0% |
| 45 to 59 Minutes | 1 | 2.2% |
| 60 to 89 Minutes | 0 | 0.0% |
| 90 or more Minutes | 1 | 2.2% |
Commute Time by Sex in Brownville
The most common commute times in Brownville are 10 to 14 minutes (14 commuters, 53.8%) for males and 15 to 19 minutes (8 commuters, 40.0%) for females.
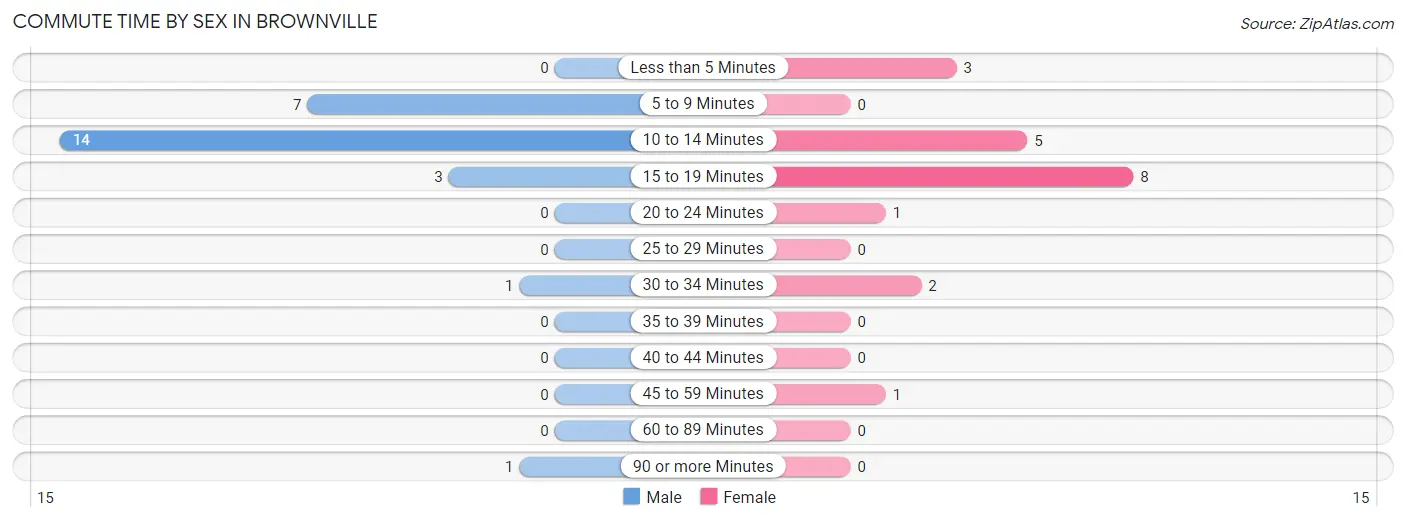
| Commute Time | Male | Female |
| Less than 5 Minutes | 0 (0.0%) | 3 (15.0%) |
| 5 to 9 Minutes | 7 (26.9%) | 0 (0.0%) |
| 10 to 14 Minutes | 14 (53.8%) | 5 (25.0%) |
| 15 to 19 Minutes | 3 (11.5%) | 8 (40.0%) |
| 20 to 24 Minutes | 0 (0.0%) | 1 (5.0%) |
| 25 to 29 Minutes | 0 (0.0%) | 0 (0.0%) |
| 30 to 34 Minutes | 1 (3.8%) | 2 (10.0%) |
| 35 to 39 Minutes | 0 (0.0%) | 0 (0.0%) |
| 40 to 44 Minutes | 0 (0.0%) | 0 (0.0%) |
| 45 to 59 Minutes | 0 (0.0%) | 1 (5.0%) |
| 60 to 89 Minutes | 0 (0.0%) | 0 (0.0%) |
| 90 or more Minutes | 1 (3.8%) | 0 (0.0%) |
Time of Departure to Work by Sex in Brownville
The most frequent times of departure to work in Brownville are 7:00 AM to 7:29 AM (8, 30.8%) for males and 7:30 AM to 7:59 AM (11, 55.0%) for females.
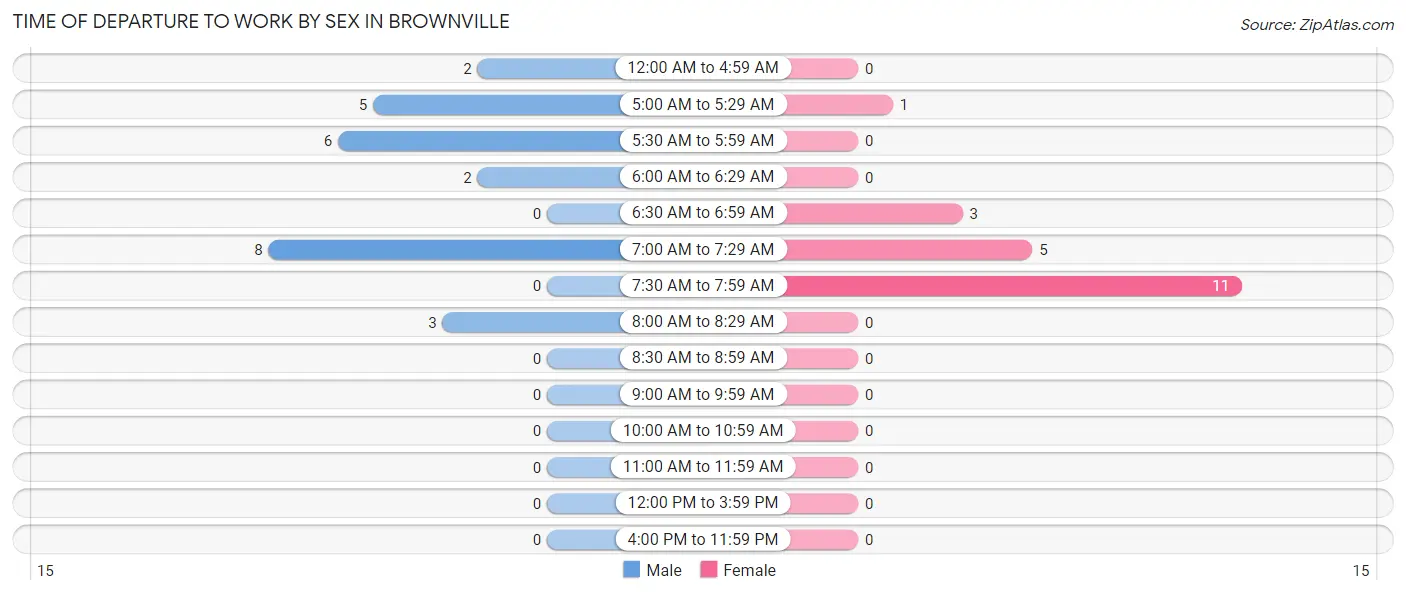
| Time of Departure | Male | Female |
| 12:00 AM to 4:59 AM | 2 (7.7%) | 0 (0.0%) |
| 5:00 AM to 5:29 AM | 5 (19.2%) | 1 (5.0%) |
| 5:30 AM to 5:59 AM | 6 (23.1%) | 0 (0.0%) |
| 6:00 AM to 6:29 AM | 2 (7.7%) | 0 (0.0%) |
| 6:30 AM to 6:59 AM | 0 (0.0%) | 3 (15.0%) |
| 7:00 AM to 7:29 AM | 8 (30.8%) | 5 (25.0%) |
| 7:30 AM to 7:59 AM | 0 (0.0%) | 11 (55.0%) |
| 8:00 AM to 8:29 AM | 3 (11.5%) | 0 (0.0%) |
| 8:30 AM to 8:59 AM | 0 (0.0%) | 0 (0.0%) |
| 9:00 AM to 9:59 AM | 0 (0.0%) | 0 (0.0%) |
| 10:00 AM to 10:59 AM | 0 (0.0%) | 0 (0.0%) |
| 11:00 AM to 11:59 AM | 0 (0.0%) | 0 (0.0%) |
| 12:00 PM to 3:59 PM | 0 (0.0%) | 0 (0.0%) |
| 4:00 PM to 11:59 PM | 0 (0.0%) | 0 (0.0%) |
| Total | 26 (100.0%) | 20 (100.0%) |
Housing Occupancy in Brownville
Occupancy by Ownership in Brownville
Of the total 62 dwellings in Brownville, owner-occupied units account for 52 (83.9%), while renter-occupied units make up 10 (16.1%).
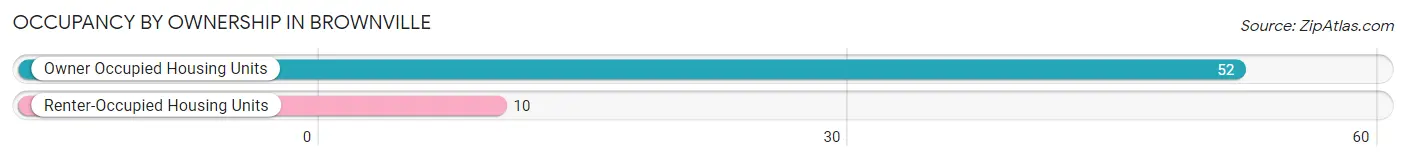
| Occupancy | # Housing Units | % Housing Units |
| Owner Occupied Housing Units | 52 | 83.9% |
| Renter-Occupied Housing Units | 10 | 16.1% |
| Total Occupied Housing Units | 62 | 100.0% |
Occupancy by Household Size in Brownville
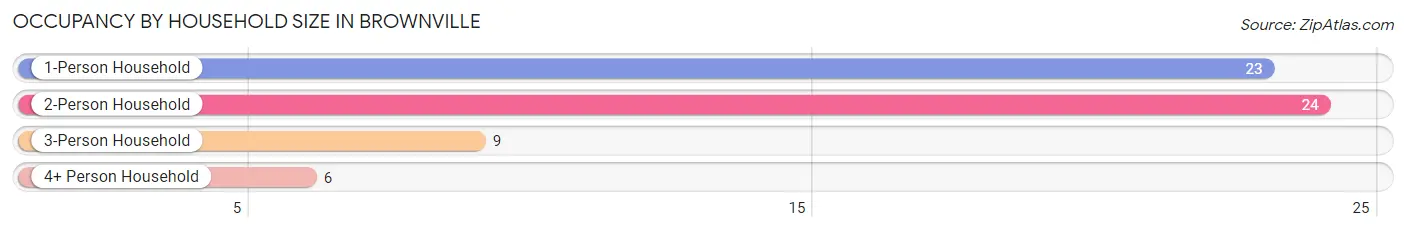
| Household Size | # Housing Units | % Housing Units |
| 1-Person Household | 23 | 37.1% |
| 2-Person Household | 24 | 38.7% |
| 3-Person Household | 9 | 14.5% |
| 4+ Person Household | 6 | 9.7% |
| Total Housing Units | 62 | 100.0% |
Occupancy by Ownership by Household Size in Brownville
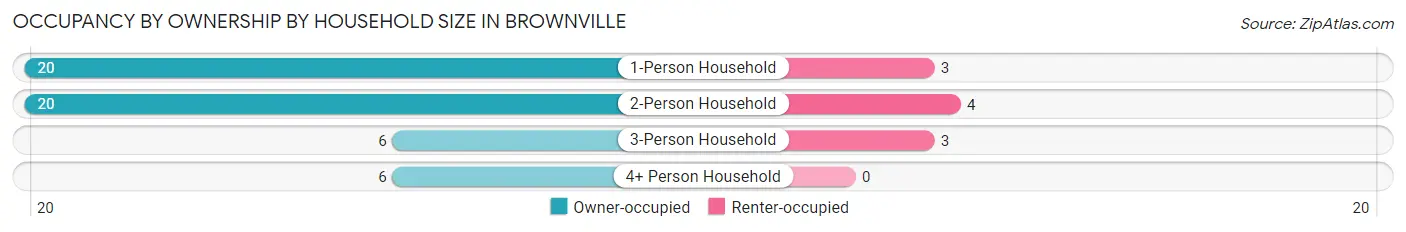
| Household Size | Owner-occupied | Renter-occupied |
| 1-Person Household | 20 (87.0%) | 3 (13.0%) |
| 2-Person Household | 20 (83.3%) | 4 (16.7%) |
| 3-Person Household | 6 (66.7%) | 3 (33.3%) |
| 4+ Person Household | 6 (100.0%) | 0 (0.0%) |
| Total Housing Units | 52 (83.9%) | 10 (16.1%) |
Occupancy by Educational Attainment in Brownville
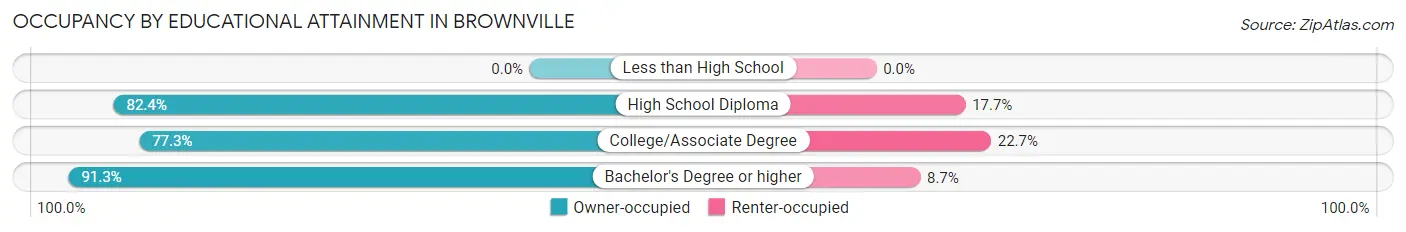
| Household Size | Owner-occupied | Renter-occupied |
| Less than High School | 0 (0.0%) | 0 (0.0%) |
| High School Diploma | 14 (82.4%) | 3 (17.6%) |
| College/Associate Degree | 17 (77.3%) | 5 (22.7%) |
| Bachelor's Degree or higher | 21 (91.3%) | 2 (8.7%) |
Occupancy by Age of Householder in Brownville
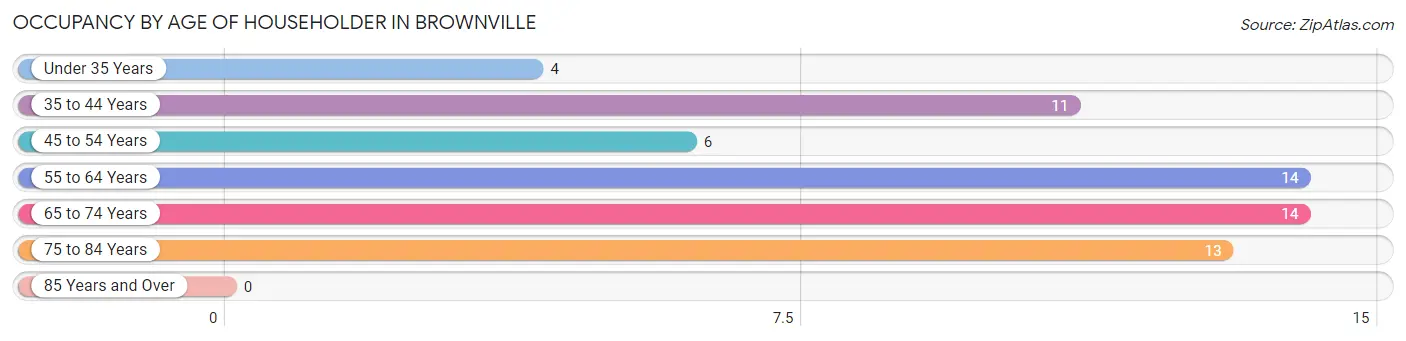
| Age Bracket | # Households | % Households |
| Under 35 Years | 4 | 6.5% |
| 35 to 44 Years | 11 | 17.7% |
| 45 to 54 Years | 6 | 9.7% |
| 55 to 64 Years | 14 | 22.6% |
| 65 to 74 Years | 14 | 22.6% |
| 75 to 84 Years | 13 | 21.0% |
| 85 Years and Over | 0 | 0.0% |
| Total | 62 | 100.0% |
Housing Finances in Brownville
Median Income by Occupancy in Brownville
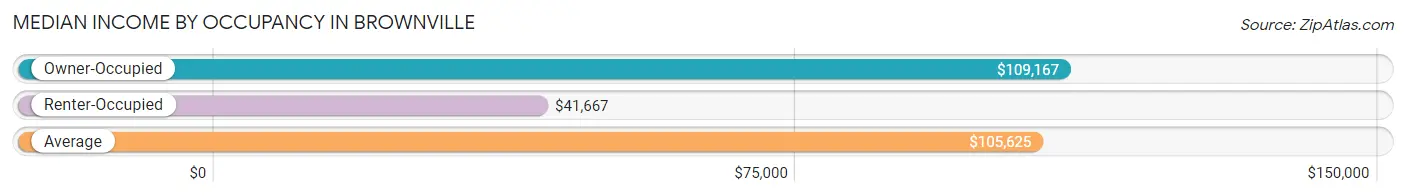
| Occupancy Type | # Households | Median Income |
| Owner-Occupied | 52 (83.9%) | $109,167 |
| Renter-Occupied | 10 (16.1%) | $41,667 |
| Average | 62 (100.0%) | $105,625 |
Occupancy by Householder Income Bracket in Brownville
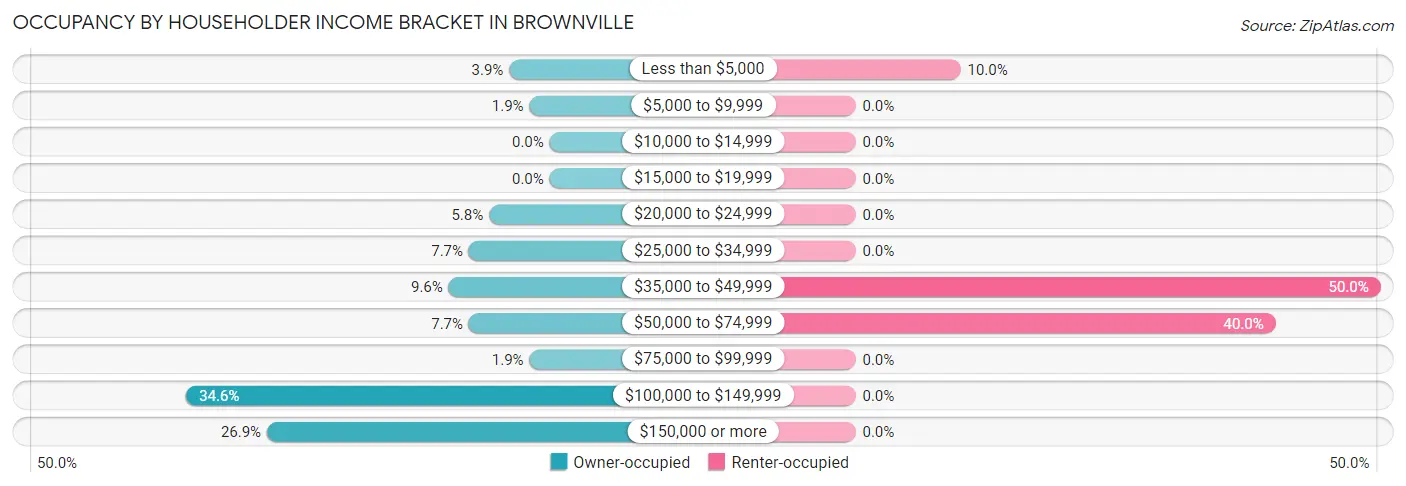
| Income Bracket | Owner-occupied | Renter-occupied |
| Less than $5,000 | 2 (3.8%) | 1 (10.0%) |
| $5,000 to $9,999 | 1 (1.9%) | 0 (0.0%) |
| $10,000 to $14,999 | 0 (0.0%) | 0 (0.0%) |
| $15,000 to $19,999 | 0 (0.0%) | 0 (0.0%) |
| $20,000 to $24,999 | 3 (5.8%) | 0 (0.0%) |
| $25,000 to $34,999 | 4 (7.7%) | 0 (0.0%) |
| $35,000 to $49,999 | 5 (9.6%) | 5 (50.0%) |
| $50,000 to $74,999 | 4 (7.7%) | 4 (40.0%) |
| $75,000 to $99,999 | 1 (1.9%) | 0 (0.0%) |
| $100,000 to $149,999 | 18 (34.6%) | 0 (0.0%) |
| $150,000 or more | 14 (26.9%) | 0 (0.0%) |
| Total | 52 (100.0%) | 10 (100.0%) |
Monthly Housing Cost Tiers in Brownville
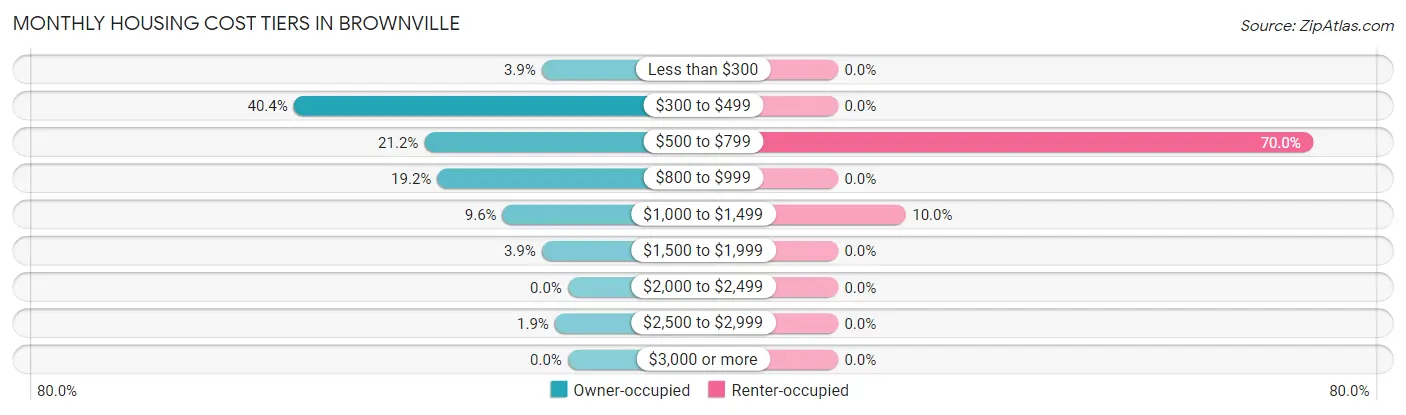
| Monthly Cost | Owner-occupied | Renter-occupied |
| Less than $300 | 2 (3.8%) | 0 (0.0%) |
| $300 to $499 | 21 (40.4%) | 0 (0.0%) |
| $500 to $799 | 11 (21.1%) | 7 (70.0%) |
| $800 to $999 | 10 (19.2%) | 0 (0.0%) |
| $1,000 to $1,499 | 5 (9.6%) | 1 (10.0%) |
| $1,500 to $1,999 | 2 (3.8%) | 0 (0.0%) |
| $2,000 to $2,499 | 0 (0.0%) | 0 (0.0%) |
| $2,500 to $2,999 | 1 (1.9%) | 0 (0.0%) |
| $3,000 or more | 0 (0.0%) | 0 (0.0%) |
| Total | 52 (100.0%) | 10 (100.0%) |
Physical Housing Characteristics in Brownville
Housing Structures in Brownville
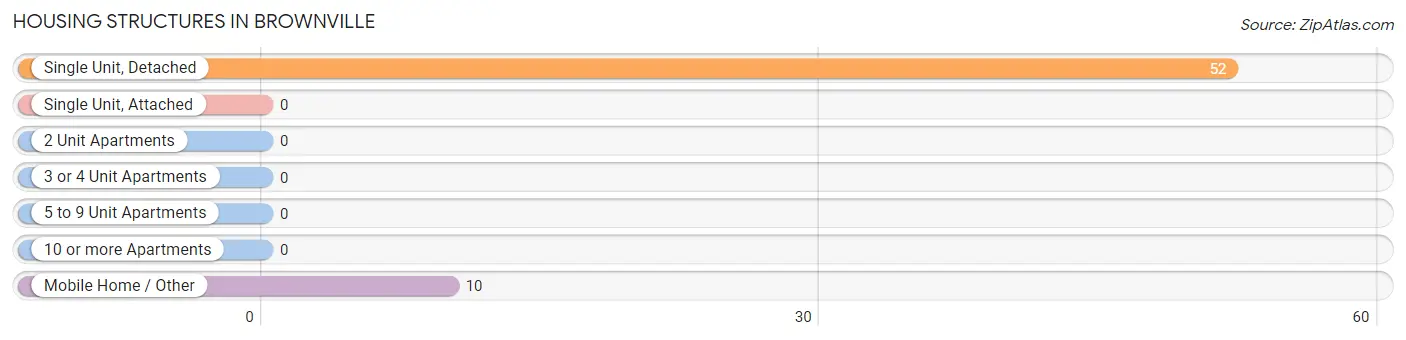
| Structure Type | # Housing Units | % Housing Units |
| Single Unit, Detached | 52 | 83.9% |
| Single Unit, Attached | 0 | 0.0% |
| 2 Unit Apartments | 0 | 0.0% |
| 3 or 4 Unit Apartments | 0 | 0.0% |
| 5 to 9 Unit Apartments | 0 | 0.0% |
| 10 or more Apartments | 0 | 0.0% |
| Mobile Home / Other | 10 | 16.1% |
| Total | 62 | 100.0% |
Housing Structures by Occupancy in Brownville
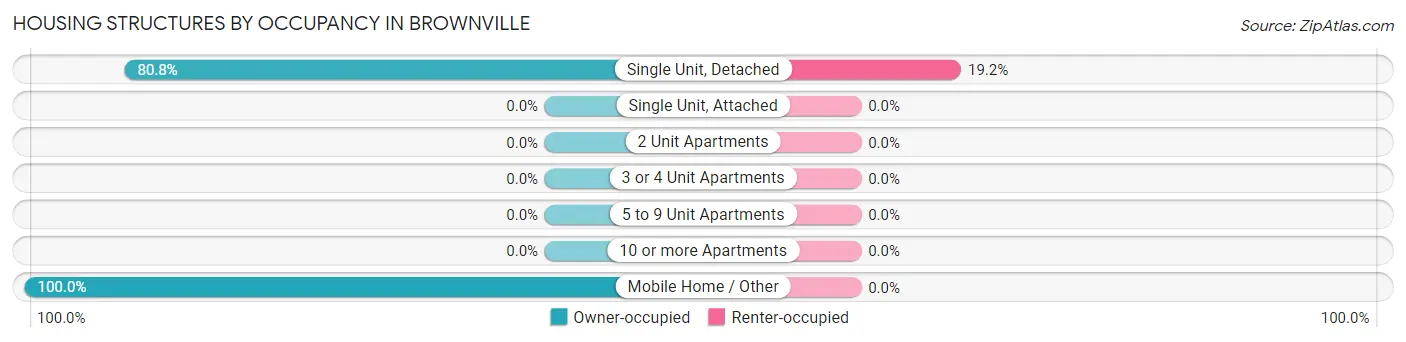
| Structure Type | Owner-occupied | Renter-occupied |
| Single Unit, Detached | 42 (80.8%) | 10 (19.2%) |
| Single Unit, Attached | 0 (0.0%) | 0 (0.0%) |
| 2 Unit Apartments | 0 (0.0%) | 0 (0.0%) |
| 3 or 4 Unit Apartments | 0 (0.0%) | 0 (0.0%) |
| 5 to 9 Unit Apartments | 0 (0.0%) | 0 (0.0%) |
| 10 or more Apartments | 0 (0.0%) | 0 (0.0%) |
| Mobile Home / Other | 10 (100.0%) | 0 (0.0%) |
| Total | 52 (83.9%) | 10 (16.1%) |
Housing Structures by Number of Rooms in Brownville
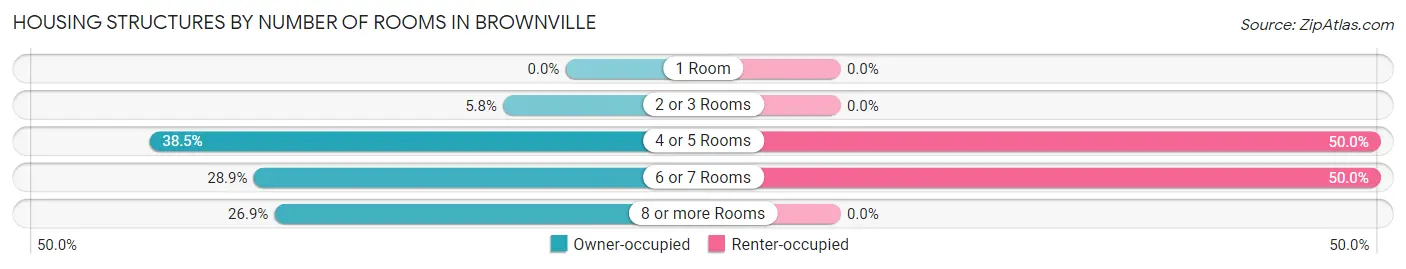
| Number of Rooms | Owner-occupied | Renter-occupied |
| 1 Room | 0 (0.0%) | 0 (0.0%) |
| 2 or 3 Rooms | 3 (5.8%) | 0 (0.0%) |
| 4 or 5 Rooms | 20 (38.5%) | 5 (50.0%) |
| 6 or 7 Rooms | 15 (28.8%) | 5 (50.0%) |
| 8 or more Rooms | 14 (26.9%) | 0 (0.0%) |
| Total | 52 (100.0%) | 10 (100.0%) |
Housing Structure by Heating Type in Brownville
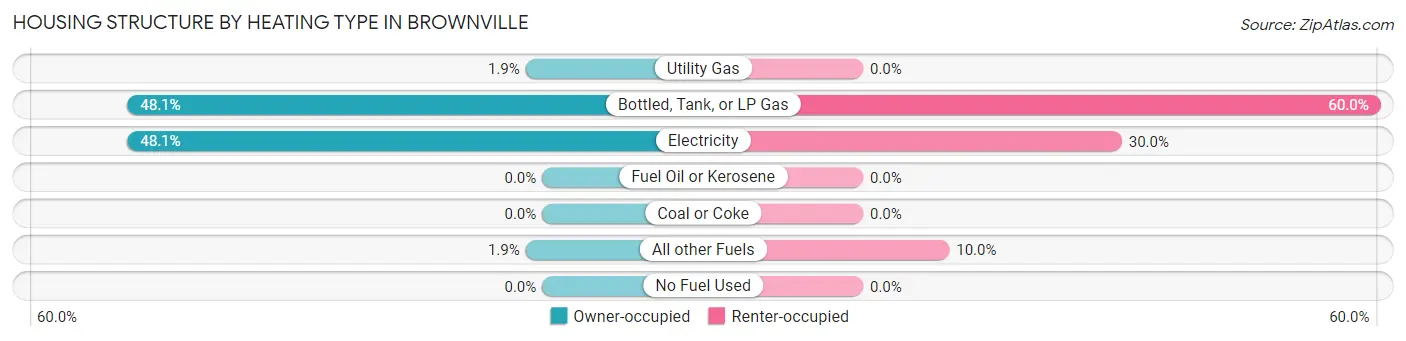
| Heating Type | Owner-occupied | Renter-occupied |
| Utility Gas | 1 (1.9%) | 0 (0.0%) |
| Bottled, Tank, or LP Gas | 25 (48.1%) | 6 (60.0%) |
| Electricity | 25 (48.1%) | 3 (30.0%) |
| Fuel Oil or Kerosene | 0 (0.0%) | 0 (0.0%) |
| Coal or Coke | 0 (0.0%) | 0 (0.0%) |
| All other Fuels | 1 (1.9%) | 1 (10.0%) |
| No Fuel Used | 0 (0.0%) | 0 (0.0%) |
| Total | 52 (100.0%) | 10 (100.0%) |
Household Vehicle Usage in Brownville
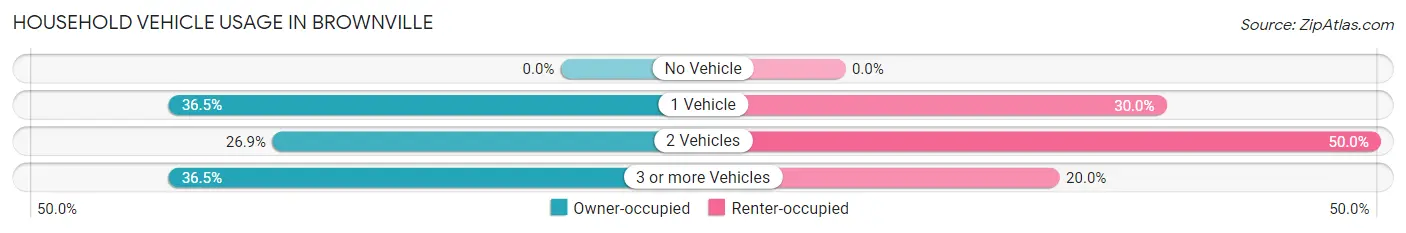
| Vehicles per Household | Owner-occupied | Renter-occupied |
| No Vehicle | 0 (0.0%) | 0 (0.0%) |
| 1 Vehicle | 19 (36.5%) | 3 (30.0%) |
| 2 Vehicles | 14 (26.9%) | 5 (50.0%) |
| 3 or more Vehicles | 19 (36.5%) | 2 (20.0%) |
| Total | 52 (100.0%) | 10 (100.0%) |
Real Estate & Mortgages in Brownville
Real Estate and Mortgage Overview in Brownville
| Characteristic | Without Mortgage | With Mortgage |
| Housing Units | 34 | 18 |
| Median Property Value | $85,000 | $110,000 |
| Median Household Income | $108,333 | $5 |
| Monthly Housing Costs | $450 | $0 |
| Real Estate Taxes | $1,350 | $1 |
Property Value by Mortgage Status in Brownville
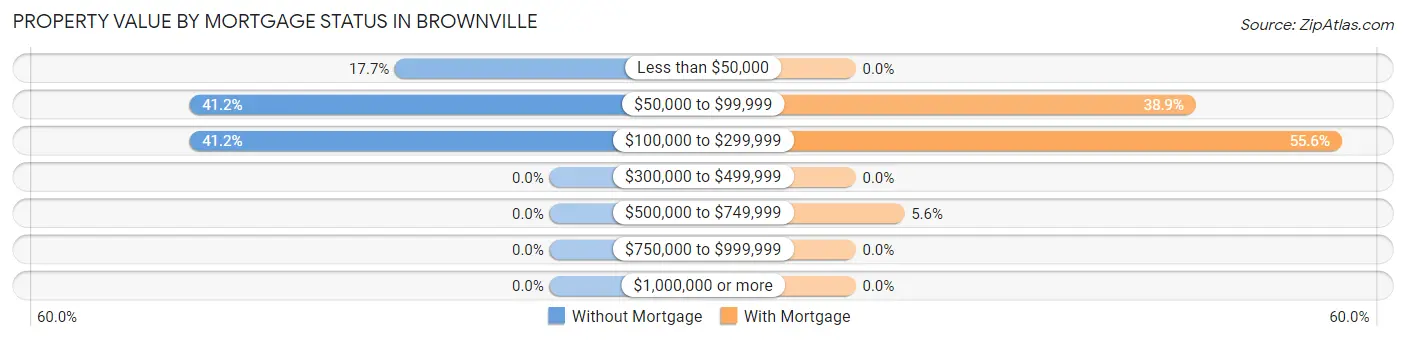
| Property Value | Without Mortgage | With Mortgage |
| Less than $50,000 | 6 (17.6%) | 0 (0.0%) |
| $50,000 to $99,999 | 14 (41.2%) | 7 (38.9%) |
| $100,000 to $299,999 | 14 (41.2%) | 10 (55.6%) |
| $300,000 to $499,999 | 0 (0.0%) | 0 (0.0%) |
| $500,000 to $749,999 | 0 (0.0%) | 1 (5.6%) |
| $750,000 to $999,999 | 0 (0.0%) | 0 (0.0%) |
| $1,000,000 or more | 0 (0.0%) | 0 (0.0%) |
| Total | 34 (100.0%) | 18 (100.0%) |
Household Income by Mortgage Status in Brownville
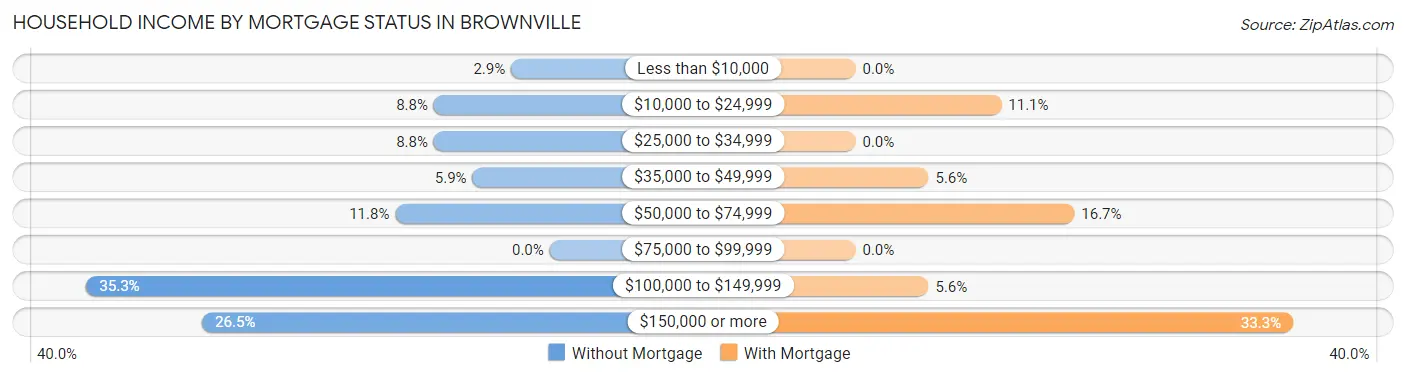
| Household Income | Without Mortgage | With Mortgage |
| Less than $10,000 | 1 (2.9%) | 0 (0.0%) |
| $10,000 to $24,999 | 3 (8.8%) | 2 (11.1%) |
| $25,000 to $34,999 | 3 (8.8%) | 0 (0.0%) |
| $35,000 to $49,999 | 2 (5.9%) | 1 (5.6%) |
| $50,000 to $74,999 | 4 (11.8%) | 3 (16.7%) |
| $75,000 to $99,999 | 0 (0.0%) | 0 (0.0%) |
| $100,000 to $149,999 | 12 (35.3%) | 1 (5.6%) |
| $150,000 or more | 9 (26.5%) | 6 (33.3%) |
| Total | 34 (100.0%) | 18 (100.0%) |
Property Value to Household Income Ratio in Brownville
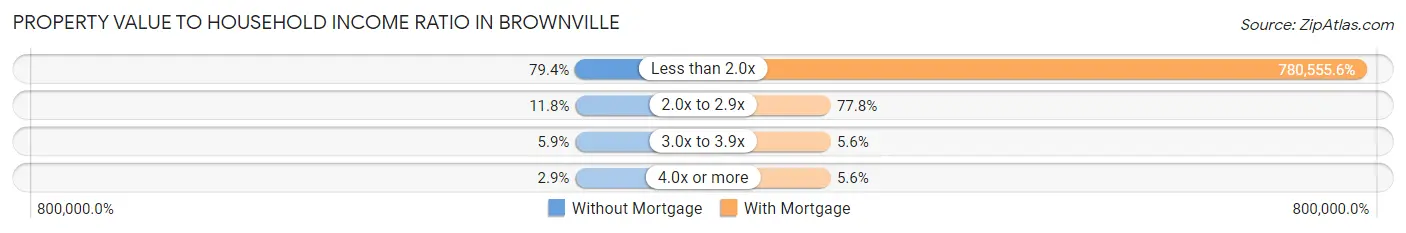
| Value-to-Income Ratio | Without Mortgage | With Mortgage |
| Less than 2.0x | 27 (79.4%) | 140,500 (780,555.6%) |
| 2.0x to 2.9x | 4 (11.8%) | 14 (77.8%) |
| 3.0x to 3.9x | 2 (5.9%) | 1 (5.6%) |
| 4.0x or more | 1 (2.9%) | 1 (5.6%) |
| Total | 34 (100.0%) | 18 (100.0%) |
Real Estate Taxes by Mortgage Status in Brownville
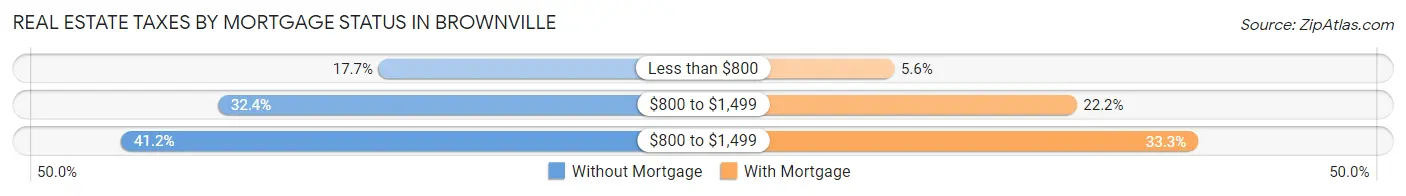
| Property Taxes | Without Mortgage | With Mortgage |
| Less than $800 | 6 (17.6%) | 1 (5.6%) |
| $800 to $1,499 | 11 (32.4%) | 4 (22.2%) |
| $800 to $1,499 | 14 (41.2%) | 6 (33.3%) |
| Total | 34 (100.0%) | 18 (100.0%) |
Health & Disability in Brownville
Health Insurance Coverage by Age in Brownville
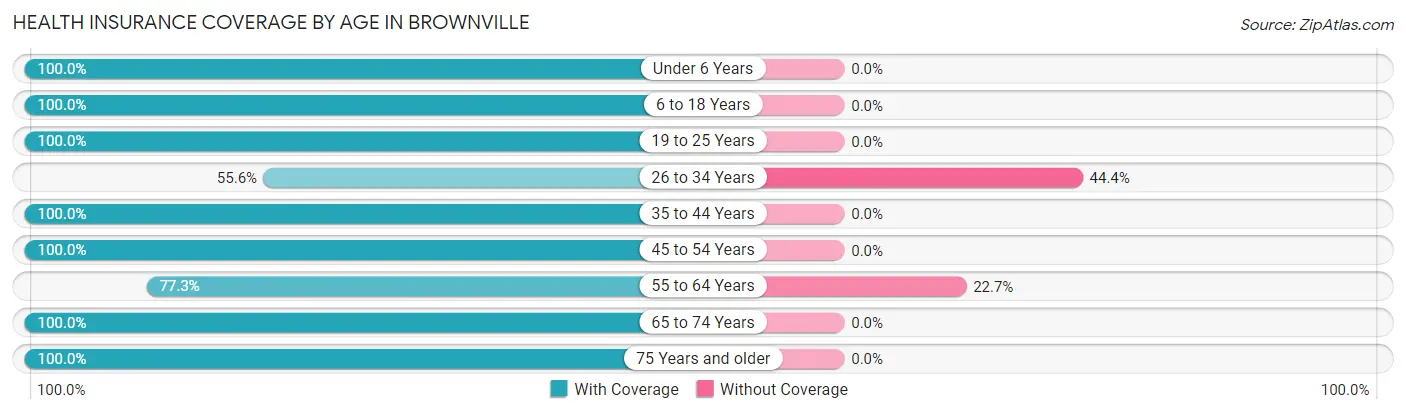
| Age Bracket | With Coverage | Without Coverage |
| Under 6 Years | 12 (100.0%) | 0 (0.0%) |
| 6 to 18 Years | 17 (100.0%) | 0 (0.0%) |
| 19 to 25 Years | 4 (100.0%) | 0 (0.0%) |
| 26 to 34 Years | 10 (55.6%) | 8 (44.4%) |
| 35 to 44 Years | 15 (100.0%) | 0 (0.0%) |
| 45 to 54 Years | 6 (100.0%) | 0 (0.0%) |
| 55 to 64 Years | 17 (77.3%) | 5 (22.7%) |
| 65 to 74 Years | 25 (100.0%) | 0 (0.0%) |
| 75 Years and older | 19 (100.0%) | 0 (0.0%) |
| Total | 125 (90.6%) | 13 (9.4%) |
Health Insurance Coverage by Citizenship Status in Brownville
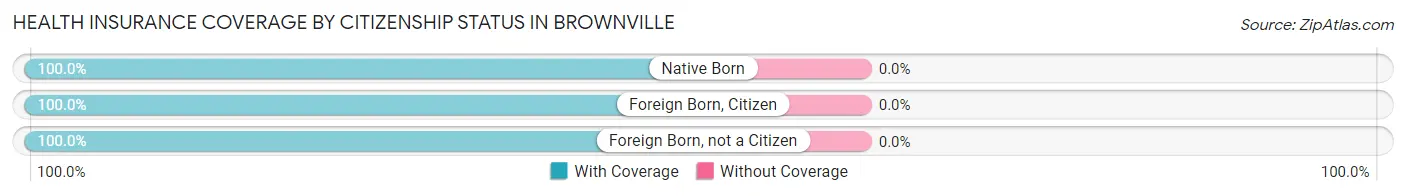
| Citizenship Status | With Coverage | Without Coverage |
| Native Born | 12 (100.0%) | 0 (0.0%) |
| Foreign Born, Citizen | 17 (100.0%) | 0 (0.0%) |
| Foreign Born, not a Citizen | 4 (100.0%) | 0 (0.0%) |
Health Insurance Coverage by Household Income in Brownville
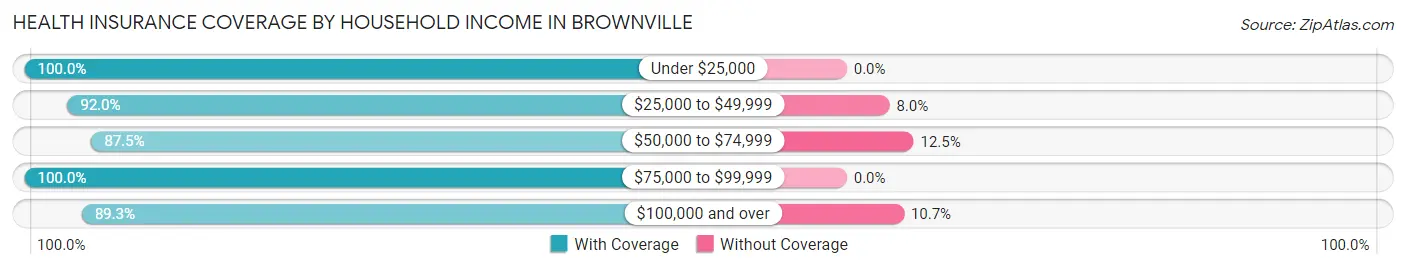
| Household Income | With Coverage | Without Coverage |
| Under $25,000 | 12 (100.0%) | 0 (0.0%) |
| $25,000 to $49,999 | 23 (92.0%) | 2 (8.0%) |
| $50,000 to $74,999 | 14 (87.5%) | 2 (12.5%) |
| $75,000 to $99,999 | 1 (100.0%) | 0 (0.0%) |
| $100,000 and over | 75 (89.3%) | 9 (10.7%) |
Public vs Private Health Insurance Coverage by Age in Brownville
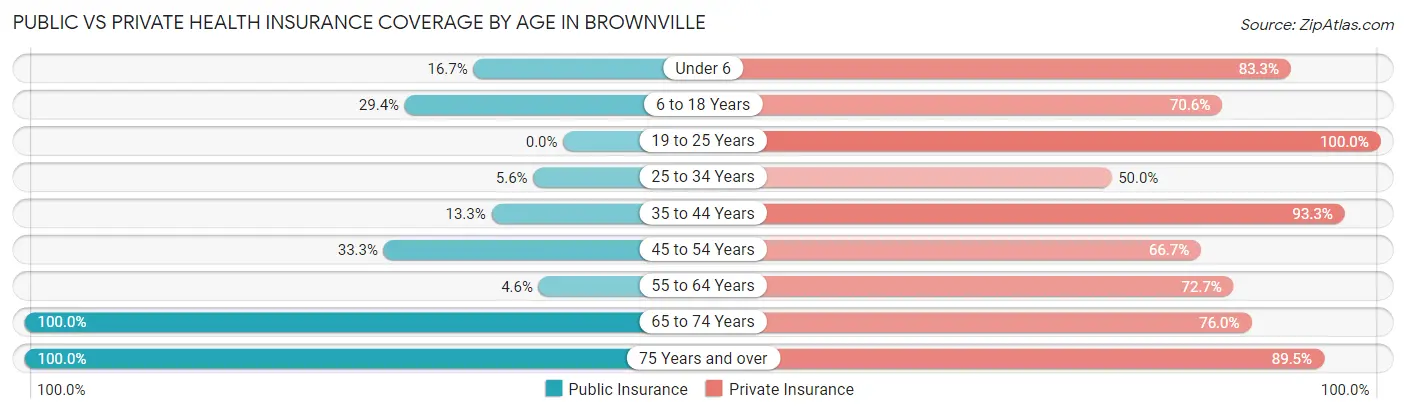
| Age Bracket | Public Insurance | Private Insurance |
| Under 6 | 2 (16.7%) | 10 (83.3%) |
| 6 to 18 Years | 5 (29.4%) | 12 (70.6%) |
| 19 to 25 Years | 0 (0.0%) | 4 (100.0%) |
| 25 to 34 Years | 1 (5.6%) | 9 (50.0%) |
| 35 to 44 Years | 2 (13.3%) | 14 (93.3%) |
| 45 to 54 Years | 2 (33.3%) | 4 (66.7%) |
| 55 to 64 Years | 1 (4.5%) | 16 (72.7%) |
| 65 to 74 Years | 25 (100.0%) | 19 (76.0%) |
| 75 Years and over | 19 (100.0%) | 17 (89.5%) |
| Total | 57 (41.3%) | 105 (76.1%) |
Disability Status by Sex by Age in Brownville
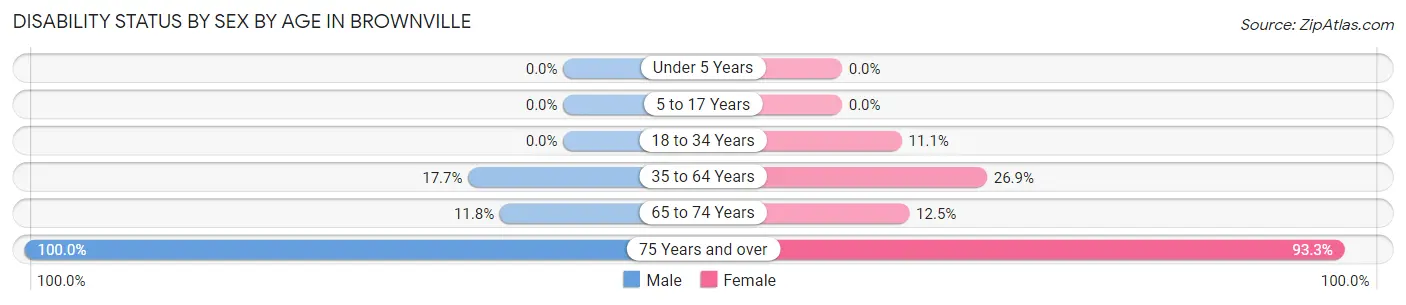
| Age Bracket | Male | Female |
| Under 5 Years | 0 (0.0%) | 0 (0.0%) |
| 5 to 17 Years | 0 (0.0%) | 0 (0.0%) |
| 18 to 34 Years | 0 (0.0%) | 1 (11.1%) |
| 35 to 64 Years | 3 (17.6%) | 7 (26.9%) |
| 65 to 74 Years | 2 (11.8%) | 1 (12.5%) |
| 75 Years and over | 4 (100.0%) | 14 (93.3%) |
Disability Class by Sex by Age in Brownville
Disability Class: Hearing Difficulty
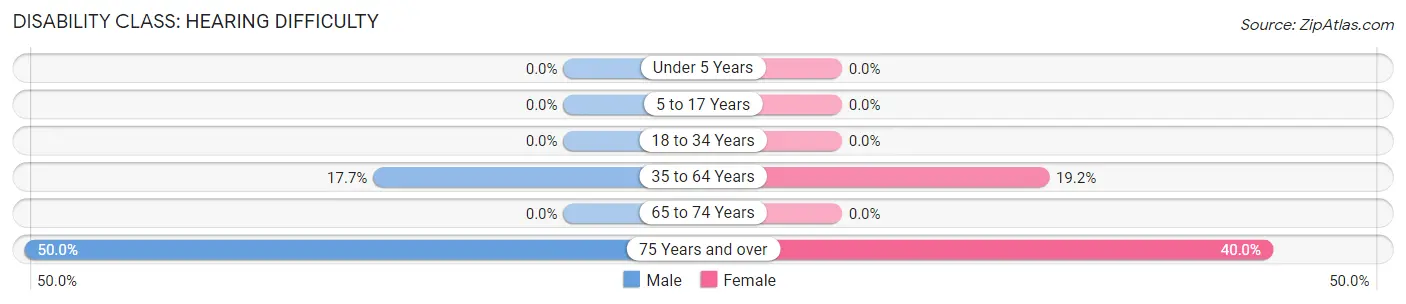
| Age Bracket | Male | Female |
| Under 5 Years | 0 (0.0%) | 0 (0.0%) |
| 5 to 17 Years | 0 (0.0%) | 0 (0.0%) |
| 18 to 34 Years | 0 (0.0%) | 0 (0.0%) |
| 35 to 64 Years | 3 (17.6%) | 5 (19.2%) |
| 65 to 74 Years | 0 (0.0%) | 0 (0.0%) |
| 75 Years and over | 2 (50.0%) | 6 (40.0%) |
Disability Class: Vision Difficulty
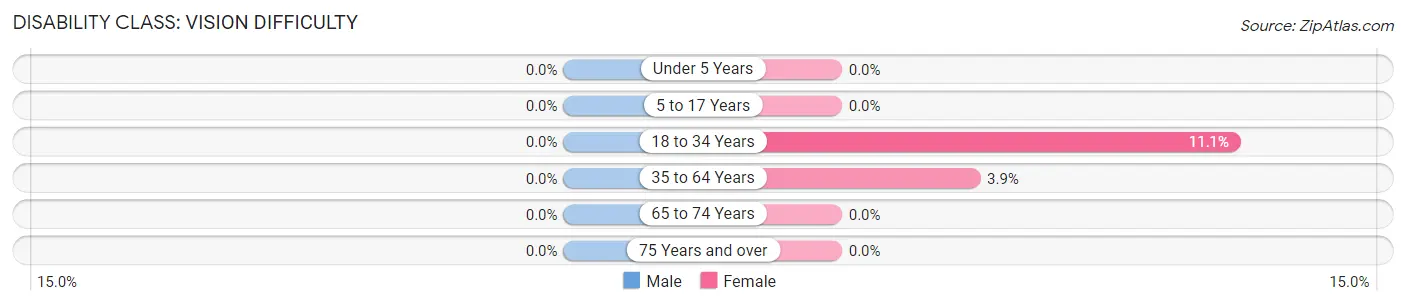
| Age Bracket | Male | Female |
| Under 5 Years | 0 (0.0%) | 0 (0.0%) |
| 5 to 17 Years | 0 (0.0%) | 0 (0.0%) |
| 18 to 34 Years | 0 (0.0%) | 1 (11.1%) |
| 35 to 64 Years | 0 (0.0%) | 1 (3.8%) |
| 65 to 74 Years | 0 (0.0%) | 0 (0.0%) |
| 75 Years and over | 0 (0.0%) | 0 (0.0%) |
Disability Class: Cognitive Difficulty
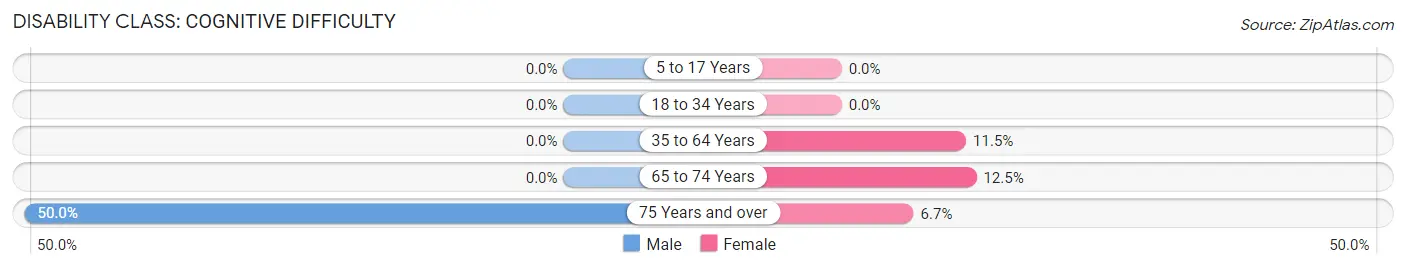
| Age Bracket | Male | Female |
| 5 to 17 Years | 0 (0.0%) | 0 (0.0%) |
| 18 to 34 Years | 0 (0.0%) | 0 (0.0%) |
| 35 to 64 Years | 0 (0.0%) | 3 (11.5%) |
| 65 to 74 Years | 0 (0.0%) | 1 (12.5%) |
| 75 Years and over | 2 (50.0%) | 1 (6.7%) |
Disability Class: Ambulatory Difficulty
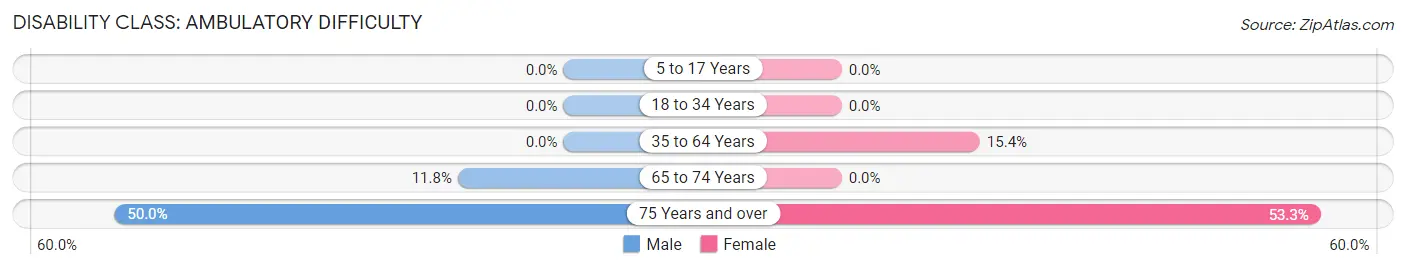
| Age Bracket | Male | Female |
| 5 to 17 Years | 0 (0.0%) | 0 (0.0%) |
| 18 to 34 Years | 0 (0.0%) | 0 (0.0%) |
| 35 to 64 Years | 0 (0.0%) | 4 (15.4%) |
| 65 to 74 Years | 2 (11.8%) | 0 (0.0%) |
| 75 Years and over | 2 (50.0%) | 8 (53.3%) |
Disability Class: Self-Care Difficulty
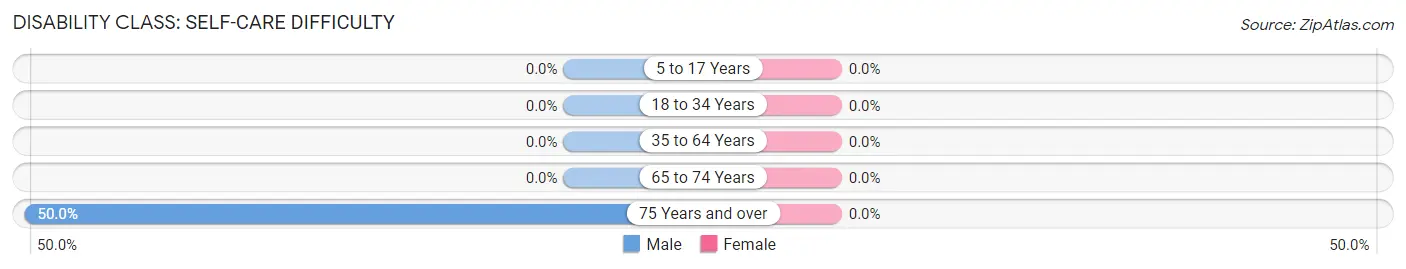
| Age Bracket | Male | Female |
| 5 to 17 Years | 0 (0.0%) | 0 (0.0%) |
| 18 to 34 Years | 0 (0.0%) | 0 (0.0%) |
| 35 to 64 Years | 0 (0.0%) | 0 (0.0%) |
| 65 to 74 Years | 0 (0.0%) | 0 (0.0%) |
| 75 Years and over | 2 (50.0%) | 0 (0.0%) |
Technology Access in Brownville
Computing Device Access in Brownville
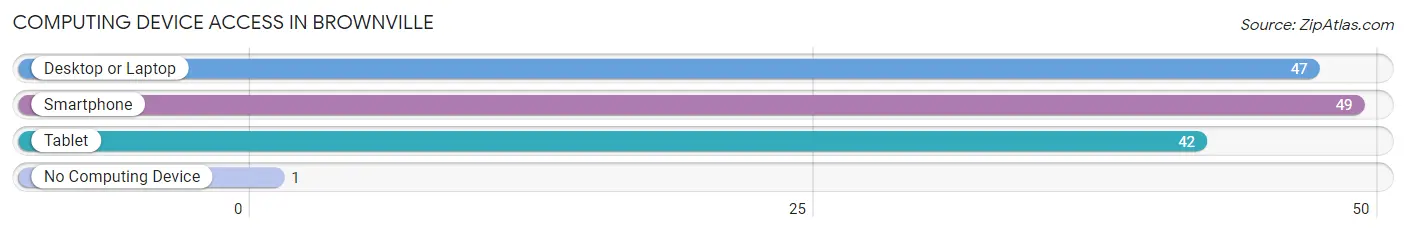
| Device Type | # Households | % Households |
| Desktop or Laptop | 47 | 75.8% |
| Smartphone | 49 | 79.0% |
| Tablet | 42 | 67.7% |
| No Computing Device | 1 | 1.6% |
| Total | 62 | 100.0% |
Internet Access in Brownville
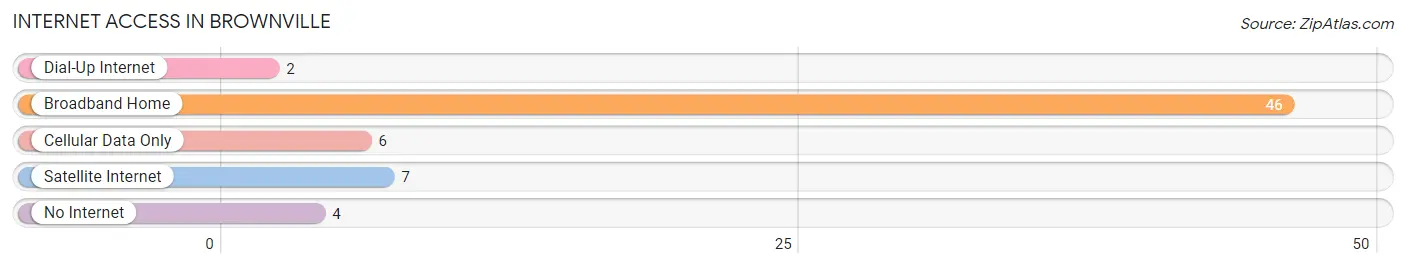
| Internet Type | # Households | % Households |
| Dial-Up Internet | 2 | 3.2% |
| Broadband Home | 46 | 74.2% |
| Cellular Data Only | 6 | 9.7% |
| Satellite Internet | 7 | 11.3% |
| No Internet | 4 | 6.5% |
| Total | 62 | 100.0% |
Brownville Summary
Brownville, Nebraska is a small village located in Nemaha County, Nebraska. It is situated on the banks of the Missouri River, and is the county seat of Nemaha County. The population of Brownville was 545 at the 2010 census.
History
Brownville was founded in 1854 by a group of settlers from Ohio. The town was named after its founder, William Brown, who was a prominent businessman in the area. The town was originally located on the east bank of the Missouri River, but was moved to its current location on the west bank in 1856.
In 1857, the first bridge across the Missouri River was built in Brownville, connecting the town to Nebraska City. This bridge was destroyed by a flood in 1881, but was replaced by a new bridge in 1883.
The town was incorporated in 1867, and the first post office was established in 1868. The town was a major trading center for the surrounding area, and was home to several businesses, including a hotel, a bank, a newspaper, and a sawmill.
In the late 19th century, Brownville was a popular tourist destination, and was home to several resorts. The town was also home to a number of churches, including the First Presbyterian Church, which was founded in 1867.
Geography
Brownville is located in southeastern Nebraska, on the west bank of the Missouri River. The town is situated at the intersection of U.S. Route 75 and Nebraska Highway 8. The town is approximately 25 miles south of Nebraska City, and 40 miles north of Lincoln.
The terrain around Brownville is mostly flat, with some rolling hills. The town is located in the Loess Hills region of Nebraska, and is surrounded by farmland.
Economy
The economy of Brownville is largely based on agriculture. The town is home to several farms, and the surrounding area is used for growing corn, soybeans, and other crops.
The town is also home to several businesses, including a grocery store, a hardware store, a bank, and a restaurant. The town is also home to a number of small manufacturing companies, including a furniture factory and a woodworking shop.
Demographics
As of the 2010 census, the population of Brownville was 545. The racial makeup of the town was 97.3% White, 0.2% African American, 0.2% Native American, 0.2% Asian, 0.4% from other races, and 1.7% from two or more races. Hispanic or Latino of any race were 1.3% of the population.
The median household income in Brownville was $41,250, and the median family income was $48,750. The per capita income for the town was $19,945. About 8.3% of families and 10.2% of the population were below the poverty line, including 14.3% of those under age 18 and 8.3% of those age 65 or over.
Common Questions
What is Per Capita Income in Brownville?
Per Capita income in Brownville is $48,828.
What is the Median Family Income in Brownville?
Median Family Income in Brownville is $111,250.
What is the Median Household income in Brownville?
Median Household Income in Brownville is $105,625.
What is Income or Wage Gap in Brownville?
Income or Wage Gap in Brownville is 66.8%.
Women in Brownville earn 33.2 cents for every dollar earned by a man.
What is Inequality or Gini Index in Brownville?
Inequality or Gini Index in Brownville is 0.42.
What is the Total Population of Brownville?
Total Population of Brownville is 138.
What is the Total Male Population of Brownville?
Total Male Population of Brownville is 69.
What is the Total Female Population of Brownville?
Total Female Population of Brownville is 69.
What is the Ratio of Males per 100 Females in Brownville?
There are 100.00 Males per 100 Females in Brownville.
What is the Ratio of Females per 100 Males in Brownville?
There are 100.00 Females per 100 Males in Brownville.
What is the Median Population Age in Brownville?
Median Population Age in Brownville is 52.3 Years.
What is the Average Family Size in Brownville
Average Family Size in Brownville is 2.9 People.
What is the Average Household Size in Brownville
Average Household Size in Brownville is 2.2 People.
How Large is the Labor Force in Brownville?
There are 64 People in the Labor Forcein in Brownville.
What is the Percentage of People in the Labor Force in Brownville?
57.1% of People are in the Labor Force in Brownville.
What is the Unemployment Rate in Brownville?
Unemployment Rate in Brownville is 9.4%.