Livonia, LA Map & Demographics
Livonia Map
Livonia Overview
$29,446
PER CAPITA INCOME
$85,994
AVG FAMILY INCOME
$48,523
AVG HOUSEHOLD INCOME
1.6%
WAGE / INCOME GAP [ % ]
98.4¢/ $1
WAGE / INCOME GAP [ $ ]
$9,844
FAMILY INCOME DEFICIT
0.50
INEQUALITY / GINI INDEX
1,290
TOTAL POPULATION
584
MALE POPULATION
706
FEMALE POPULATION
82.72
MALES / 100 FEMALES
120.89
FEMALES / 100 MALES
49.7
MEDIAN AGE
3.1
AVG FAMILY SIZE
2.5
AVG HOUSEHOLD SIZE
546
LABOR FORCE [ PEOPLE ]
49.3%
PERCENT IN LABOR FORCE
1.5%
UNEMPLOYMENT RATE
Livonia Zip Codes
Livonia Area Codes
Income in Livonia
Income Overview in Livonia
Per Capita Income in Livonia is $29,446, while median incomes of families and households are $85,994 and $48,523 respectively.
| Characteristic | Number | Measure |
| Per Capita Income | 1,290 | $29,446 |
| Median Family Income | 333 | $85,994 |
| Mean Family Income | 333 | $90,473 |
| Median Household Income | 518 | $48,523 |
| Mean Household Income | 518 | $70,441 |
| Income Deficit | 333 | $9,844 |
| Wage / Income Gap (%) | 1,290 | 1.62% |
| Wage / Income Gap ($) | 1,290 | 98.38¢ per $1 |
| Gini / Inequality Index | 1,290 | 0.50 |
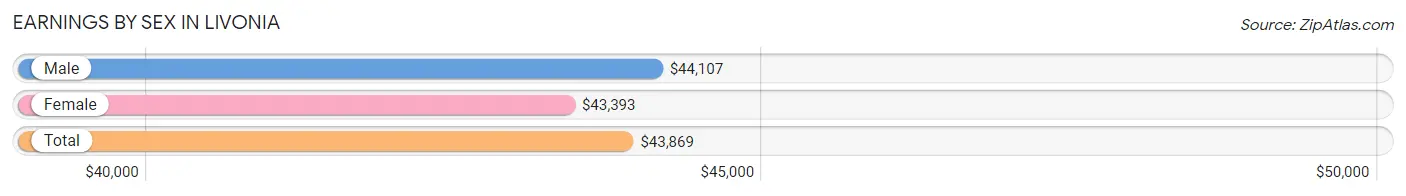
Earnings by Sex in Livonia
Average Earnings in Livonia are $43,869, $44,107 for men and $43,393 for women, a difference of 1.6%.
| Sex | Number | Average Earnings |
| Male | 320 (53.8%) | $44,107 |
| Female | 275 (46.2%) | $43,393 |
| Total | 595 (100.0%) | $43,869 |
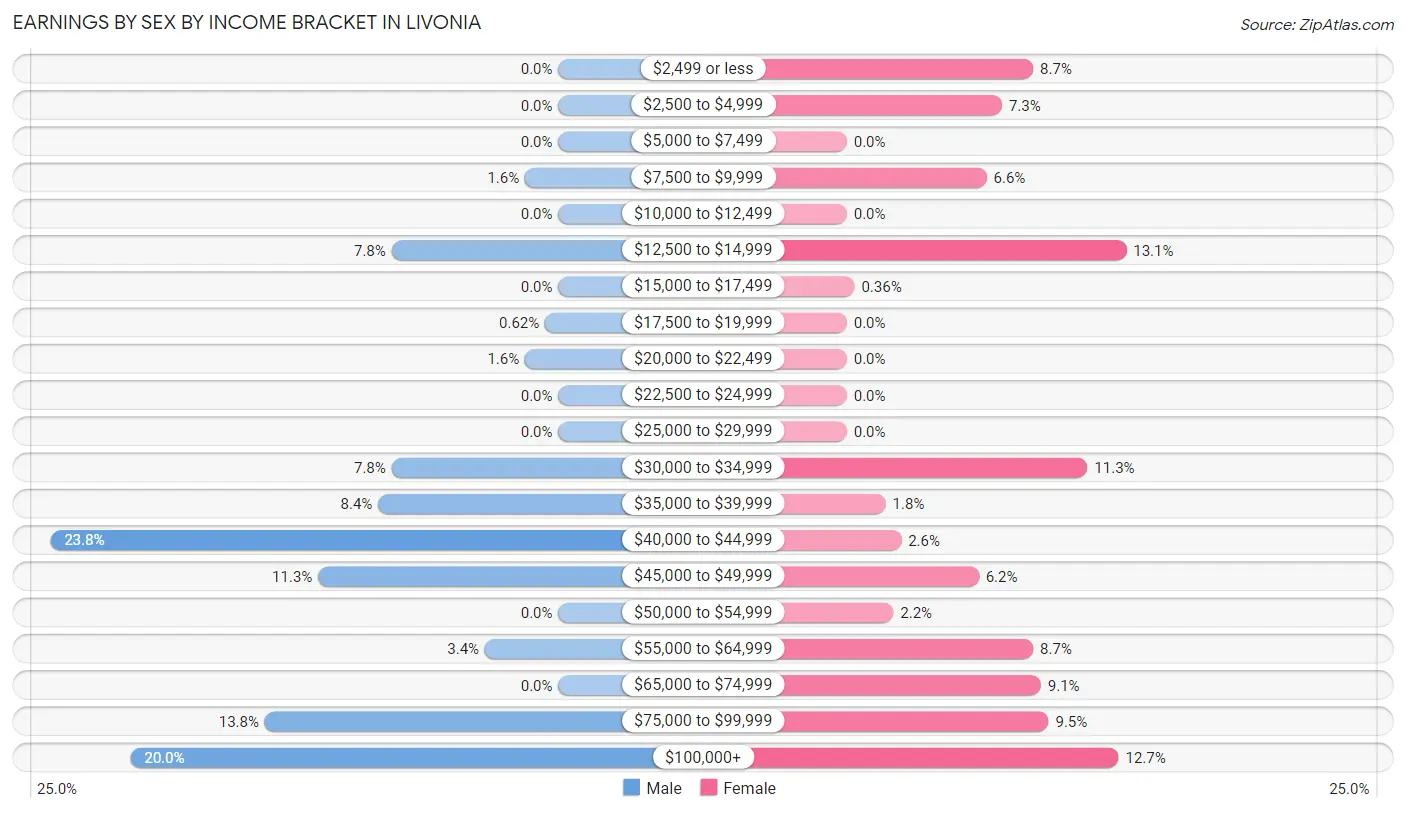
Earnings by Sex by Income Bracket in Livonia
The most common earnings brackets in Livonia are $40,000 to $44,999 for men (76 | 23.7%) and $12,500 to $14,999 for women (36 | 13.1%).
| Income | Male | Female |
| $2,499 or less | 0 (0.0%) | 24 (8.7%) |
| $2,500 to $4,999 | 0 (0.0%) | 20 (7.3%) |
| $5,000 to $7,499 | 0 (0.0%) | 0 (0.0%) |
| $7,500 to $9,999 | 5 (1.6%) | 18 (6.6%) |
| $10,000 to $12,499 | 0 (0.0%) | 0 (0.0%) |
| $12,500 to $14,999 | 25 (7.8%) | 36 (13.1%) |
| $15,000 to $17,499 | 0 (0.0%) | 1 (0.4%) |
| $17,500 to $19,999 | 2 (0.6%) | 0 (0.0%) |
| $20,000 to $22,499 | 5 (1.6%) | 0 (0.0%) |
| $22,500 to $24,999 | 0 (0.0%) | 0 (0.0%) |
| $25,000 to $29,999 | 0 (0.0%) | 0 (0.0%) |
| $30,000 to $34,999 | 25 (7.8%) | 31 (11.3%) |
| $35,000 to $39,999 | 27 (8.4%) | 5 (1.8%) |
| $40,000 to $44,999 | 76 (23.7%) | 7 (2.5%) |
| $45,000 to $49,999 | 36 (11.3%) | 17 (6.2%) |
| $50,000 to $54,999 | 0 (0.0%) | 6 (2.2%) |
| $55,000 to $64,999 | 11 (3.4%) | 24 (8.7%) |
| $65,000 to $74,999 | 0 (0.0%) | 25 (9.1%) |
| $75,000 to $99,999 | 44 (13.8%) | 26 (9.5%) |
| $100,000+ | 64 (20.0%) | 35 (12.7%) |
| Total | 320 (100.0%) | 275 (100.0%) |
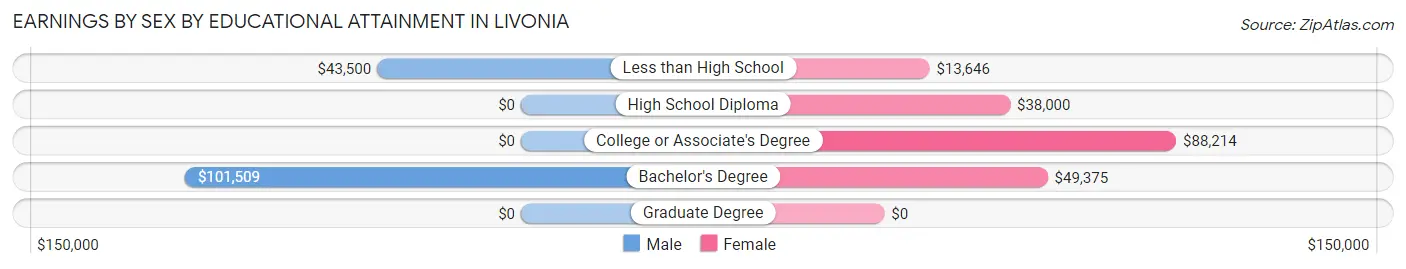
Earnings by Sex by Educational Attainment in Livonia
Average earnings in Livonia are $45,375 for men and $55,250 for women, a difference of 17.9%. Men with an educational attainment of bachelor's degree enjoy the highest average annual earnings of $101,509, while those with less than high school education earn the least with $43,500. Women with an educational attainment of college or associate's degree earn the most with the average annual earnings of $88,214, while those with less than high school education have the smallest earnings of $13,646.
| Educational Attainment | Male Income | Female Income |
| Less than High School | $43,500 | $13,646 |
| High School Diploma | - | - |
| College or Associate's Degree | - | - |
| Bachelor's Degree | $101,509 | $49,375 |
| Graduate Degree | - | - |
| Total | $45,375 | $55,250 |
Family Income in Livonia
Family Income Brackets in Livonia
According to the Livonia family income data, there are 69 families falling into the $150,000 to $199,999 income range, which is the most common income bracket and makes up 20.7% of all families.
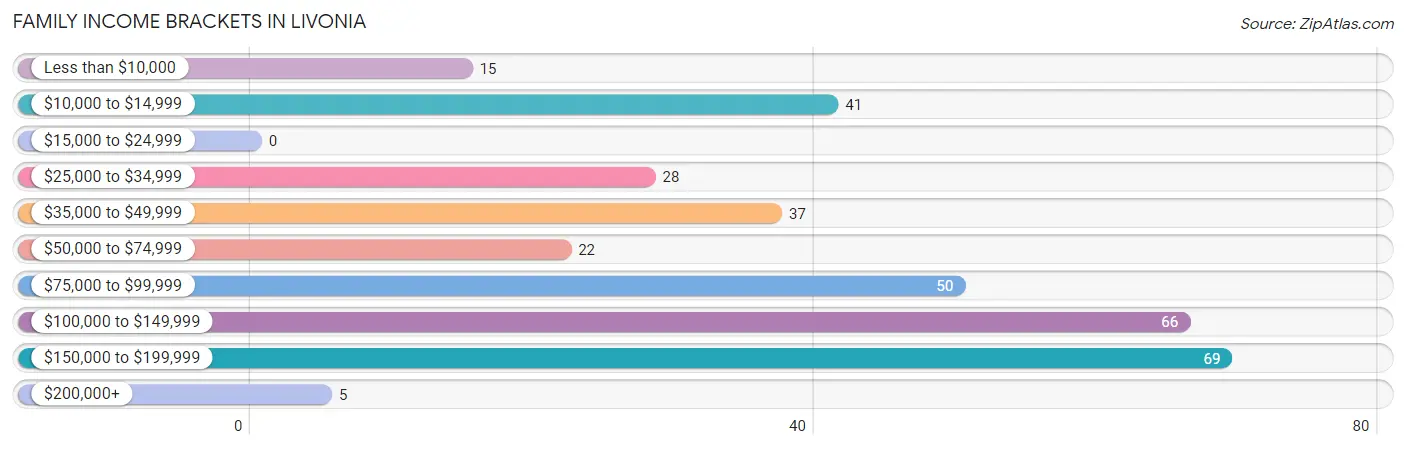
| Income Bracket | # Families | % Families |
| Less than $10,000 | 15 | 4.5% |
| $10,000 to $14,999 | 41 | 12.3% |
| $15,000 to $24,999 | 0 | 0.0% |
| $25,000 to $34,999 | 28 | 8.4% |
| $35,000 to $49,999 | 37 | 11.1% |
| $50,000 to $74,999 | 22 | 6.6% |
| $75,000 to $99,999 | 50 | 15.0% |
| $100,000 to $149,999 | 66 | 19.8% |
| $150,000 to $199,999 | 69 | 20.7% |
| $200,000+ | 5 | 1.5% |
Family Income by Famaliy Size in Livonia
4-person families (20 | 6.0%) account for the highest median family income in Livonia with $188,250 per family, while 4-person families (20 | 6.0%) have the highest median income of $47,062 per family member.
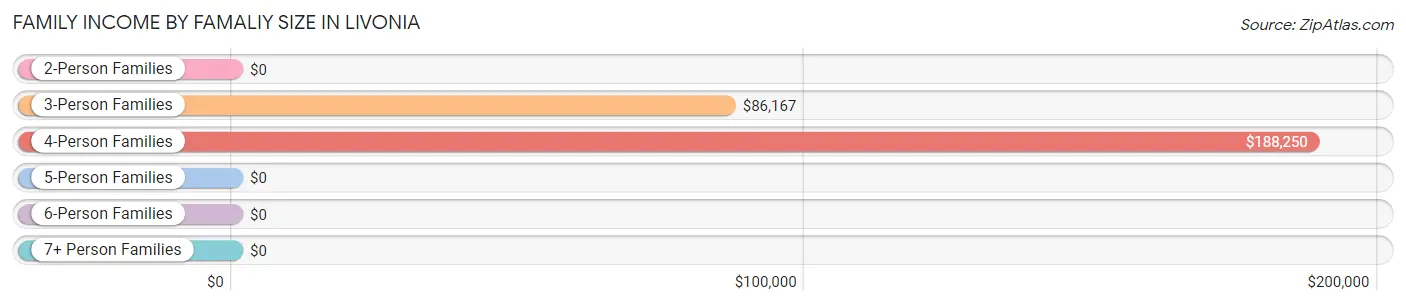
| Income Bracket | # Families | Median Income |
| 2-Person Families | 211 (63.4%) | $0 |
| 3-Person Families | 40 (12.0%) | $86,167 |
| 4-Person Families | 20 (6.0%) | $188,250 |
| 5-Person Families | 38 (11.4%) | $0 |
| 6-Person Families | 9 (2.7%) | $0 |
| 7+ Person Families | 15 (4.5%) | $0 |
| Total | 333 (100.0%) | $85,994 |
Family Income by Number of Earners in Livonia
The median family income in Livonia is $85,994, with families comprising 3+ earners (11) having the highest median family income of $161,607, while families with no earners (51) have the lowest median family income of $30,521, accounting for 3.3% and 15.3% of families, respectively.
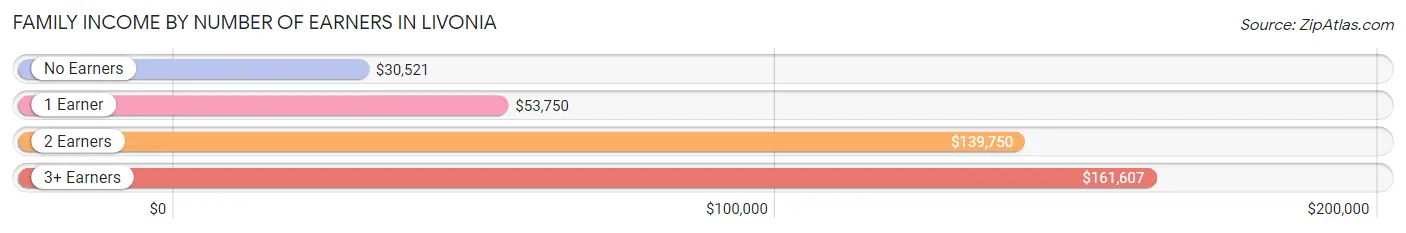
| Number of Earners | # Families | Median Income |
| No Earners | 51 (15.3%) | $30,521 |
| 1 Earner | 144 (43.2%) | $53,750 |
| 2 Earners | 127 (38.1%) | $139,750 |
| 3+ Earners | 11 (3.3%) | $161,607 |
| Total | 333 (100.0%) | $85,994 |
Household Income in Livonia
Household Income Brackets in Livonia
With 84 households falling in the category, the $100,000 to $149,999 income range is the most frequent in Livonia, accounting for 16.2% of all households. In contrast, only 4 households (0.8%) fall into the $15,000 to $24,999 income bracket, making it the least populous group.
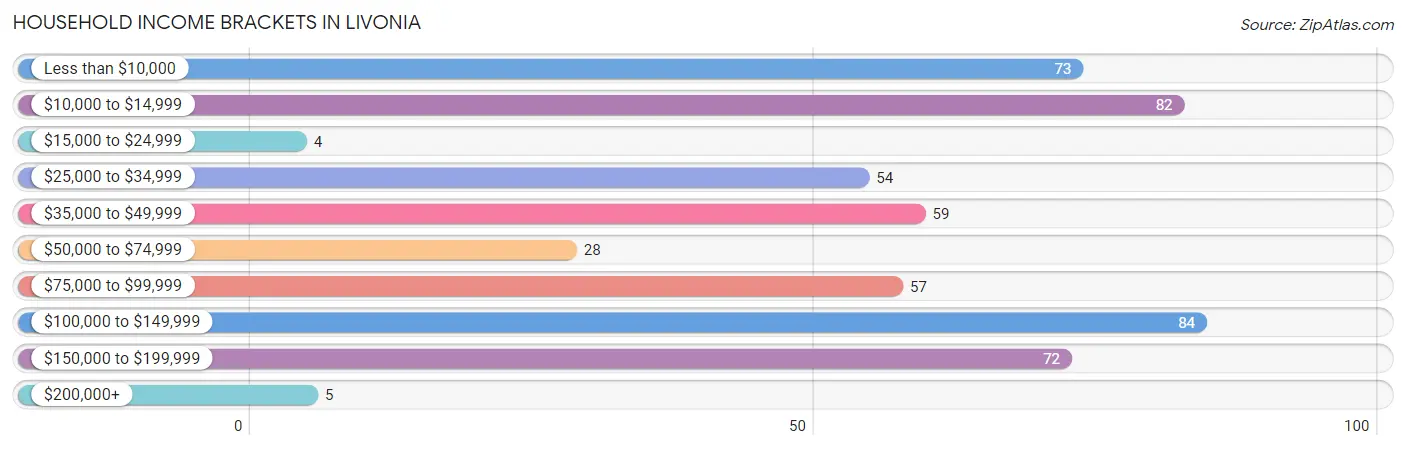
| Income Bracket | # Households | % Households |
| Less than $10,000 | 73 | 14.1% |
| $10,000 to $14,999 | 82 | 15.8% |
| $15,000 to $24,999 | 4 | 0.8% |
| $25,000 to $34,999 | 54 | 10.4% |
| $35,000 to $49,999 | 59 | 11.4% |
| $50,000 to $74,999 | 28 | 5.4% |
| $75,000 to $99,999 | 57 | 11.0% |
| $100,000 to $149,999 | 84 | 16.2% |
| $150,000 to $199,999 | 72 | 13.9% |
| $200,000+ | 5 | 1.0% |
Household Income by Householder Age in Livonia
The median household income in Livonia is $48,523, with the highest median household income of $87,017 found in the 45 to 64 years age bracket for the primary householder. A total of 281 households (54.2%) fall into this category. Meanwhile, the 15 to 24 years age bracket for the primary householder has the lowest median household income of $0, with 5 households (1.0%) in this group.
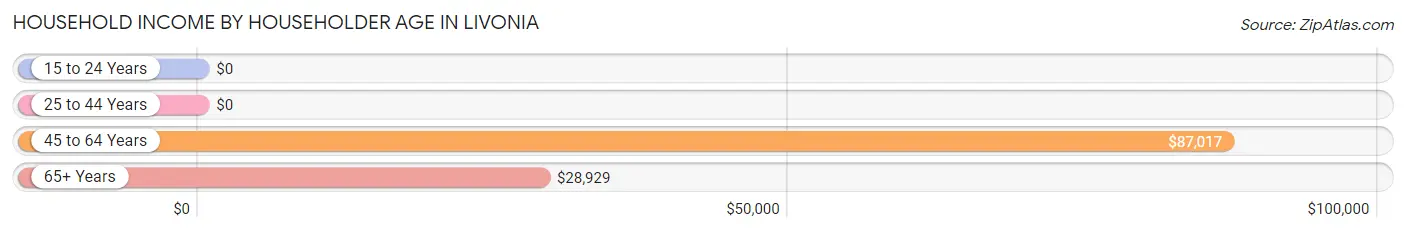
| Income Bracket | # Households | Median Income |
| 15 to 24 Years | 5 (1.0%) | $0 |
| 25 to 44 Years | 68 (13.1%) | $0 |
| 45 to 64 Years | 281 (54.2%) | $87,017 |
| 65+ Years | 164 (31.7%) | $28,929 |
| Total | 518 (100.0%) | $48,523 |
Poverty in Livonia
Income Below Poverty by Sex and Age in Livonia
With 17.2% poverty level for males and 37.0% for females among the residents of Livonia, 35 to 44 year old males and 12 to 14 year old females are the most vulnerable to poverty, with 9 males (100.0%) and 30 females (100.0%) in their respective age groups living below the poverty level.
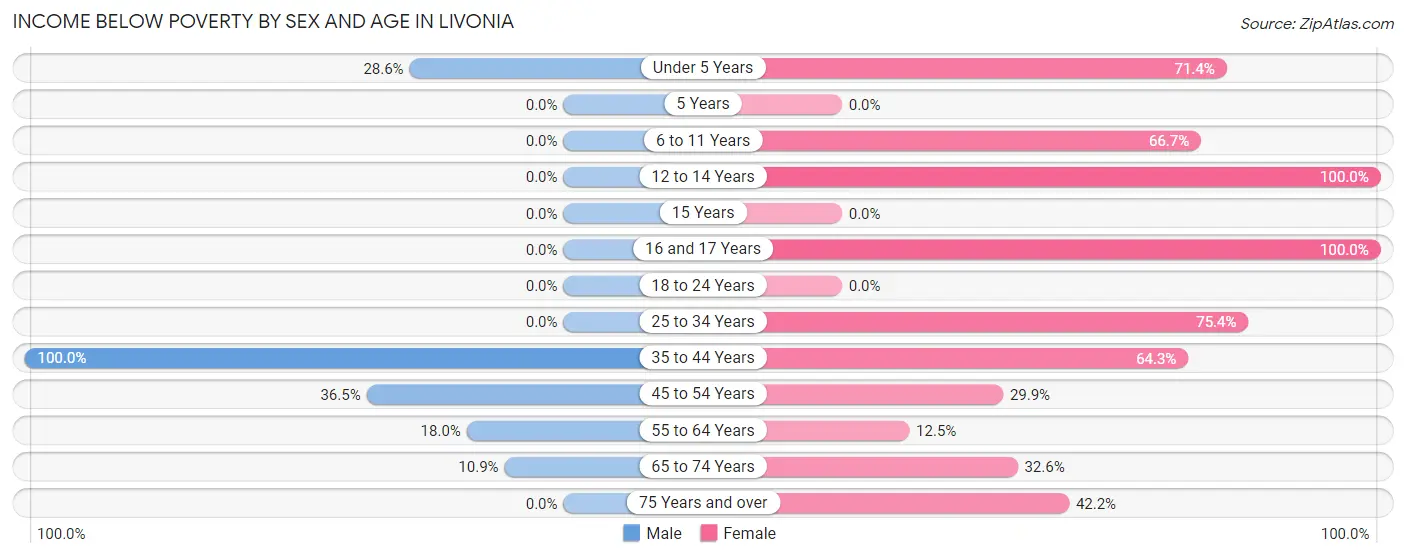
| Age Bracket | Male | Female |
| Under 5 Years | 14 (28.6%) | 20 (71.4%) |
| 5 Years | 0 (0.0%) | 0 (0.0%) |
| 6 to 11 Years | 0 (0.0%) | 10 (66.7%) |
| 12 to 14 Years | 0 (0.0%) | 30 (100.0%) |
| 15 Years | 0 (0.0%) | 0 (0.0%) |
| 16 and 17 Years | 0 (0.0%) | 14 (100.0%) |
| 18 to 24 Years | 0 (0.0%) | 0 (0.0%) |
| 25 to 34 Years | 0 (0.0%) | 43 (75.4%) |
| 35 to 44 Years | 9 (100.0%) | 36 (64.3%) |
| 45 to 54 Years | 38 (36.5%) | 35 (29.9%) |
| 55 to 64 Years | 28 (17.9%) | 15 (12.5%) |
| 65 to 74 Years | 7 (10.9%) | 15 (32.6%) |
| 75 Years and over | 0 (0.0%) | 43 (42.2%) |
| Total | 96 (17.2%) | 261 (37.0%) |
Income Above Poverty by Sex and Age in Livonia
According to the poverty statistics in Livonia, males aged 5 years and females aged 18 to 24 years are the age groups that are most secure financially, with 100.0% of males and 100.0% of females in these age groups living above the poverty line.
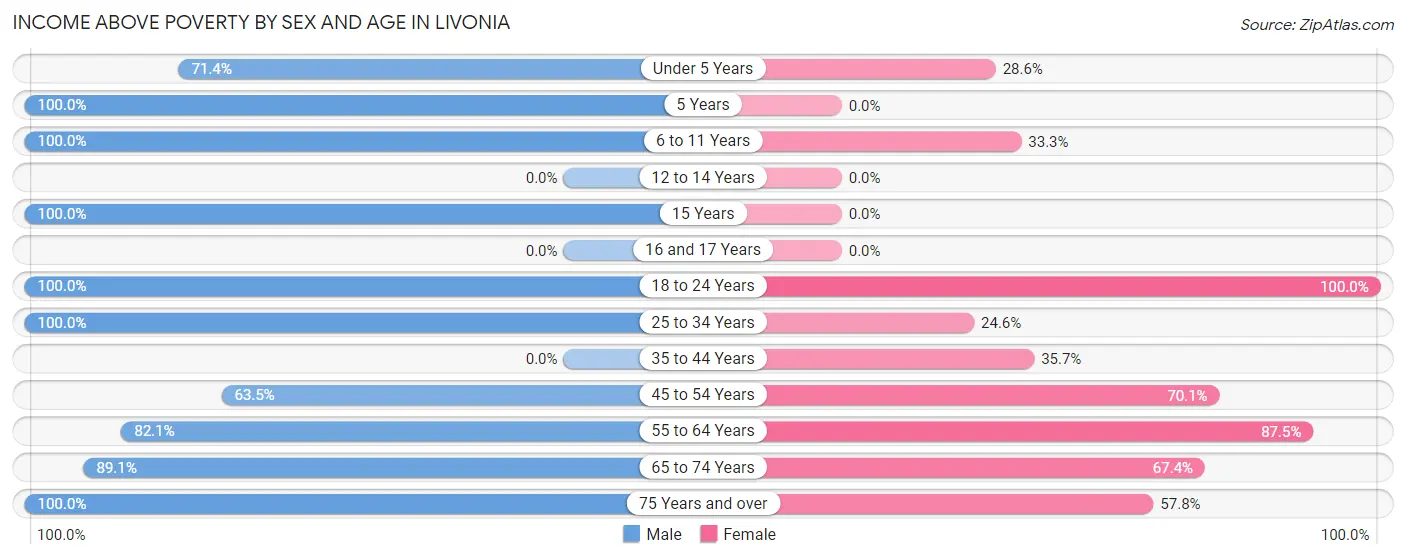
| Age Bracket | Male | Female |
| Under 5 Years | 35 (71.4%) | 8 (28.6%) |
| 5 Years | 6 (100.0%) | 0 (0.0%) |
| 6 to 11 Years | 12 (100.0%) | 5 (33.3%) |
| 12 to 14 Years | 0 (0.0%) | 0 (0.0%) |
| 15 Years | 18 (100.0%) | 0 (0.0%) |
| 16 and 17 Years | 0 (0.0%) | 0 (0.0%) |
| 18 to 24 Years | 19 (100.0%) | 121 (100.0%) |
| 25 to 34 Years | 103 (100.0%) | 14 (24.6%) |
| 35 to 44 Years | 0 (0.0%) | 20 (35.7%) |
| 45 to 54 Years | 66 (63.5%) | 82 (70.1%) |
| 55 to 64 Years | 128 (82.1%) | 105 (87.5%) |
| 65 to 74 Years | 57 (89.1%) | 31 (67.4%) |
| 75 Years and over | 19 (100.0%) | 59 (57.8%) |
| Total | 463 (82.8%) | 445 (63.0%) |
Income Below Poverty Among Married-Couple Families in Livonia
The poverty statistics for married-couple families in Livonia show that 21.8% or 71 of the total 325 families live below the poverty line. Families with 3 or 4 children have the highest poverty rate of 72.7%, comprising of 24 families. On the other hand, families with 1 or 2 children have the lowest poverty rate of 0.0%, which includes 0 families.
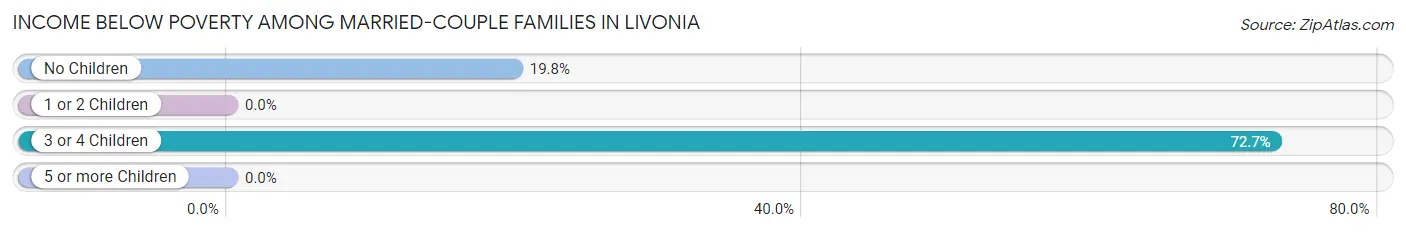
| Children | Above Poverty | Below Poverty |
| No Children | 190 (80.2%) | 47 (19.8%) |
| 1 or 2 Children | 55 (100.0%) | 0 (0.0%) |
| 3 or 4 Children | 9 (27.3%) | 24 (72.7%) |
| 5 or more Children | 0 (0.0%) | 0 (0.0%) |
| Total | 254 (78.1%) | 71 (21.8%) |
Income Below Poverty Among Single-Parent Households in Livonia
| Children | Single Father | Single Mother |
| No Children | 0 (0.0%) | 0 (0.0%) |
| 1 or 2 Children | 0 (0.0%) | 0 (0.0%) |
| 3 or 4 Children | 0 (0.0%) | 0 (0.0%) |
| 5 or more Children | 0 (0.0%) | 0 (0.0%) |
| Total | 0 (0.0%) | 0 (0.0%) |
Income Below Poverty Among Married-Couple vs Single-Parent Households in Livonia
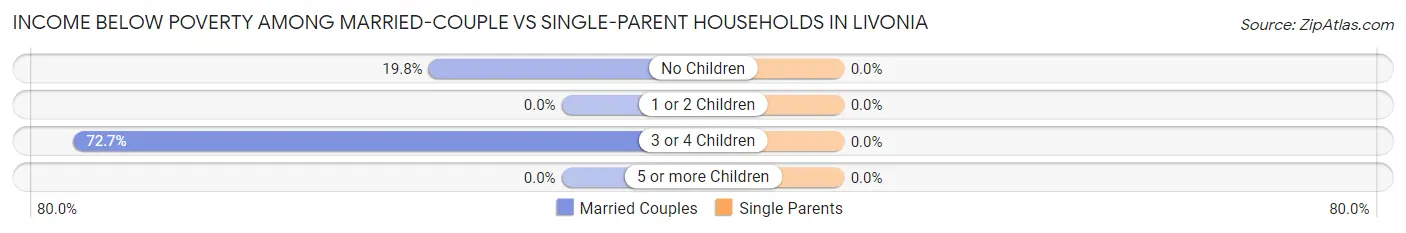
| Children | Married-Couple Families | Single-Parent Households |
| No Children | 47 (19.8%) | 0 (0.0%) |
| 1 or 2 Children | 0 (0.0%) | 0 (0.0%) |
| 3 or 4 Children | 24 (72.7%) | 0 (0.0%) |
| 5 or more Children | 0 (0.0%) | 0 (0.0%) |
| Total | 71 (21.8%) | 0 (0.0%) |
Race in Livonia
The most populous races in Livonia are White / Caucasian (1,219 | 94.5%), Black / African American (50 | 3.9%), and Two or more Races (11 | 0.9%).
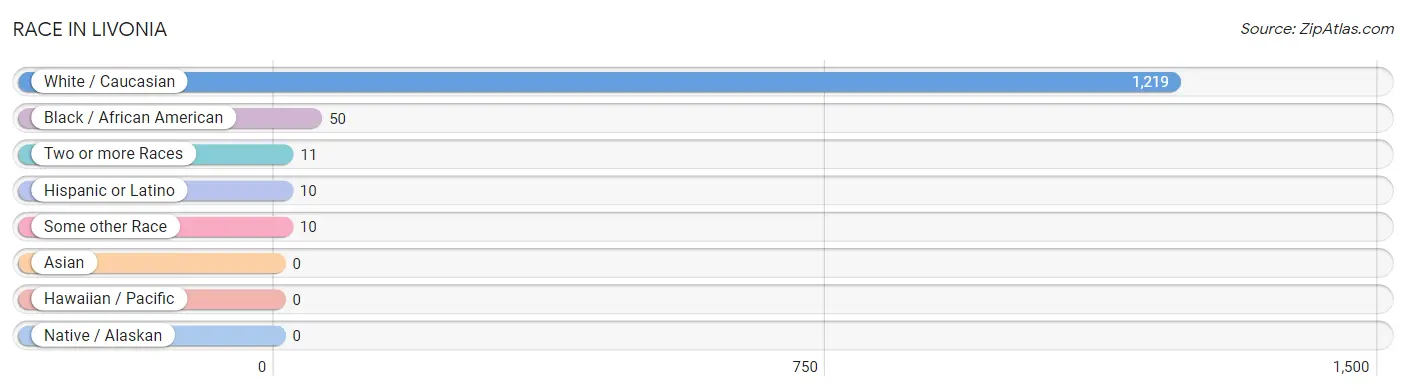
| Race | # Population | % Population |
| Asian | 0 | 0.0% |
| Black / African American | 50 | 3.9% |
| Hawaiian / Pacific | 0 | 0.0% |
| Hispanic or Latino | 10 | 0.8% |
| Native / Alaskan | 0 | 0.0% |
| White / Caucasian | 1,219 | 94.5% |
| Two or more Races | 11 | 0.9% |
| Some other Race | 10 | 0.8% |
| Total | 1,290 | 100.0% |
Ancestry in Livonia
The most populous ancestries reported in Livonia are American (656 | 50.8%), French (314 | 24.3%), German (80 | 6.2%), Italian (54 | 4.2%), and English (52 | 4.0%), together accounting for 89.6% of all Livonia residents.
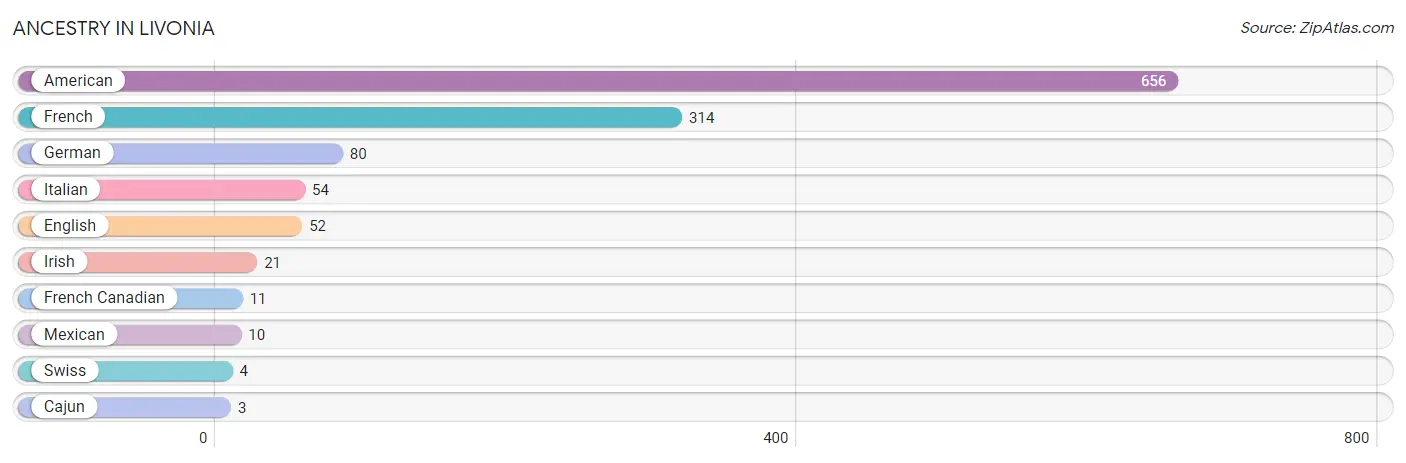
| Ancestry | # Population | % Population |
| American | 656 | 50.8% |
| Cajun | 3 | 0.2% |
| English | 52 | 4.0% |
| French | 314 | 24.3% |
| French Canadian | 11 | 0.9% |
| German | 80 | 6.2% |
| Irish | 21 | 1.6% |
| Italian | 54 | 4.2% |
| Mexican | 10 | 0.8% |
| Swiss | 4 | 0.3% | View All 10 Rows |
Immigrants in Livonia

| Immigration Origin | # Population | % Population | View All 0 Rows |
Sex and Age in Livonia
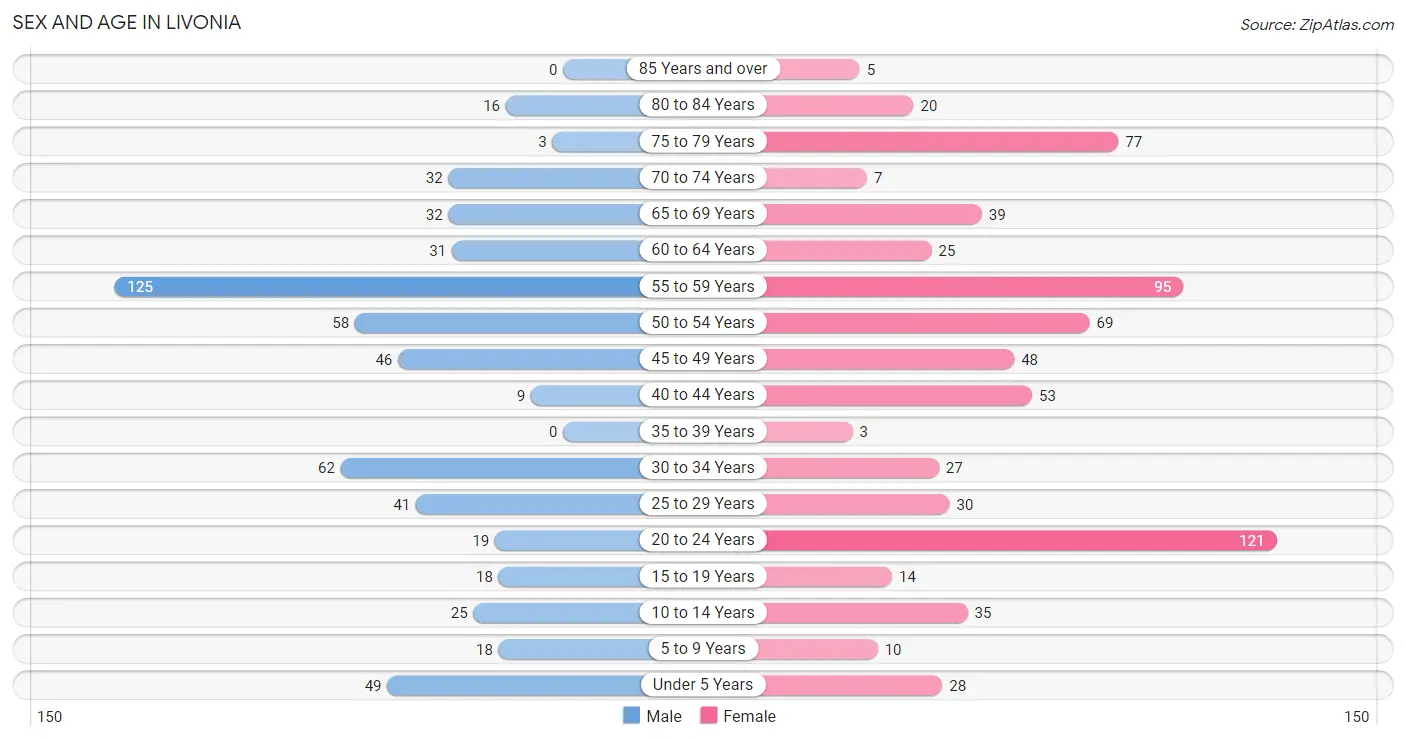
Sex and Age in Livonia
The most populous age groups in Livonia are 55 to 59 Years (125 | 21.4%) for men and 20 to 24 Years (121 | 17.1%) for women.
| Age Bracket | Male | Female |
| Under 5 Years | 49 (8.4%) | 28 (4.0%) |
| 5 to 9 Years | 18 (3.1%) | 10 (1.4%) |
| 10 to 14 Years | 25 (4.3%) | 35 (5.0%) |
| 15 to 19 Years | 18 (3.1%) | 14 (2.0%) |
| 20 to 24 Years | 19 (3.3%) | 121 (17.1%) |
| 25 to 29 Years | 41 (7.0%) | 30 (4.3%) |
| 30 to 34 Years | 62 (10.6%) | 27 (3.8%) |
| 35 to 39 Years | 0 (0.0%) | 3 (0.4%) |
| 40 to 44 Years | 9 (1.5%) | 53 (7.5%) |
| 45 to 49 Years | 46 (7.9%) | 48 (6.8%) |
| 50 to 54 Years | 58 (9.9%) | 69 (9.8%) |
| 55 to 59 Years | 125 (21.4%) | 95 (13.5%) |
| 60 to 64 Years | 31 (5.3%) | 25 (3.5%) |
| 65 to 69 Years | 32 (5.5%) | 39 (5.5%) |
| 70 to 74 Years | 32 (5.5%) | 7 (1.0%) |
| 75 to 79 Years | 3 (0.5%) | 77 (10.9%) |
| 80 to 84 Years | 16 (2.7%) | 20 (2.8%) |
| 85 Years and over | 0 (0.0%) | 5 (0.7%) |
| Total | 584 (100.0%) | 706 (100.0%) |
Families and Households in Livonia
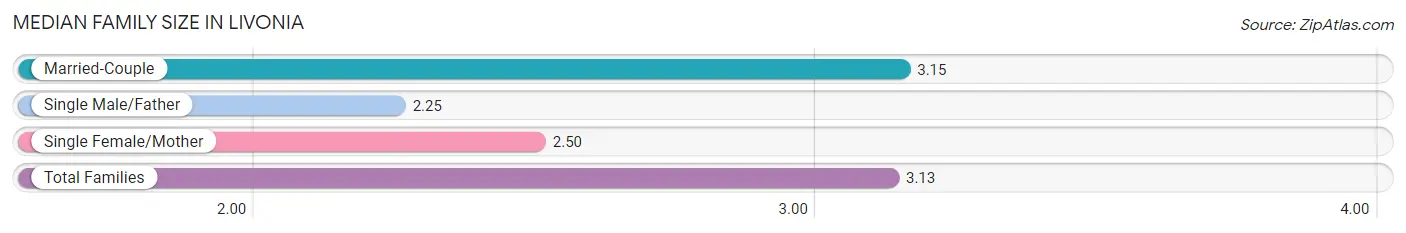
Median Family Size in Livonia
The median family size in Livonia is 3.13 persons per family, with married-couple families (325 | 97.6%) accounting for the largest median family size of 3.15 persons per family. On the other hand, single male/father families (4 | 1.2%) represent the smallest median family size with 2.25 persons per family.
| Family Type | # Families | Family Size |
| Married-Couple | 325 (97.6%) | 3.15 |
| Single Male/Father | 4 (1.2%) | 2.25 |
| Single Female/Mother | 4 (1.2%) | 2.50 |
| Total Families | 333 (100.0%) | 3.13 |
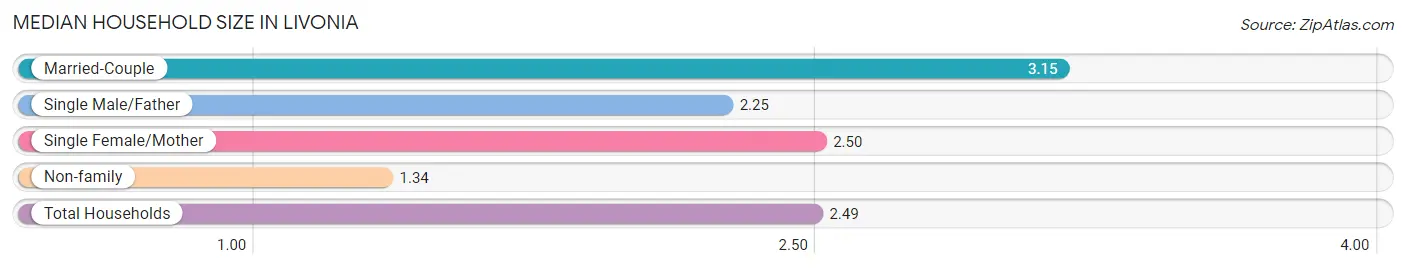
Median Household Size in Livonia
The median household size in Livonia is 2.49 persons per household, with married-couple households (325 | 62.7%) accounting for the largest median household size of 3.15 persons per household. non-family households (185 | 35.7%) represent the smallest median household size with 1.34 persons per household.
| Household Type | # Households | Household Size |
| Married-Couple | 325 (62.7%) | 3.15 |
| Single Male/Father | 4 (0.8%) | 2.25 |
| Single Female/Mother | 4 (0.8%) | 2.50 |
| Non-family | 185 (35.7%) | 1.34 |
| Total Households | 518 (100.0%) | 2.49 |
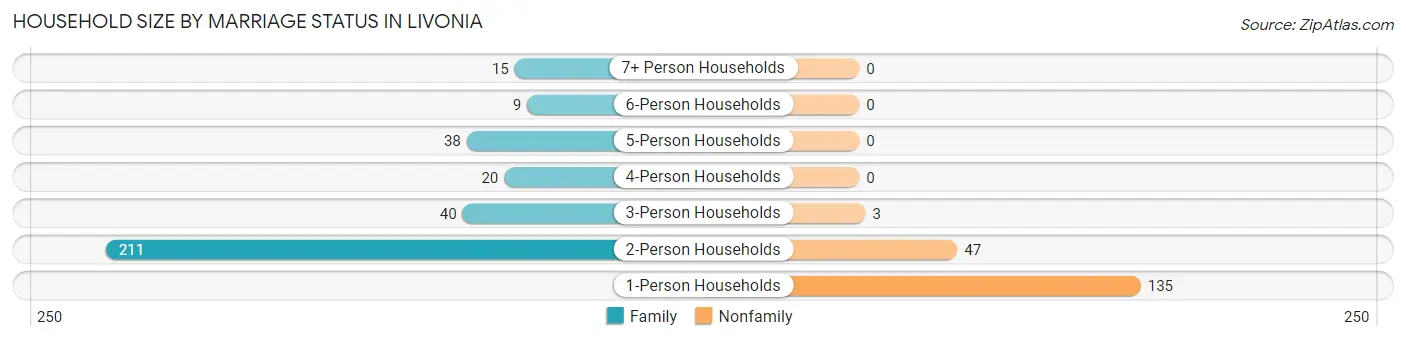
Household Size by Marriage Status in Livonia
Out of a total of 518 households in Livonia, 333 (64.3%) are family households, while 185 (35.7%) are nonfamily households. The most numerous type of family households are 2-person households, comprising 211, and the most common type of nonfamily households are 1-person households, comprising 135.
| Household Size | Family Households | Nonfamily Households |
| 1-Person Households | - | 135 (26.1%) |
| 2-Person Households | 211 (40.7%) | 47 (9.1%) |
| 3-Person Households | 40 (7.7%) | 3 (0.6%) |
| 4-Person Households | 20 (3.9%) | 0 (0.0%) |
| 5-Person Households | 38 (7.3%) | 0 (0.0%) |
| 6-Person Households | 9 (1.7%) | 0 (0.0%) |
| 7+ Person Households | 15 (2.9%) | 0 (0.0%) |
| Total | 333 (64.3%) | 185 (35.7%) |
Female Fertility in Livonia
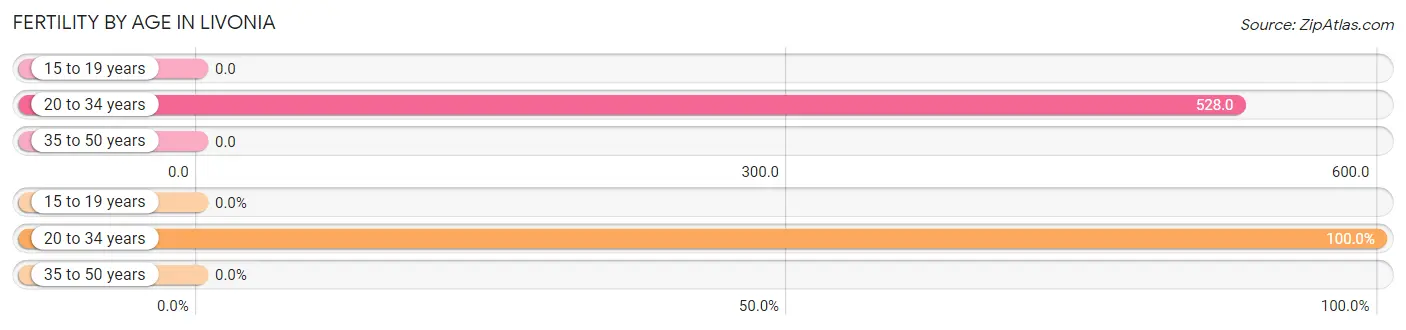
Fertility by Age in Livonia
Average fertility rate in Livonia is 283.0 births per 1,000 women. Women in the age bracket of 20 to 34 years have the highest fertility rate with 528.0 births per 1,000 women. Women in the age bracket of 20 to 34 years acount for 100.0% of all women with births.
| Age Bracket | Women with Births | Births / 1,000 Women |
| 15 to 19 years | 0 (0.0%) | 0.0 |
| 20 to 34 years | 94 (100.0%) | 528.0 |
| 35 to 50 years | 0 (0.0%) | 0.0 |
| Total | 94 (100.0%) | 283.0 |
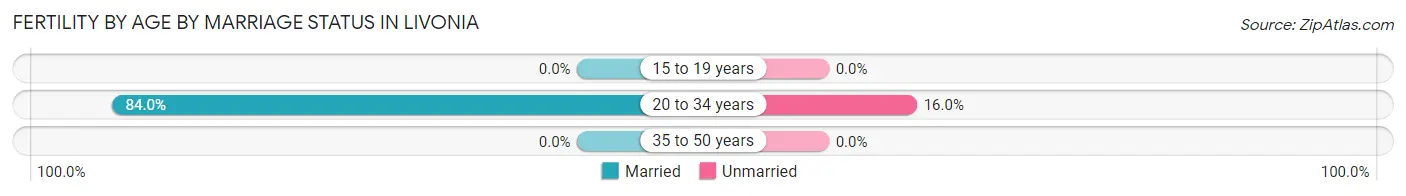
Fertility by Age by Marriage Status in Livonia
84.0% of women with births (94) in Livonia are married. The highest percentage of unmarried women with births falls into 20 to 34 years age bracket with 16.0% of them unmarried at the time of birth, while the lowest percentage of unmarried women with births belong to 20 to 34 years age bracket with 16.0% of them unmarried.
| Age Bracket | Married | Unmarried |
| 15 to 19 years | 0 (0.0%) | 0 (0.0%) |
| 20 to 34 years | 79 (84.0%) | 15 (16.0%) |
| 35 to 50 years | 0 (0.0%) | 0 (0.0%) |
| Total | 79 (84.0%) | 15 (16.0%) |
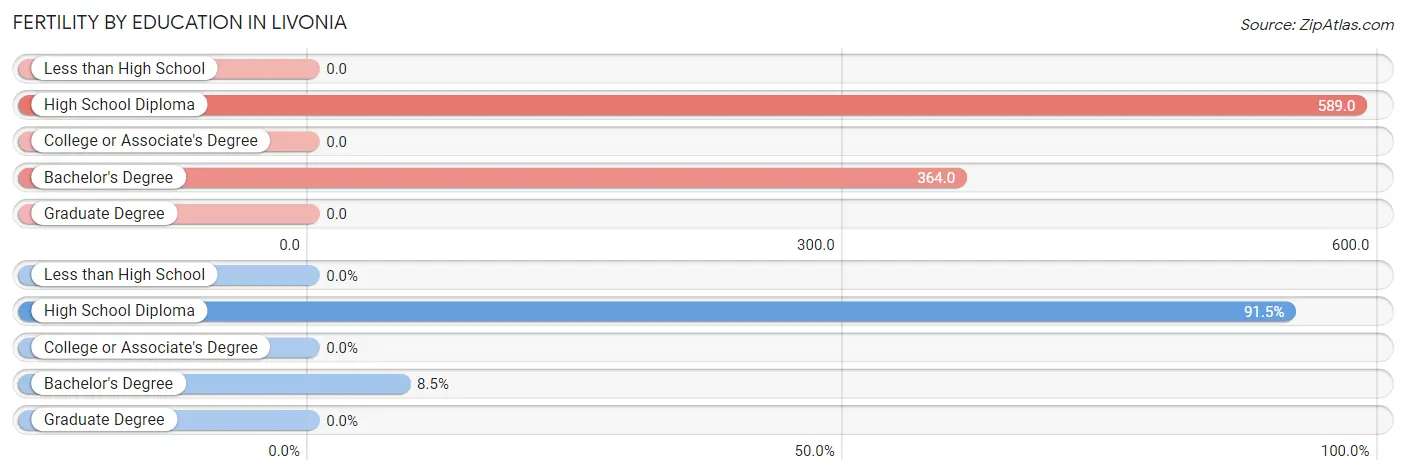
Fertility by Education in Livonia
| Educational Attainment | Women with Births | Births / 1,000 Women |
| Less than High School | 0 (0.0%) | 0.0 |
| High School Diploma | 86 (91.5%) | 589.0 |
| College or Associate's Degree | 0 (0.0%) | 0.0 |
| Bachelor's Degree | 8 (8.5%) | 364.0 |
| Graduate Degree | 0 (0.0%) | 0.0 |
| Total | 94 (100.0%) | 283.0 |
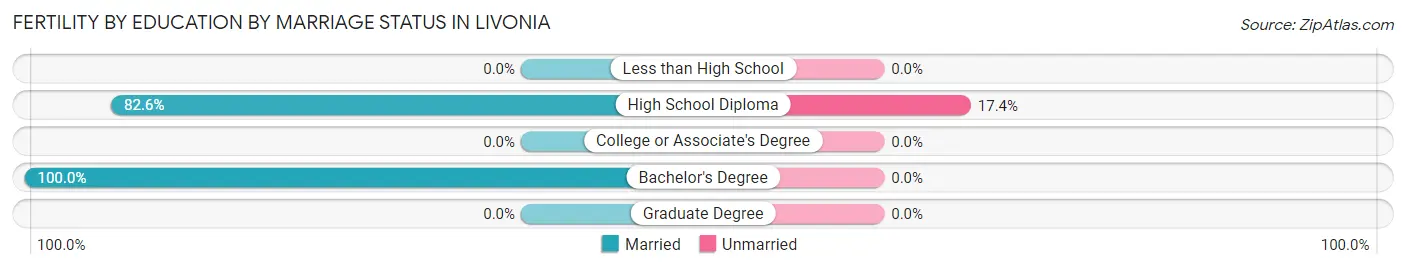
Fertility by Education by Marriage Status in Livonia
16.0% of women with births in Livonia are unmarried. Women with the educational attainment of bachelor's degree are most likely to be married with 100.0% of them married at childbirth, while women with the educational attainment of high school diploma are least likely to be married with 17.4% of them unmarried at childbirth.
| Educational Attainment | Married | Unmarried |
| Less than High School | 0 (0.0%) | 0 (0.0%) |
| High School Diploma | 71 (82.6%) | 15 (17.4%) |
| College or Associate's Degree | 0 (0.0%) | 0 (0.0%) |
| Bachelor's Degree | 8 (100.0%) | 0 (0.0%) |
| Graduate Degree | 0 (0.0%) | 0 (0.0%) |
| Total | 79 (84.0%) | 15 (16.0%) |
Employment Characteristics in Livonia
Employment by Class of Employer in Livonia
Among the 538 employed individuals in Livonia, private company employees (382 | 71.0%), state government employees (59 | 11.0%), and self-employed (not incorporated) (35 | 6.5%) make up the most common classes of employment.
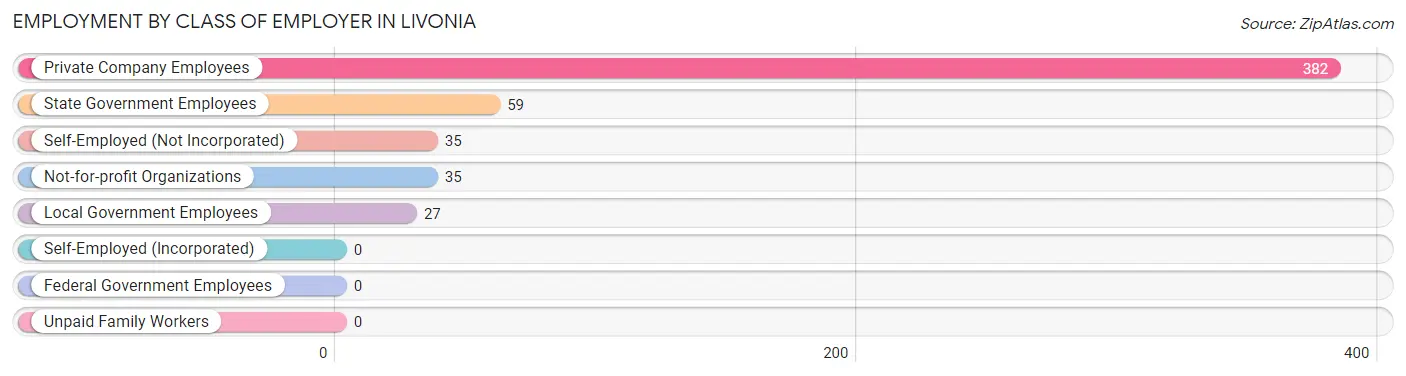
| Employer Class | # Employees | % Employees |
| Private Company Employees | 382 | 71.0% |
| Self-Employed (Incorporated) | 0 | 0.0% |
| Self-Employed (Not Incorporated) | 35 | 6.5% |
| Not-for-profit Organizations | 35 | 6.5% |
| Local Government Employees | 27 | 5.0% |
| State Government Employees | 59 | 11.0% |
| Federal Government Employees | 0 | 0.0% |
| Unpaid Family Workers | 0 | 0.0% |
| Total | 538 | 100.0% |
Employment Status by Age in Livonia
According to the labor force statistics for Livonia, out of the total population over 16 years of age (1,107), 49.3% or 546 individuals are in the labor force, with 1.5% or 8 of them unemployed. The age group with the highest labor force participation rate is 30 to 34 years, with 85.4% or 76 individuals in the labor force. Within the labor force, the 65 to 74 years age range has the highest percentage of unemployed individuals, with 6.5% or 2 of them being unemployed.
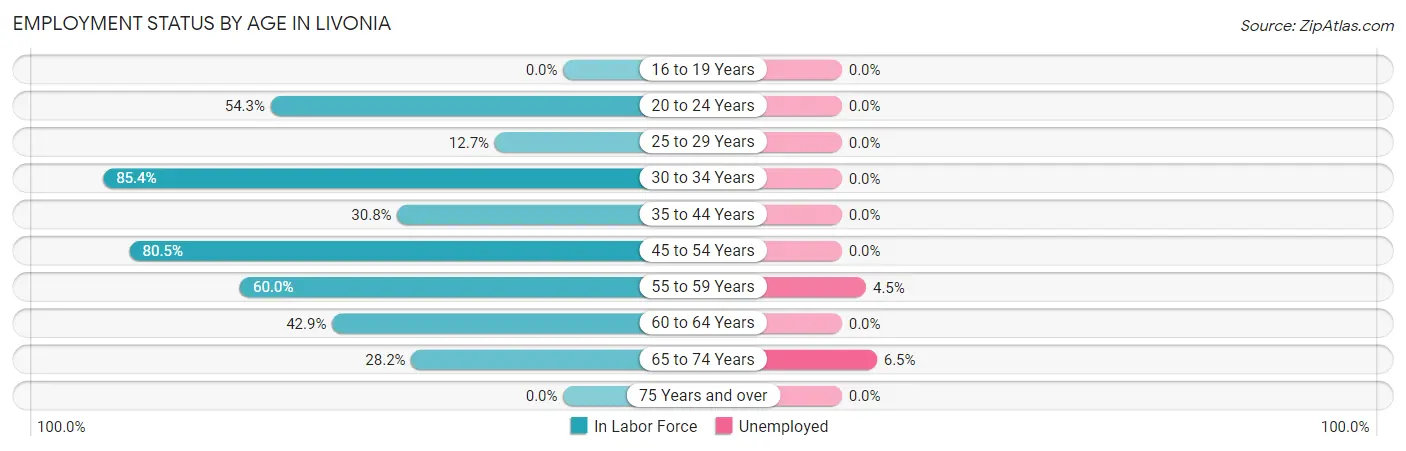
| Age Bracket | In Labor Force | Unemployed |
| 16 to 19 Years | 0 (0.0%) | 0 (0.0%) |
| 20 to 24 Years | 76 (54.3%) | 0 (0.0%) |
| 25 to 29 Years | 9 (12.7%) | 0 (0.0%) |
| 30 to 34 Years | 76 (85.4%) | 0 (0.0%) |
| 35 to 44 Years | 20 (30.8%) | 0 (0.0%) |
| 45 to 54 Years | 178 (80.5%) | 0 (0.0%) |
| 55 to 59 Years | 132 (60.0%) | 6 (4.5%) |
| 60 to 64 Years | 24 (42.9%) | 0 (0.0%) |
| 65 to 74 Years | 31 (28.2%) | 2 (6.5%) |
| 75 Years and over | 0 (0.0%) | 0 (0.0%) |
| Total | 546 (49.3%) | 8 (1.5%) |
Employment Status by Educational Attainment in Livonia
According to labor force statistics for Livonia, 60.8% of individuals (439) out of the total population between 25 and 64 years of age (722) are in the labor force, with 1.4% or 6 of them being unemployed. The group with the highest labor force participation rate are those with the educational attainment of bachelor's degree or higher, with 100.0% or 112 individuals in the labor force. Within the labor force, individuals with less than high school education have the highest percentage of unemployment, with 7.1% or 6 of them being unemployed.
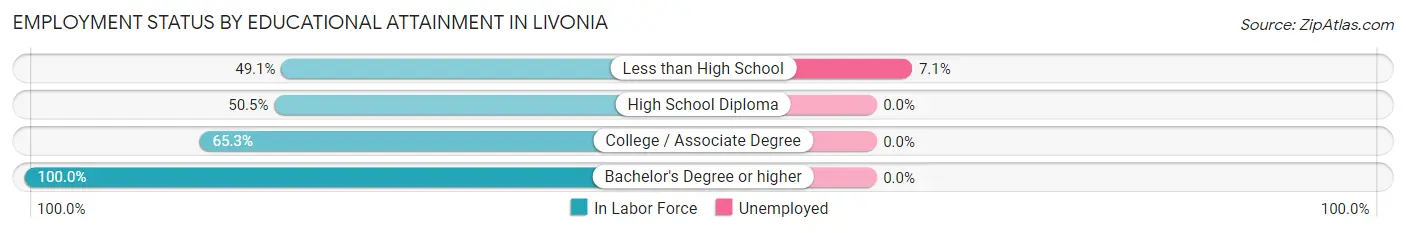
| Educational Attainment | In Labor Force | Unemployed |
| Less than High School | 84 (49.1%) | 12 (7.1%) |
| High School Diploma | 149 (50.5%) | 0 (0.0%) |
| College / Associate Degree | 94 (65.3%) | 0 (0.0%) |
| Bachelor's Degree or higher | 112 (100.0%) | 0 (0.0%) |
| Total | 439 (60.8%) | 10 (1.4%) |
Employment Occupations by Sex in Livonia
Management, Business, Science and Arts Occupations
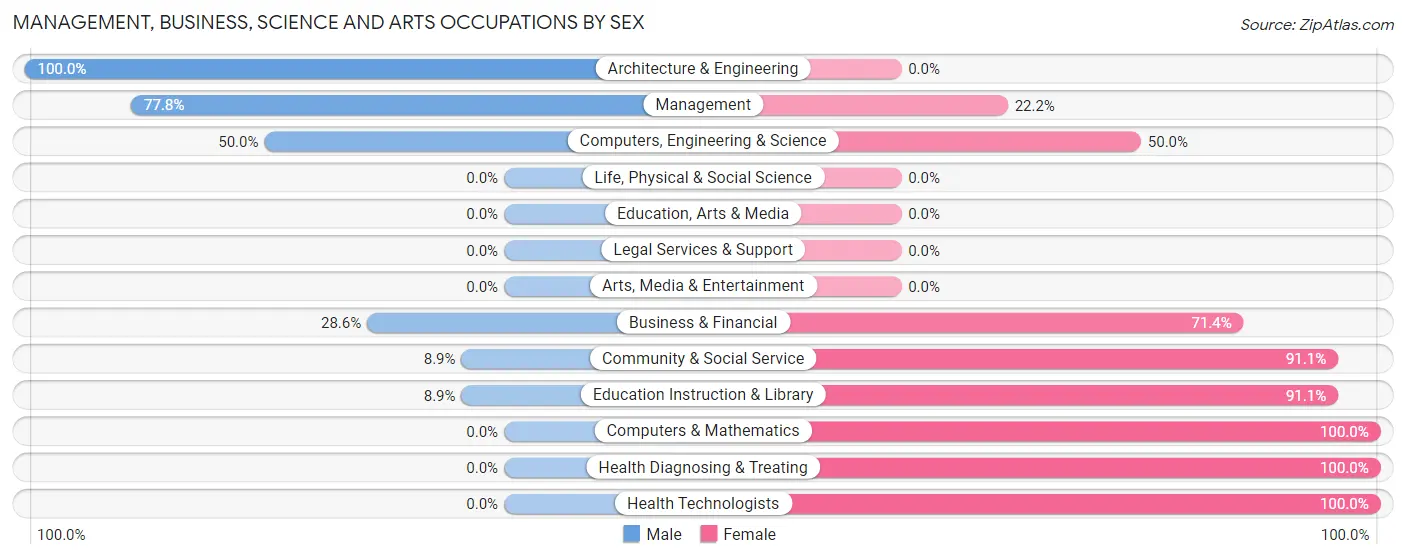
The most common Management, Business, Science and Arts occupations in Livonia are Management (63 | 11.7%), Health Diagnosing & Treating (48 | 8.9%), Health Technologists (48 | 8.9%), Community & Social Service (45 | 8.4%), and Education Instruction & Library (45 | 8.4%).
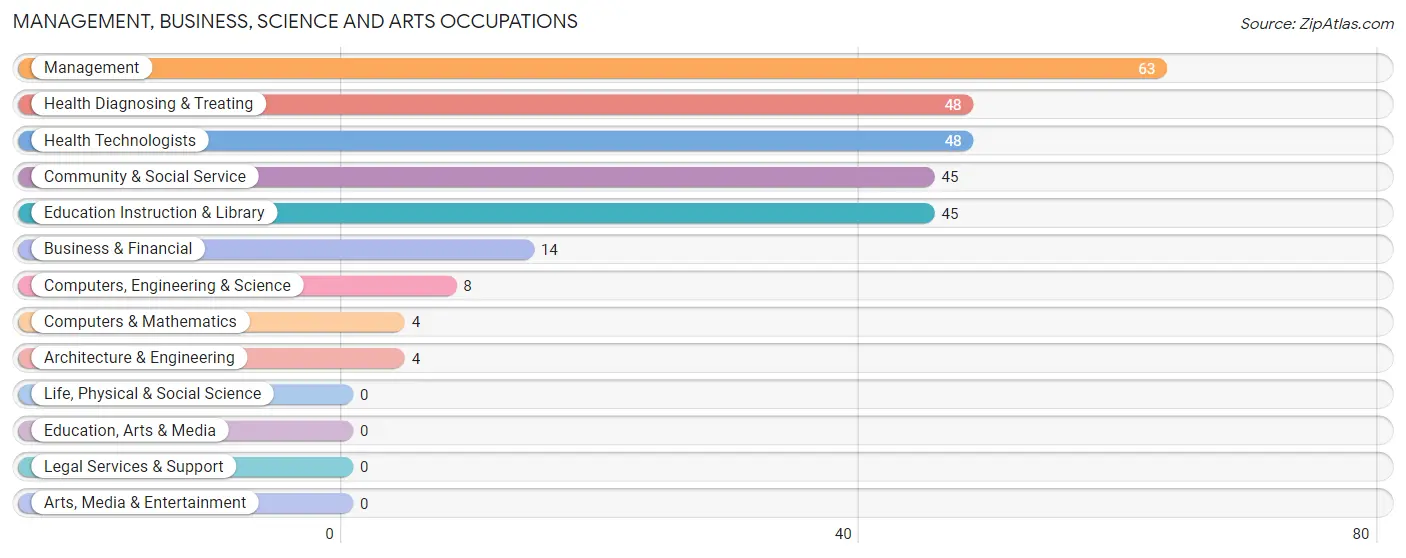
Management, Business, Science and Arts Occupations by Sex
Within the Management, Business, Science and Arts occupations in Livonia, the most male-oriented occupations are Architecture & Engineering (100.0%), Management (77.8%), and Computers, Engineering & Science (50.0%), while the most female-oriented occupations are Computers & Mathematics (100.0%), Health Diagnosing & Treating (100.0%), and Health Technologists (100.0%).
| Occupation | Male | Female |
| Management | 49 (77.8%) | 14 (22.2%) |
| Business & Financial | 4 (28.6%) | 10 (71.4%) |
| Computers, Engineering & Science | 4 (50.0%) | 4 (50.0%) |
| Computers & Mathematics | 0 (0.0%) | 4 (100.0%) |
| Architecture & Engineering | 4 (100.0%) | 0 (0.0%) |
| Life, Physical & Social Science | 0 (0.0%) | 0 (0.0%) |
| Community & Social Service | 4 (8.9%) | 41 (91.1%) |
| Education, Arts & Media | 0 (0.0%) | 0 (0.0%) |
| Legal Services & Support | 0 (0.0%) | 0 (0.0%) |
| Education Instruction & Library | 4 (8.9%) | 41 (91.1%) |
| Arts, Media & Entertainment | 0 (0.0%) | 0 (0.0%) |
| Health Diagnosing & Treating | 0 (0.0%) | 48 (100.0%) |
| Health Technologists | 0 (0.0%) | 48 (100.0%) |
| Total (Category) | 61 (34.3%) | 117 (65.7%) |
| Total (Overall) | 312 (58.0%) | 226 (42.0%) |
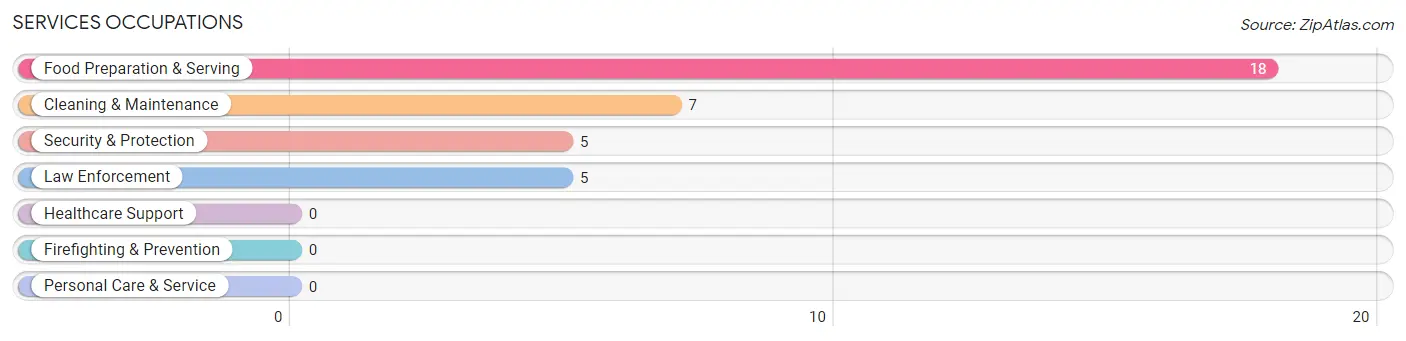
Services Occupations
The most common Services occupations in Livonia are Food Preparation & Serving (18 | 3.4%), Cleaning & Maintenance (7 | 1.3%), Security & Protection (5 | 0.9%), and Law Enforcement (5 | 0.9%).
Services Occupations by Sex
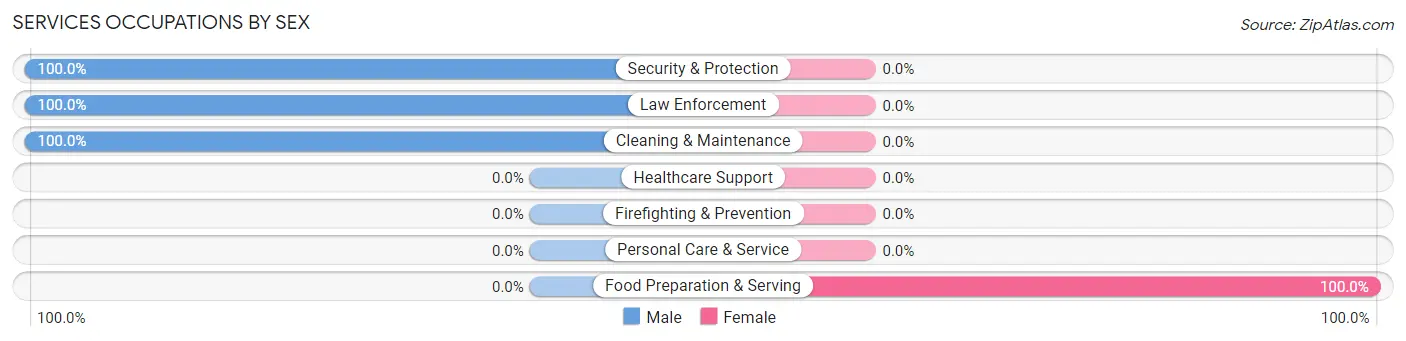
| Occupation | Male | Female |
| Healthcare Support | 0 (0.0%) | 0 (0.0%) |
| Security & Protection | 5 (100.0%) | 0 (0.0%) |
| Firefighting & Prevention | 0 (0.0%) | 0 (0.0%) |
| Law Enforcement | 5 (100.0%) | 0 (0.0%) |
| Food Preparation & Serving | 0 (0.0%) | 18 (100.0%) |
| Cleaning & Maintenance | 7 (100.0%) | 0 (0.0%) |
| Personal Care & Service | 0 (0.0%) | 0 (0.0%) |
| Total (Category) | 12 (40.0%) | 18 (60.0%) |
| Total (Overall) | 312 (58.0%) | 226 (42.0%) |
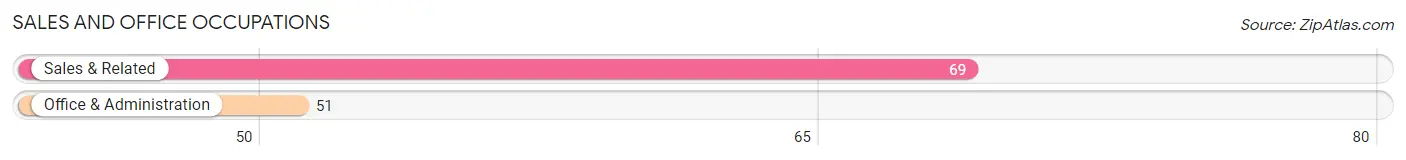
Sales and Office Occupations
The most common Sales and Office occupations in Livonia are Sales & Related (69 | 12.8%), and Office & Administration (51 | 9.5%).
Sales and Office Occupations by Sex
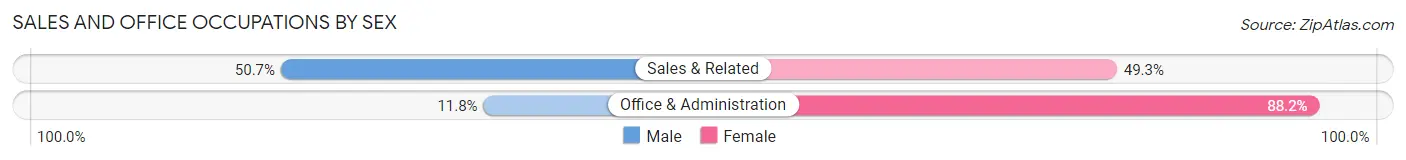
| Occupation | Male | Female |
| Sales & Related | 35 (50.7%) | 34 (49.3%) |
| Office & Administration | 6 (11.8%) | 45 (88.2%) |
| Total (Category) | 41 (34.2%) | 79 (65.8%) |
| Total (Overall) | 312 (58.0%) | 226 (42.0%) |
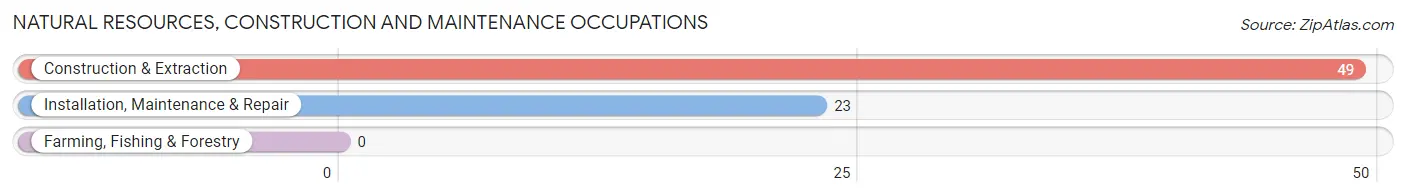
Natural Resources, Construction and Maintenance Occupations
The most common Natural Resources, Construction and Maintenance occupations in Livonia are Construction & Extraction (49 | 9.1%), and Installation, Maintenance & Repair (23 | 4.3%).
Natural Resources, Construction and Maintenance Occupations by Sex
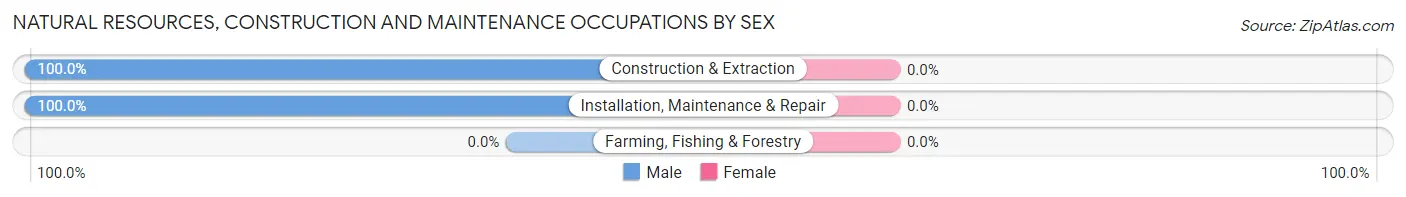
| Occupation | Male | Female |
| Farming, Fishing & Forestry | 0 (0.0%) | 0 (0.0%) |
| Construction & Extraction | 49 (100.0%) | 0 (0.0%) |
| Installation, Maintenance & Repair | 23 (100.0%) | 0 (0.0%) |
| Total (Category) | 72 (100.0%) | 0 (0.0%) |
| Total (Overall) | 312 (58.0%) | 226 (42.0%) |
Production, Transportation and Moving Occupations
The most common Production, Transportation and Moving occupations in Livonia are Production (89 | 16.5%), Transportation (36 | 6.7%), and Material Moving (13 | 2.4%).
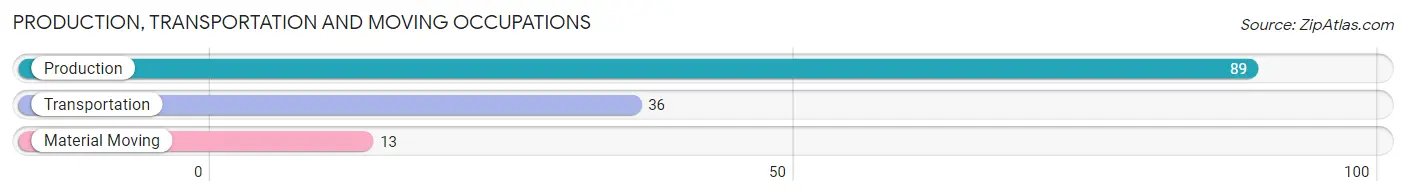
Production, Transportation and Moving Occupations by Sex
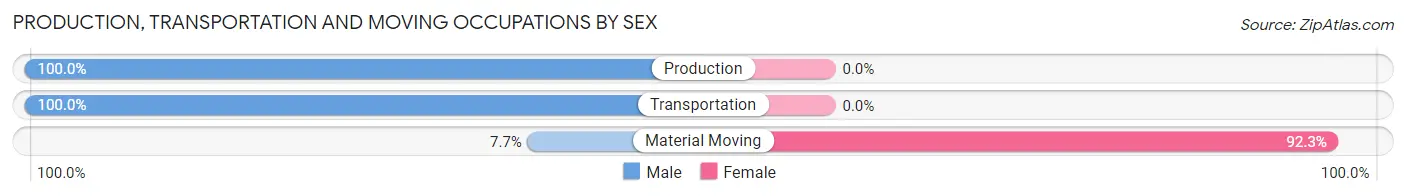
| Occupation | Male | Female |
| Production | 89 (100.0%) | 0 (0.0%) |
| Transportation | 36 (100.0%) | 0 (0.0%) |
| Material Moving | 1 (7.7%) | 12 (92.3%) |
| Total (Category) | 126 (91.3%) | 12 (8.7%) |
| Total (Overall) | 312 (58.0%) | 226 (42.0%) |
Employment Industries by Sex in Livonia
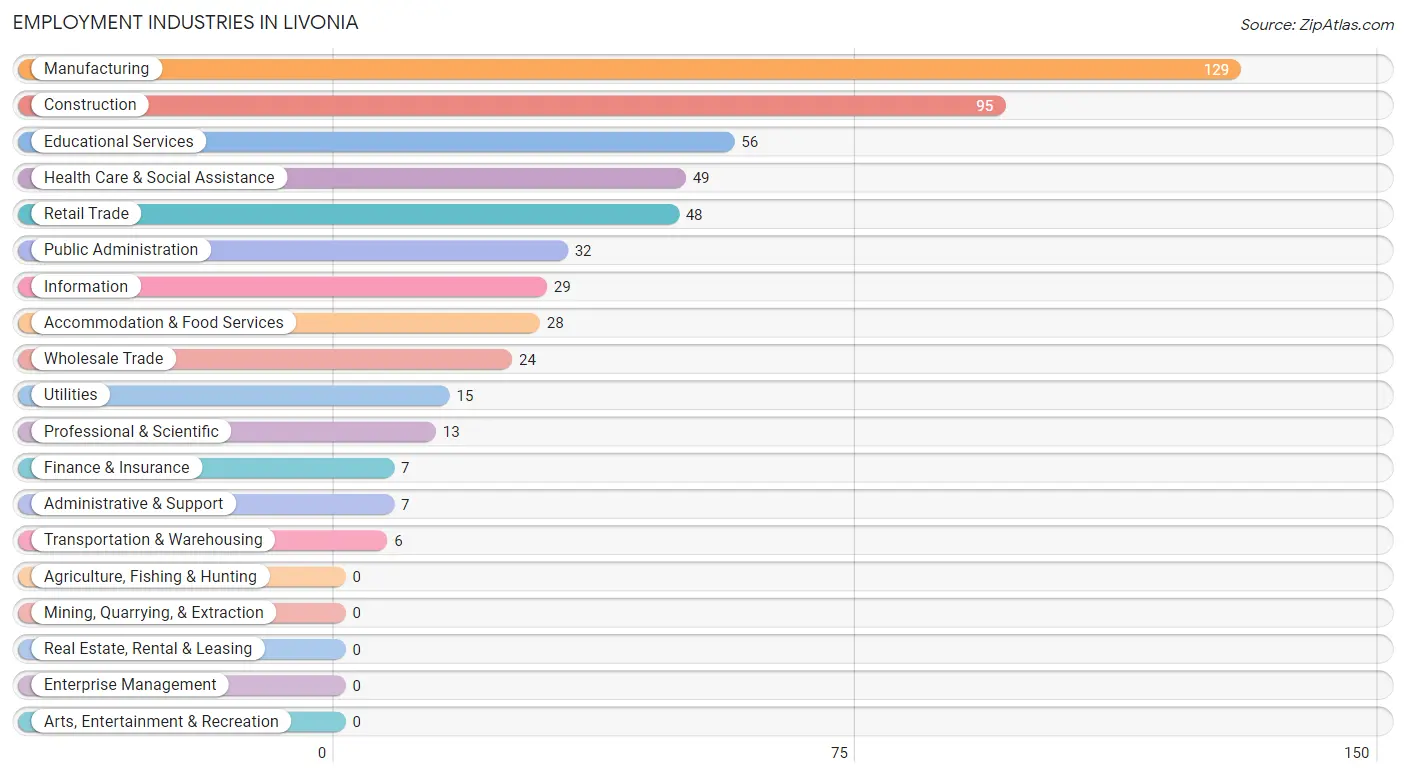
Employment Industries in Livonia
The major employment industries in Livonia include Manufacturing (129 | 24.0%), Construction (95 | 17.7%), Educational Services (56 | 10.4%), Health Care & Social Assistance (49 | 9.1%), and Retail Trade (48 | 8.9%).
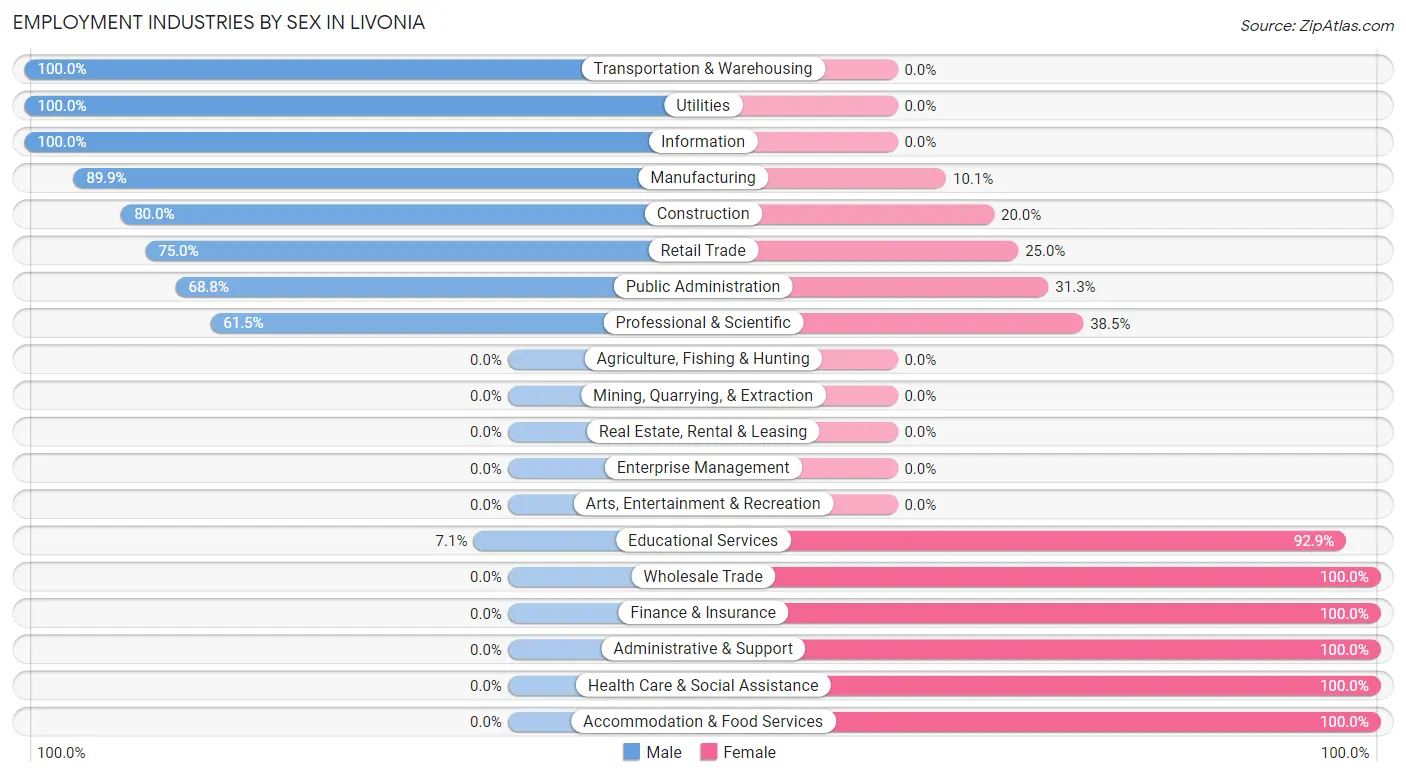
Employment Industries by Sex in Livonia
The Livonia industries that see more men than women are Transportation & Warehousing (100.0%), Utilities (100.0%), and Information (100.0%), whereas the industries that tend to have a higher number of women are Wholesale Trade (100.0%), Finance & Insurance (100.0%), and Administrative & Support (100.0%).
| Industry | Male | Female |
| Agriculture, Fishing & Hunting | 0 (0.0%) | 0 (0.0%) |
| Mining, Quarrying, & Extraction | 0 (0.0%) | 0 (0.0%) |
| Construction | 76 (80.0%) | 19 (20.0%) |
| Manufacturing | 116 (89.9%) | 13 (10.1%) |
| Wholesale Trade | 0 (0.0%) | 24 (100.0%) |
| Retail Trade | 36 (75.0%) | 12 (25.0%) |
| Transportation & Warehousing | 6 (100.0%) | 0 (0.0%) |
| Utilities | 15 (100.0%) | 0 (0.0%) |
| Information | 29 (100.0%) | 0 (0.0%) |
| Finance & Insurance | 0 (0.0%) | 7 (100.0%) |
| Real Estate, Rental & Leasing | 0 (0.0%) | 0 (0.0%) |
| Professional & Scientific | 8 (61.5%) | 5 (38.5%) |
| Enterprise Management | 0 (0.0%) | 0 (0.0%) |
| Administrative & Support | 0 (0.0%) | 7 (100.0%) |
| Educational Services | 4 (7.1%) | 52 (92.9%) |
| Health Care & Social Assistance | 0 (0.0%) | 49 (100.0%) |
| Arts, Entertainment & Recreation | 0 (0.0%) | 0 (0.0%) |
| Accommodation & Food Services | 0 (0.0%) | 28 (100.0%) |
| Public Administration | 22 (68.8%) | 10 (31.2%) |
| Total | 312 (58.0%) | 226 (42.0%) |
Education in Livonia
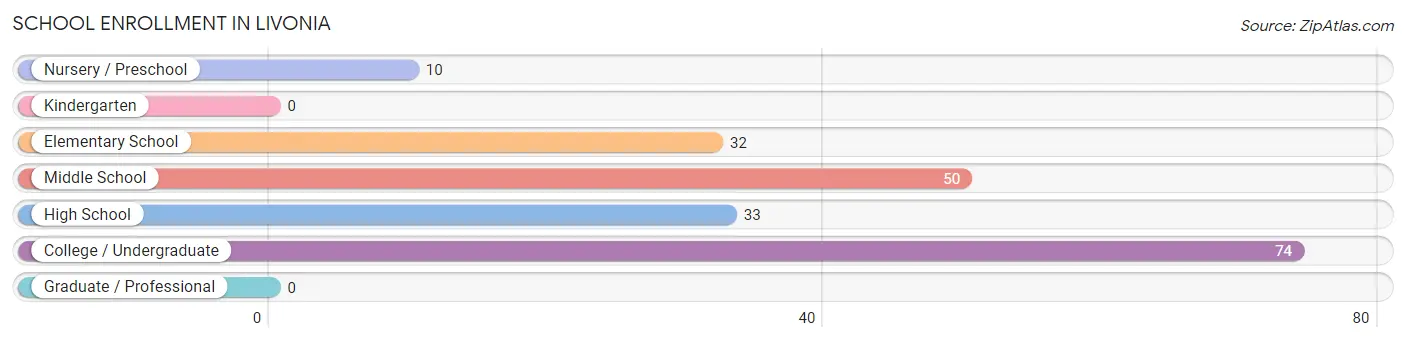
School Enrollment in Livonia
The most common levels of schooling among the 199 students in Livonia are college / undergraduate (74 | 37.2%), middle school (50 | 25.1%), and high school (33 | 16.6%).
| School Level | # Students | % Students |
| Nursery / Preschool | 10 | 5.0% |
| Kindergarten | 0 | 0.0% |
| Elementary School | 32 | 16.1% |
| Middle School | 50 | 25.1% |
| High School | 33 | 16.6% |
| College / Undergraduate | 74 | 37.2% |
| Graduate / Professional | 0 | 0.0% |
| Total | 199 | 100.0% |
School Enrollment by Age by Funding Source in Livonia
Out of a total of 199 students who are enrolled in schools in Livonia, 47 (23.6%) attend a private institution, while the remaining 152 (76.4%) are enrolled in public schools. The age group of 20 to 24 year olds has the highest likelihood of being enrolled in private schools, with 24 (57.1% in the age bracket) enrolled. Conversely, the age group of 3 to 4 year olds has the lowest likelihood of being enrolled in a private school, with 10 (100.0% in the age bracket) attending a public institution.
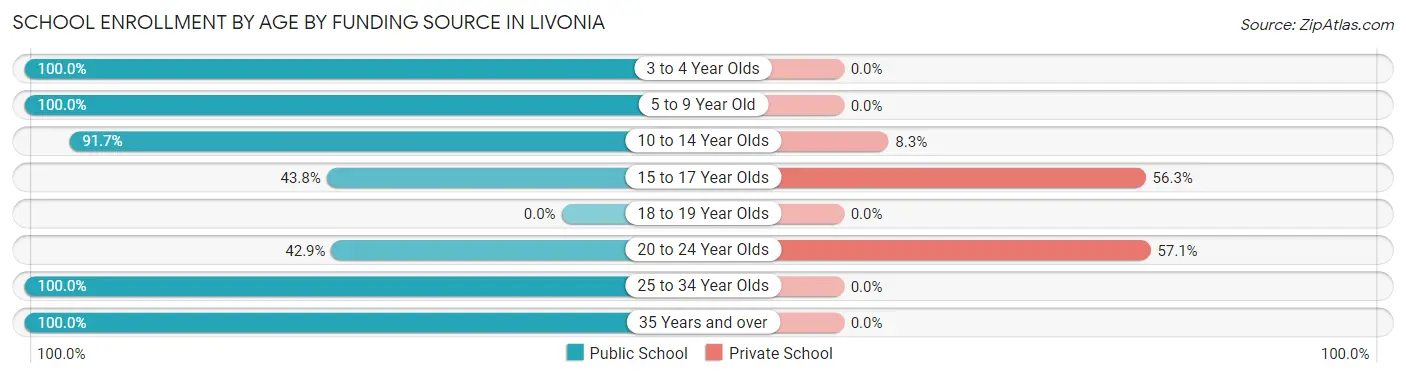
| Age Bracket | Public School | Private School |
| 3 to 4 Year Olds | 10 (100.0%) | 0 (0.0%) |
| 5 to 9 Year Old | 22 (100.0%) | 0 (0.0%) |
| 10 to 14 Year Olds | 55 (91.7%) | 5 (8.3%) |
| 15 to 17 Year Olds | 14 (43.8%) | 18 (56.2%) |
| 18 to 19 Year Olds | 0 (0.0%) | 0 (0.0%) |
| 20 to 24 Year Olds | 18 (42.9%) | 24 (57.1%) |
| 25 to 34 Year Olds | 32 (100.0%) | 0 (0.0%) |
| 35 Years and over | 1 (100.0%) | 0 (0.0%) |
| Total | 152 (76.4%) | 47 (23.6%) |
Educational Attainment by Field of Study in Livonia
Science & technology (35 | 29.2%), computers & mathematics (29 | 24.2%), arts & humanities (16 | 13.3%), literature & languages (14 | 11.7%), and education (12 | 10.0%) are the most common fields of study among 120 individuals in Livonia who have obtained a bachelor's degree or higher.
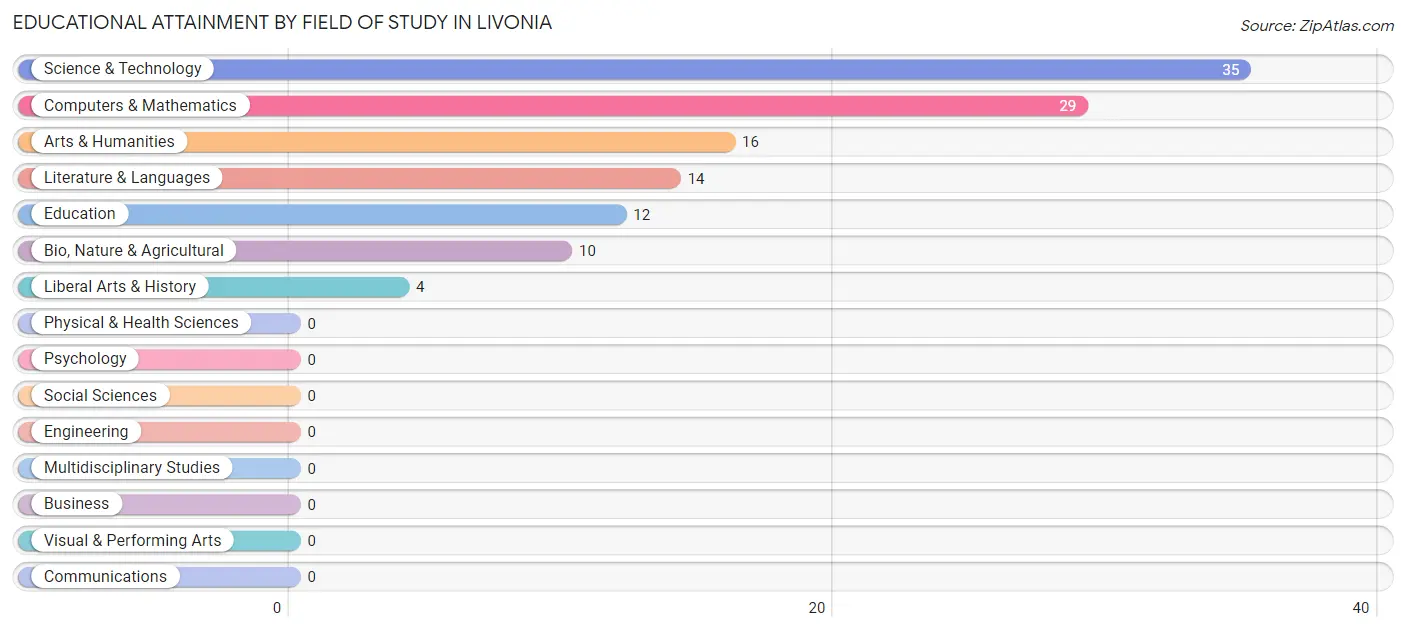
| Field of Study | # Graduates | % Graduates |
| Computers & Mathematics | 29 | 24.2% |
| Bio, Nature & Agricultural | 10 | 8.3% |
| Physical & Health Sciences | 0 | 0.0% |
| Psychology | 0 | 0.0% |
| Social Sciences | 0 | 0.0% |
| Engineering | 0 | 0.0% |
| Multidisciplinary Studies | 0 | 0.0% |
| Science & Technology | 35 | 29.2% |
| Business | 0 | 0.0% |
| Education | 12 | 10.0% |
| Literature & Languages | 14 | 11.7% |
| Liberal Arts & History | 4 | 3.3% |
| Visual & Performing Arts | 0 | 0.0% |
| Communications | 0 | 0.0% |
| Arts & Humanities | 16 | 13.3% |
| Total | 120 | 100.0% |
Transportation & Commute in Livonia
Vehicle Availability by Sex in Livonia
The most prevalent vehicle ownership categories in Livonia are males with 2 vehicles (121, accounting for 38.8%) and females with 2 vehicles (105, making up 53.5%).
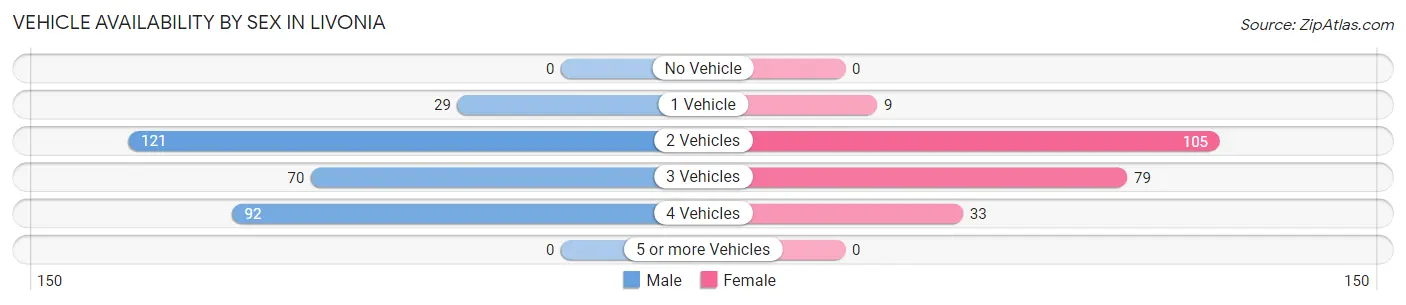
| Vehicles Available | Male | Female |
| No Vehicle | 0 (0.0%) | 0 (0.0%) |
| 1 Vehicle | 29 (9.3%) | 9 (4.0%) |
| 2 Vehicles | 121 (38.8%) | 105 (46.5%) |
| 3 Vehicles | 70 (22.4%) | 79 (35.0%) |
| 4 Vehicles | 92 (29.5%) | 33 (14.6%) |
| 5 or more Vehicles | 0 (0.0%) | 0 (0.0%) |
| Total | 312 (100.0%) | 226 (100.0%) |
Commute Time in Livonia
The most frequently occuring commute durations in Livonia are 5 to 9 minutes (118 commuters, 21.9%), 45 to 59 minutes (97 commuters, 18.0%), and 30 to 34 minutes (86 commuters, 16.0%).
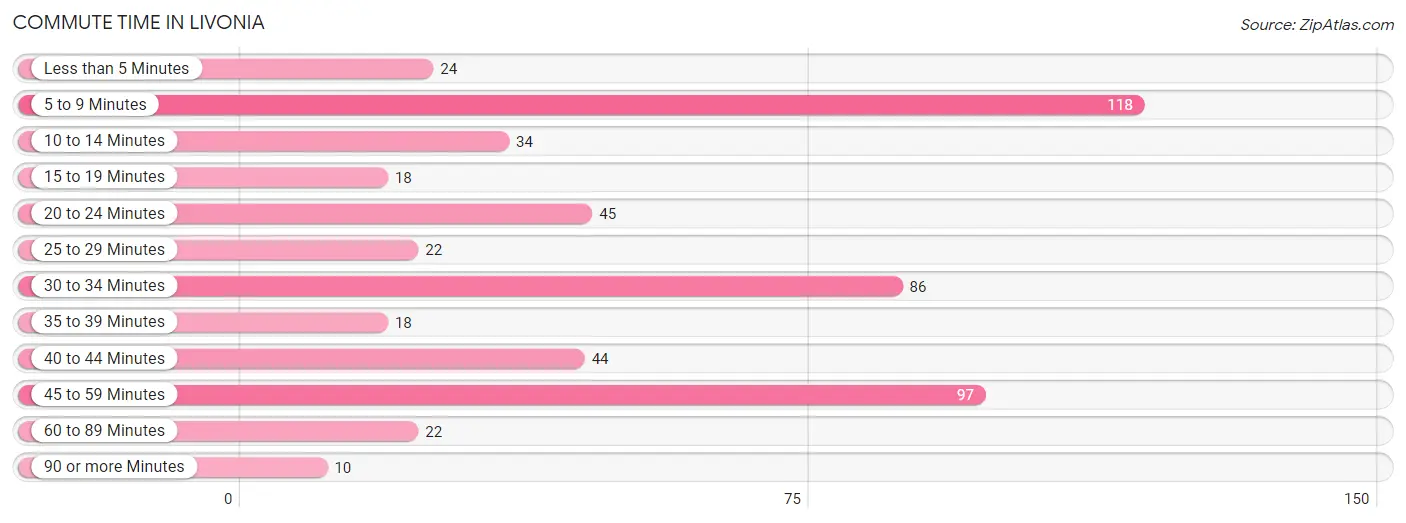
| Commute Time | # Commuters | % Commuters |
| Less than 5 Minutes | 24 | 4.5% |
| 5 to 9 Minutes | 118 | 21.9% |
| 10 to 14 Minutes | 34 | 6.3% |
| 15 to 19 Minutes | 18 | 3.4% |
| 20 to 24 Minutes | 45 | 8.4% |
| 25 to 29 Minutes | 22 | 4.1% |
| 30 to 34 Minutes | 86 | 16.0% |
| 35 to 39 Minutes | 18 | 3.4% |
| 40 to 44 Minutes | 44 | 8.2% |
| 45 to 59 Minutes | 97 | 18.0% |
| 60 to 89 Minutes | 22 | 4.1% |
| 90 or more Minutes | 10 | 1.9% |
Commute Time by Sex in Livonia
The most common commute times in Livonia are 5 to 9 minutes (88 commuters, 28.2%) for males and 45 to 59 minutes (76 commuters, 33.6%) for females.
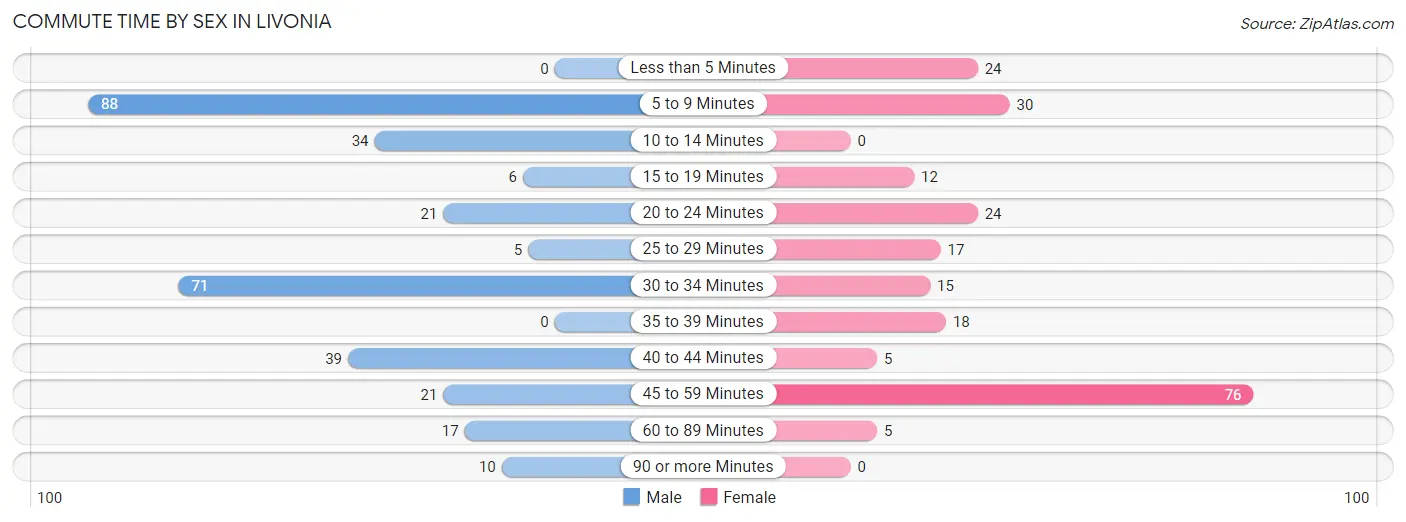
| Commute Time | Male | Female |
| Less than 5 Minutes | 0 (0.0%) | 24 (10.6%) |
| 5 to 9 Minutes | 88 (28.2%) | 30 (13.3%) |
| 10 to 14 Minutes | 34 (10.9%) | 0 (0.0%) |
| 15 to 19 Minutes | 6 (1.9%) | 12 (5.3%) |
| 20 to 24 Minutes | 21 (6.7%) | 24 (10.6%) |
| 25 to 29 Minutes | 5 (1.6%) | 17 (7.5%) |
| 30 to 34 Minutes | 71 (22.8%) | 15 (6.6%) |
| 35 to 39 Minutes | 0 (0.0%) | 18 (8.0%) |
| 40 to 44 Minutes | 39 (12.5%) | 5 (2.2%) |
| 45 to 59 Minutes | 21 (6.7%) | 76 (33.6%) |
| 60 to 89 Minutes | 17 (5.4%) | 5 (2.2%) |
| 90 or more Minutes | 10 (3.2%) | 0 (0.0%) |
Time of Departure to Work by Sex in Livonia
The most frequent times of departure to work in Livonia are 6:30 AM to 6:59 AM (92, 29.5%) for males and 6:00 AM to 6:29 AM (64, 28.3%) for females.
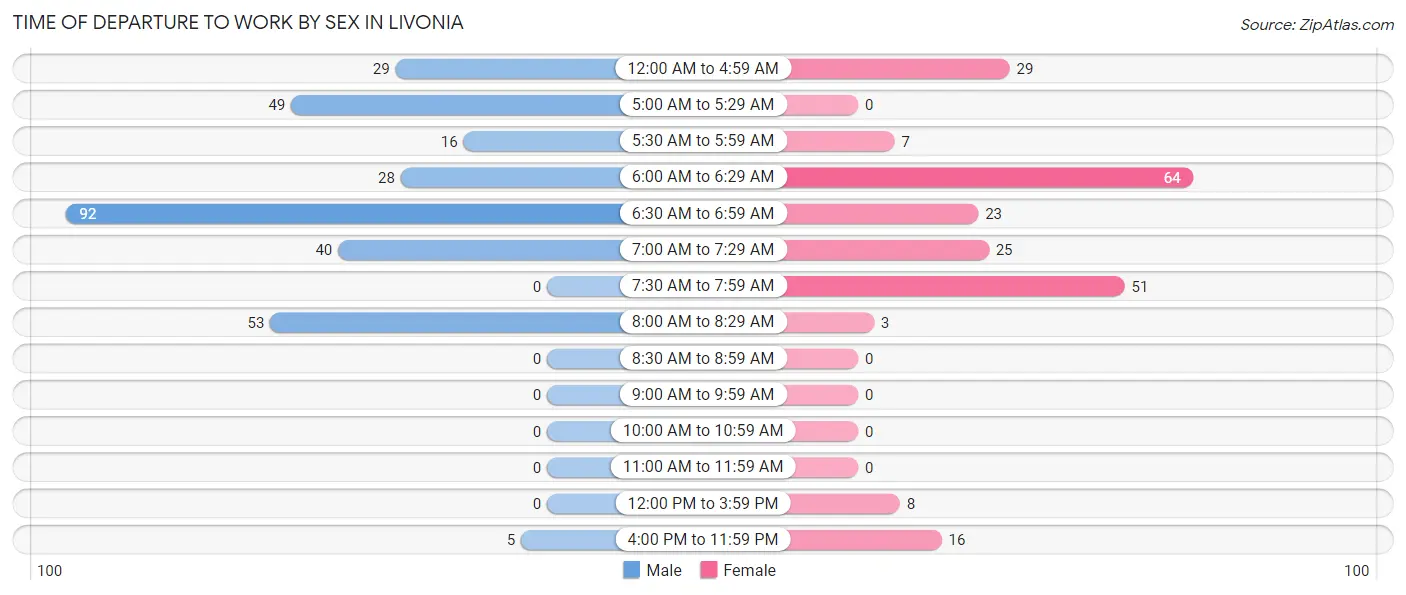
| Time of Departure | Male | Female |
| 12:00 AM to 4:59 AM | 29 (9.3%) | 29 (12.8%) |
| 5:00 AM to 5:29 AM | 49 (15.7%) | 0 (0.0%) |
| 5:30 AM to 5:59 AM | 16 (5.1%) | 7 (3.1%) |
| 6:00 AM to 6:29 AM | 28 (9.0%) | 64 (28.3%) |
| 6:30 AM to 6:59 AM | 92 (29.5%) | 23 (10.2%) |
| 7:00 AM to 7:29 AM | 40 (12.8%) | 25 (11.1%) |
| 7:30 AM to 7:59 AM | 0 (0.0%) | 51 (22.6%) |
| 8:00 AM to 8:29 AM | 53 (17.0%) | 3 (1.3%) |
| 8:30 AM to 8:59 AM | 0 (0.0%) | 0 (0.0%) |
| 9:00 AM to 9:59 AM | 0 (0.0%) | 0 (0.0%) |
| 10:00 AM to 10:59 AM | 0 (0.0%) | 0 (0.0%) |
| 11:00 AM to 11:59 AM | 0 (0.0%) | 0 (0.0%) |
| 12:00 PM to 3:59 PM | 0 (0.0%) | 8 (3.5%) |
| 4:00 PM to 11:59 PM | 5 (1.6%) | 16 (7.1%) |
| Total | 312 (100.0%) | 226 (100.0%) |
Housing Occupancy in Livonia
Occupancy by Ownership in Livonia
Of the total 518 dwellings in Livonia, owner-occupied units account for 412 (79.5%), while renter-occupied units make up 106 (20.5%).
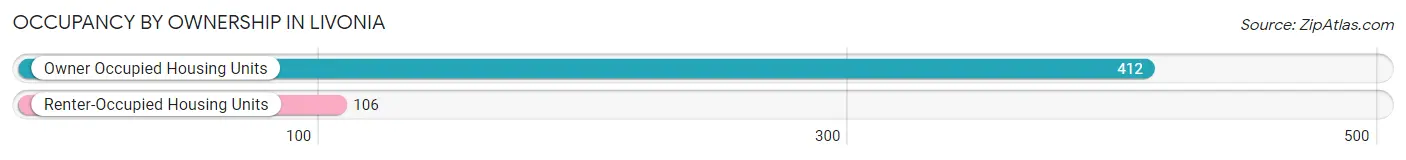
| Occupancy | # Housing Units | % Housing Units |
| Owner Occupied Housing Units | 412 | 79.5% |
| Renter-Occupied Housing Units | 106 | 20.5% |
| Total Occupied Housing Units | 518 | 100.0% |
Occupancy by Household Size in Livonia
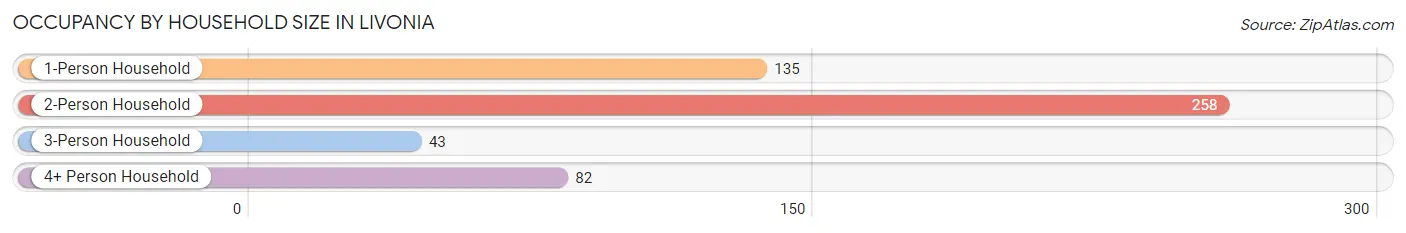
| Household Size | # Housing Units | % Housing Units |
| 1-Person Household | 135 | 26.1% |
| 2-Person Household | 258 | 49.8% |
| 3-Person Household | 43 | 8.3% |
| 4+ Person Household | 82 | 15.8% |
| Total Housing Units | 518 | 100.0% |
Occupancy by Ownership by Household Size in Livonia
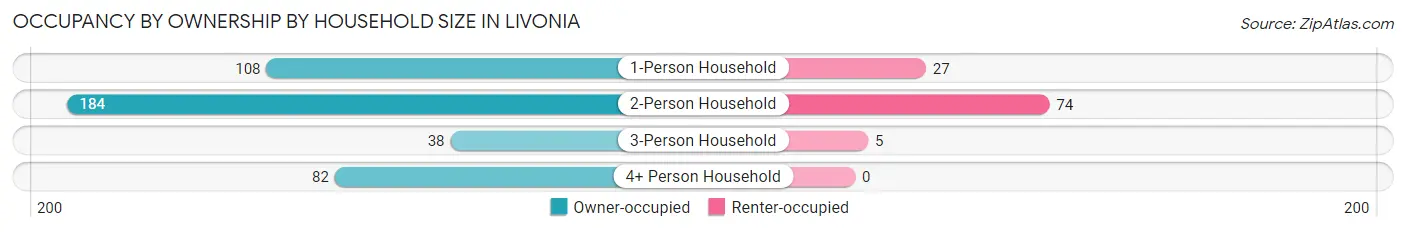
| Household Size | Owner-occupied | Renter-occupied |
| 1-Person Household | 108 (80.0%) | 27 (20.0%) |
| 2-Person Household | 184 (71.3%) | 74 (28.7%) |
| 3-Person Household | 38 (88.4%) | 5 (11.6%) |
| 4+ Person Household | 82 (100.0%) | 0 (0.0%) |
| Total Housing Units | 412 (79.5%) | 106 (20.5%) |
Occupancy by Educational Attainment in Livonia
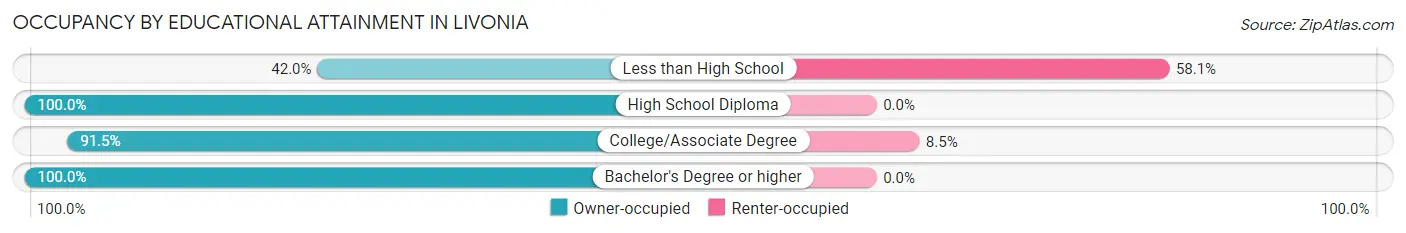
| Household Size | Owner-occupied | Renter-occupied |
| Less than High School | 73 (41.9%) | 101 (58.1%) |
| High School Diploma | 178 (100.0%) | 0 (0.0%) |
| College/Associate Degree | 54 (91.5%) | 5 (8.5%) |
| Bachelor's Degree or higher | 107 (100.0%) | 0 (0.0%) |
Occupancy by Age of Householder in Livonia
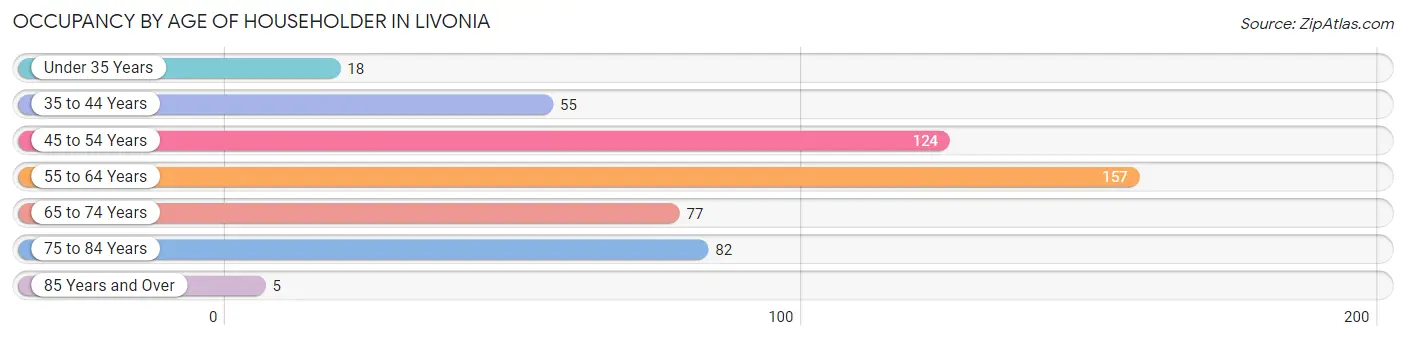
| Age Bracket | # Households | % Households |
| Under 35 Years | 18 | 3.5% |
| 35 to 44 Years | 55 | 10.6% |
| 45 to 54 Years | 124 | 23.9% |
| 55 to 64 Years | 157 | 30.3% |
| 65 to 74 Years | 77 | 14.9% |
| 75 to 84 Years | 82 | 15.8% |
| 85 Years and Over | 5 | 1.0% |
| Total | 518 | 100.0% |
Housing Finances in Livonia
Median Income by Occupancy in Livonia
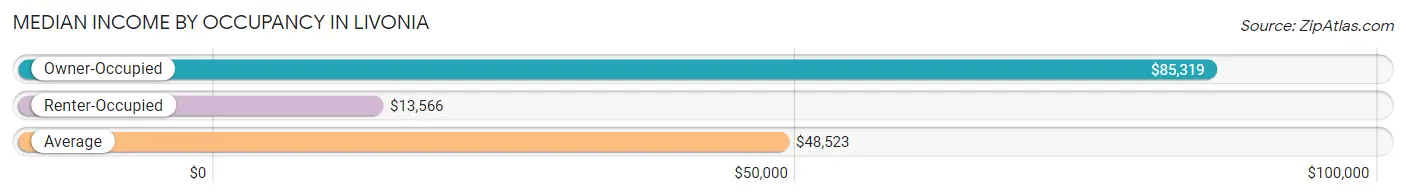
| Occupancy Type | # Households | Median Income |
| Owner-Occupied | 412 (79.5%) | $85,319 |
| Renter-Occupied | 106 (20.5%) | $13,566 |
| Average | 518 (100.0%) | $48,523 |
Occupancy by Householder Income Bracket in Livonia
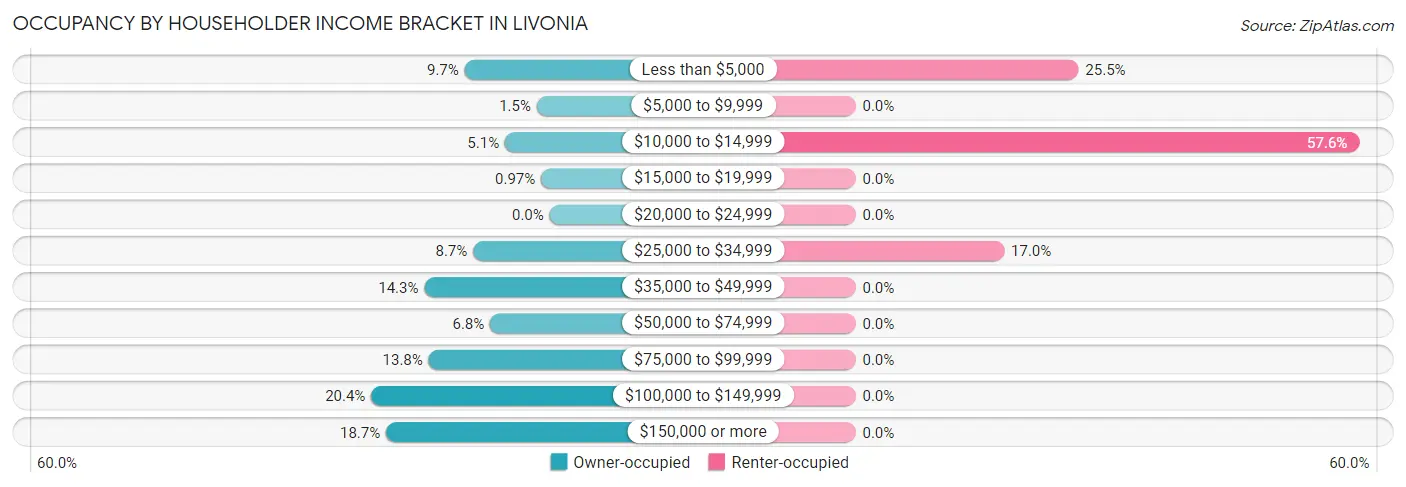
| Income Bracket | Owner-occupied | Renter-occupied |
| Less than $5,000 | 40 (9.7%) | 27 (25.5%) |
| $5,000 to $9,999 | 6 (1.5%) | 0 (0.0%) |
| $10,000 to $14,999 | 21 (5.1%) | 61 (57.6%) |
| $15,000 to $19,999 | 4 (1.0%) | 0 (0.0%) |
| $20,000 to $24,999 | 0 (0.0%) | 0 (0.0%) |
| $25,000 to $34,999 | 36 (8.7%) | 18 (17.0%) |
| $35,000 to $49,999 | 59 (14.3%) | 0 (0.0%) |
| $50,000 to $74,999 | 28 (6.8%) | 0 (0.0%) |
| $75,000 to $99,999 | 57 (13.8%) | 0 (0.0%) |
| $100,000 to $149,999 | 84 (20.4%) | 0 (0.0%) |
| $150,000 or more | 77 (18.7%) | 0 (0.0%) |
| Total | 412 (100.0%) | 106 (100.0%) |
Monthly Housing Cost Tiers in Livonia
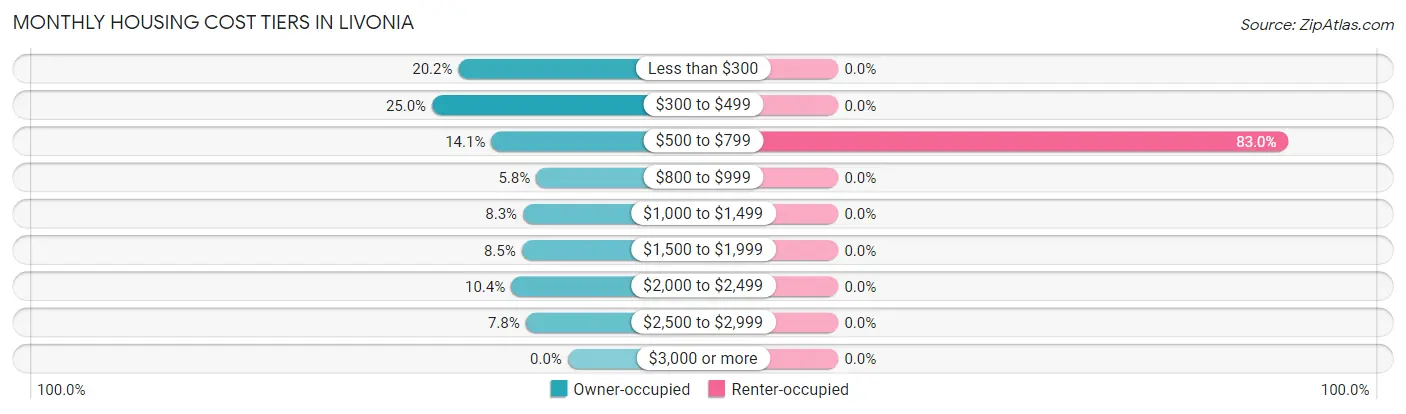
| Monthly Cost | Owner-occupied | Renter-occupied |
| Less than $300 | 83 (20.2%) | 0 (0.0%) |
| $300 to $499 | 103 (25.0%) | 0 (0.0%) |
| $500 to $799 | 58 (14.1%) | 88 (83.0%) |
| $800 to $999 | 24 (5.8%) | 0 (0.0%) |
| $1,000 to $1,499 | 34 (8.3%) | 0 (0.0%) |
| $1,500 to $1,999 | 35 (8.5%) | 0 (0.0%) |
| $2,000 to $2,499 | 43 (10.4%) | 0 (0.0%) |
| $2,500 to $2,999 | 32 (7.8%) | 0 (0.0%) |
| $3,000 or more | 0 (0.0%) | 0 (0.0%) |
| Total | 412 (100.0%) | 106 (100.0%) |
Physical Housing Characteristics in Livonia
Housing Structures in Livonia
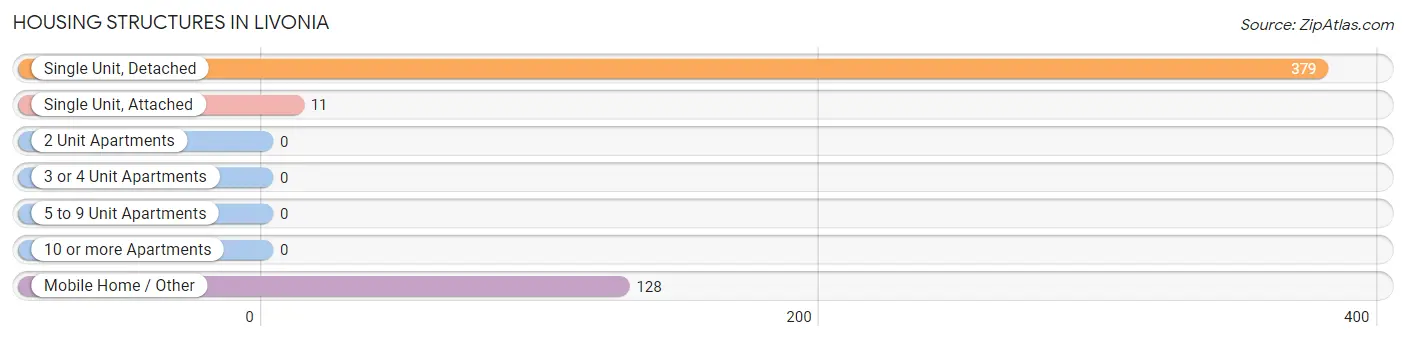
| Structure Type | # Housing Units | % Housing Units |
| Single Unit, Detached | 379 | 73.2% |
| Single Unit, Attached | 11 | 2.1% |
| 2 Unit Apartments | 0 | 0.0% |
| 3 or 4 Unit Apartments | 0 | 0.0% |
| 5 to 9 Unit Apartments | 0 | 0.0% |
| 10 or more Apartments | 0 | 0.0% |
| Mobile Home / Other | 128 | 24.7% |
| Total | 518 | 100.0% |
Housing Structures by Occupancy in Livonia
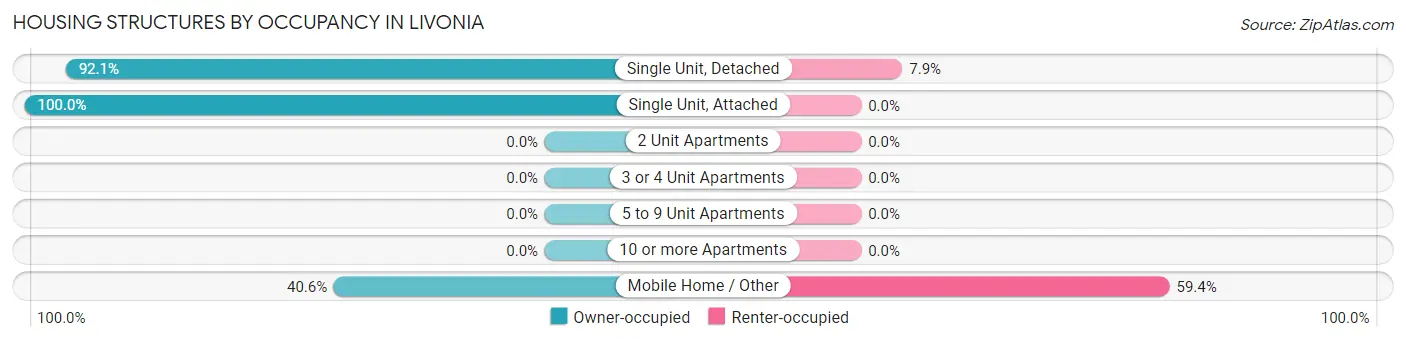
| Structure Type | Owner-occupied | Renter-occupied |
| Single Unit, Detached | 349 (92.1%) | 30 (7.9%) |
| Single Unit, Attached | 11 (100.0%) | 0 (0.0%) |
| 2 Unit Apartments | 0 (0.0%) | 0 (0.0%) |
| 3 or 4 Unit Apartments | 0 (0.0%) | 0 (0.0%) |
| 5 to 9 Unit Apartments | 0 (0.0%) | 0 (0.0%) |
| 10 or more Apartments | 0 (0.0%) | 0 (0.0%) |
| Mobile Home / Other | 52 (40.6%) | 76 (59.4%) |
| Total | 412 (79.5%) | 106 (20.5%) |
Housing Structures by Number of Rooms in Livonia
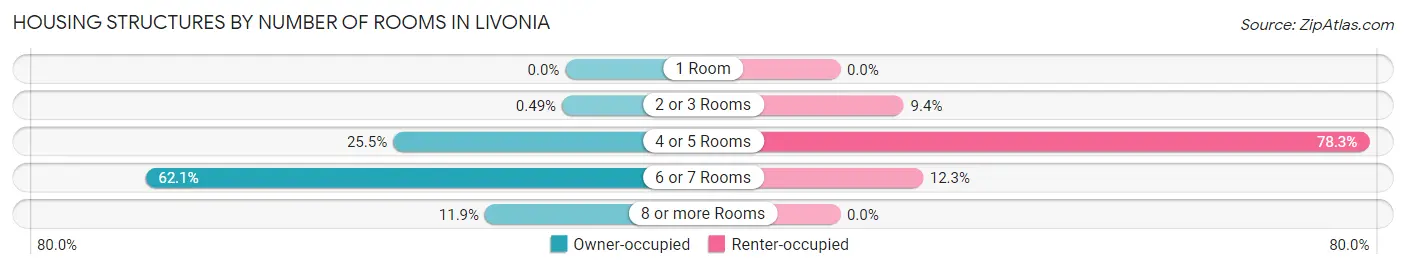
| Number of Rooms | Owner-occupied | Renter-occupied |
| 1 Room | 0 (0.0%) | 0 (0.0%) |
| 2 or 3 Rooms | 2 (0.5%) | 10 (9.4%) |
| 4 or 5 Rooms | 105 (25.5%) | 83 (78.3%) |
| 6 or 7 Rooms | 256 (62.1%) | 13 (12.3%) |
| 8 or more Rooms | 49 (11.9%) | 0 (0.0%) |
| Total | 412 (100.0%) | 106 (100.0%) |
Housing Structure by Heating Type in Livonia
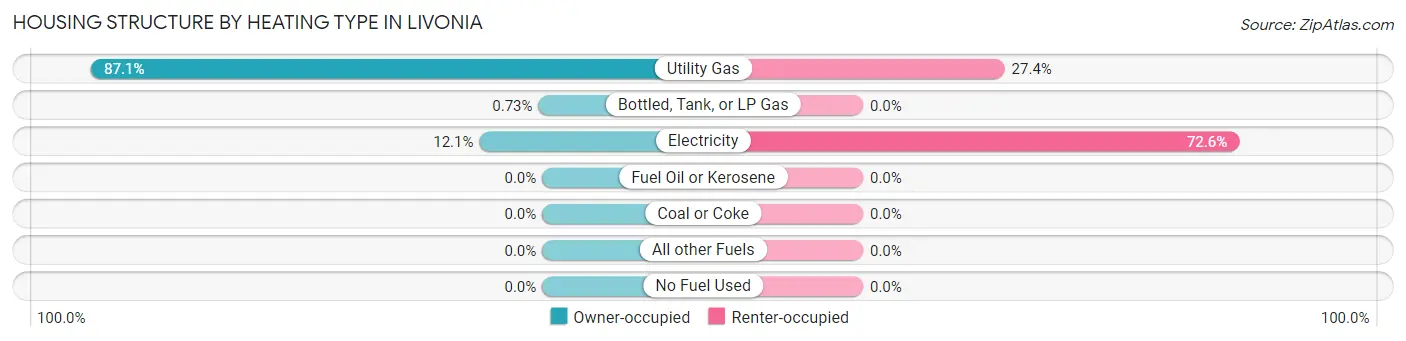
| Heating Type | Owner-occupied | Renter-occupied |
| Utility Gas | 359 (87.1%) | 29 (27.4%) |
| Bottled, Tank, or LP Gas | 3 (0.7%) | 0 (0.0%) |
| Electricity | 50 (12.1%) | 77 (72.6%) |
| Fuel Oil or Kerosene | 0 (0.0%) | 0 (0.0%) |
| Coal or Coke | 0 (0.0%) | 0 (0.0%) |
| All other Fuels | 0 (0.0%) | 0 (0.0%) |
| No Fuel Used | 0 (0.0%) | 0 (0.0%) |
| Total | 412 (100.0%) | 106 (100.0%) |
Household Vehicle Usage in Livonia
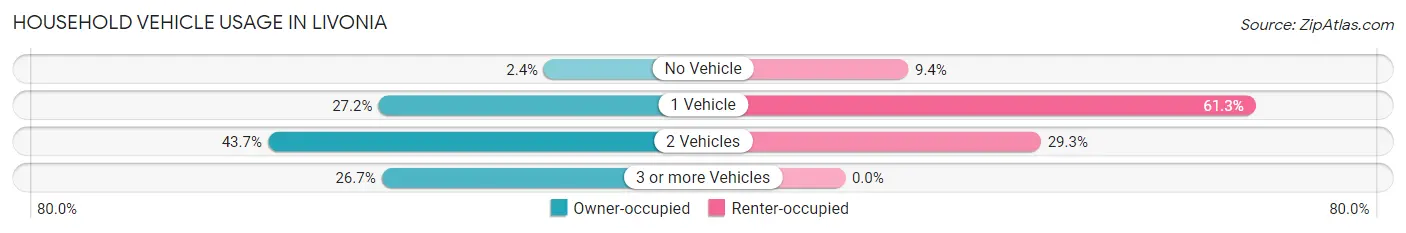
| Vehicles per Household | Owner-occupied | Renter-occupied |
| No Vehicle | 10 (2.4%) | 10 (9.4%) |
| 1 Vehicle | 112 (27.2%) | 65 (61.3%) |
| 2 Vehicles | 180 (43.7%) | 31 (29.2%) |
| 3 or more Vehicles | 110 (26.7%) | 0 (0.0%) |
| Total | 412 (100.0%) | 106 (100.0%) |
Real Estate & Mortgages in Livonia
Real Estate and Mortgage Overview in Livonia
| Characteristic | Without Mortgage | With Mortgage |
| Housing Units | 217 | 195 |
| Median Property Value | $122,100 | $262,500 |
| Median Household Income | $35,250 | $75 |
| Monthly Housing Costs | $371 | $0 |
| Real Estate Taxes | $346 | $0 |
Property Value by Mortgage Status in Livonia
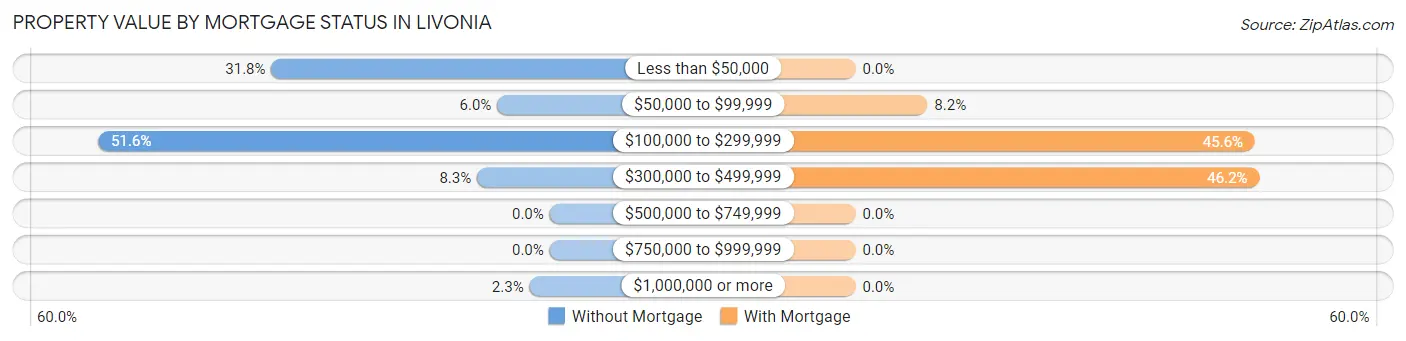
| Property Value | Without Mortgage | With Mortgage |
| Less than $50,000 | 69 (31.8%) | 0 (0.0%) |
| $50,000 to $99,999 | 13 (6.0%) | 16 (8.2%) |
| $100,000 to $299,999 | 112 (51.6%) | 89 (45.6%) |
| $300,000 to $499,999 | 18 (8.3%) | 90 (46.2%) |
| $500,000 to $749,999 | 0 (0.0%) | 0 (0.0%) |
| $750,000 to $999,999 | 0 (0.0%) | 0 (0.0%) |
| $1,000,000 or more | 5 (2.3%) | 0 (0.0%) |
| Total | 217 (100.0%) | 195 (100.0%) |
Household Income by Mortgage Status in Livonia
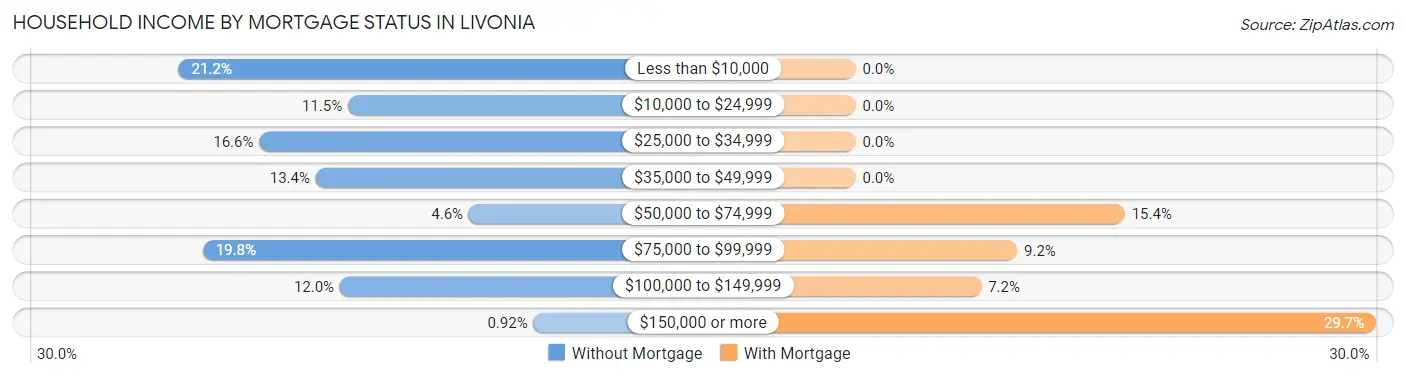
| Household Income | Without Mortgage | With Mortgage |
| Less than $10,000 | 46 (21.2%) | 0 (0.0%) |
| $10,000 to $24,999 | 25 (11.5%) | 0 (0.0%) |
| $25,000 to $34,999 | 36 (16.6%) | 0 (0.0%) |
| $35,000 to $49,999 | 29 (13.4%) | 0 (0.0%) |
| $50,000 to $74,999 | 10 (4.6%) | 30 (15.4%) |
| $75,000 to $99,999 | 43 (19.8%) | 18 (9.2%) |
| $100,000 to $149,999 | 26 (12.0%) | 14 (7.2%) |
| $150,000 or more | 2 (0.9%) | 58 (29.7%) |
| Total | 217 (100.0%) | 195 (100.0%) |
Property Value to Household Income Ratio in Livonia
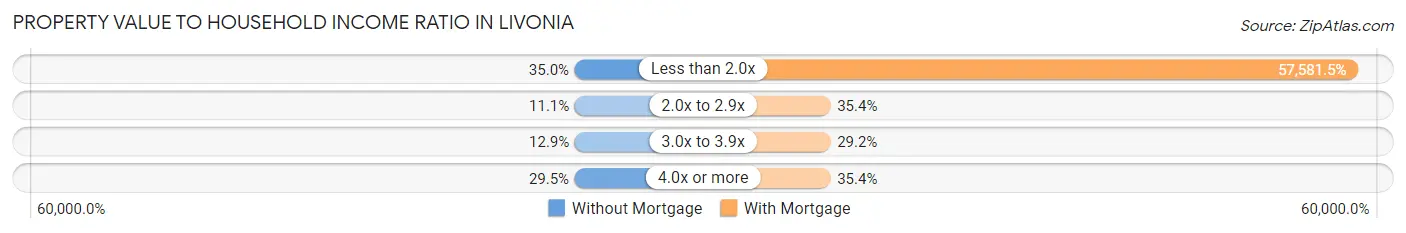
| Value-to-Income Ratio | Without Mortgage | With Mortgage |
| Less than 2.0x | 76 (35.0%) | 112,284 (57,581.5%) |
| 2.0x to 2.9x | 24 (11.1%) | 69 (35.4%) |
| 3.0x to 3.9x | 28 (12.9%) | 57 (29.2%) |
| 4.0x or more | 64 (29.5%) | 69 (35.4%) |
| Total | 217 (100.0%) | 195 (100.0%) |
Real Estate Taxes by Mortgage Status in Livonia
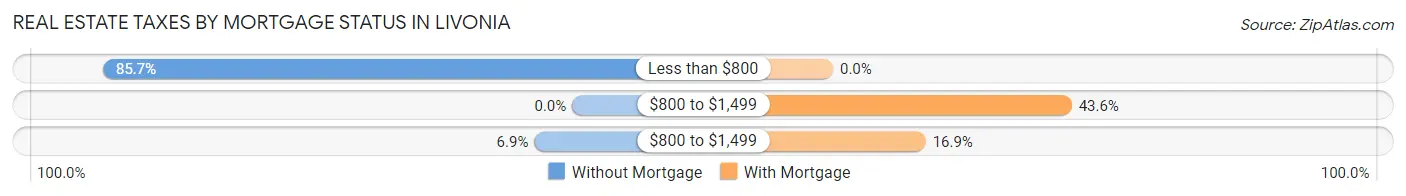
| Property Taxes | Without Mortgage | With Mortgage |
| Less than $800 | 186 (85.7%) | 0 (0.0%) |
| $800 to $1,499 | 0 (0.0%) | 85 (43.6%) |
| $800 to $1,499 | 15 (6.9%) | 33 (16.9%) |
| Total | 217 (100.0%) | 195 (100.0%) |
Health & Disability in Livonia
Health Insurance Coverage by Age in Livonia
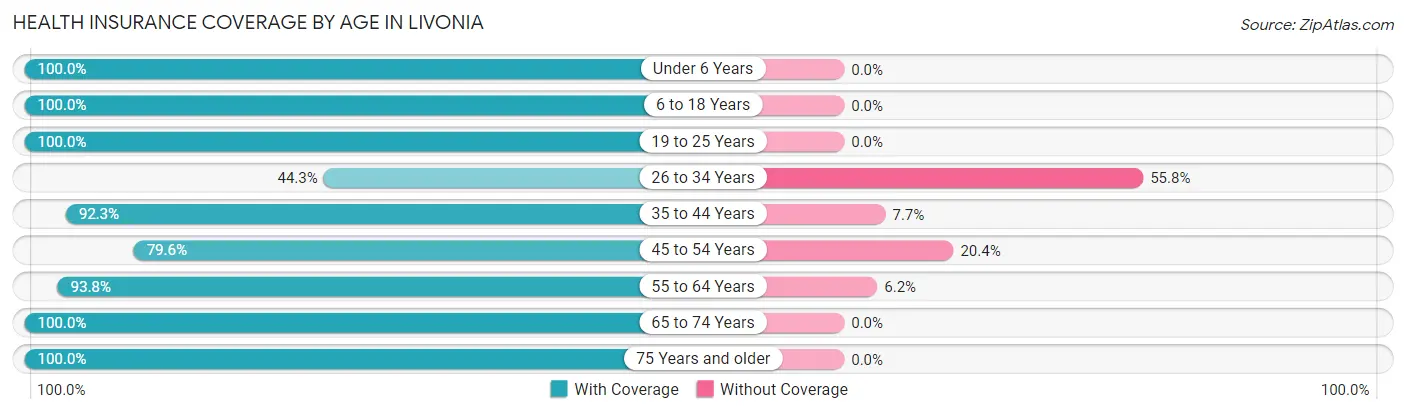
| Age Bracket | With Coverage | Without Coverage |
| Under 6 Years | 83 (100.0%) | 0 (0.0%) |
| 6 to 18 Years | 114 (100.0%) | 0 (0.0%) |
| 19 to 25 Years | 187 (100.0%) | 0 (0.0%) |
| 26 to 34 Years | 50 (44.3%) | 63 (55.7%) |
| 35 to 44 Years | 60 (92.3%) | 5 (7.7%) |
| 45 to 54 Years | 176 (79.6%) | 45 (20.4%) |
| 55 to 64 Years | 259 (93.8%) | 17 (6.2%) |
| 65 to 74 Years | 110 (100.0%) | 0 (0.0%) |
| 75 Years and older | 121 (100.0%) | 0 (0.0%) |
| Total | 1,160 (89.9%) | 130 (10.1%) |
Health Insurance Coverage by Citizenship Status in Livonia
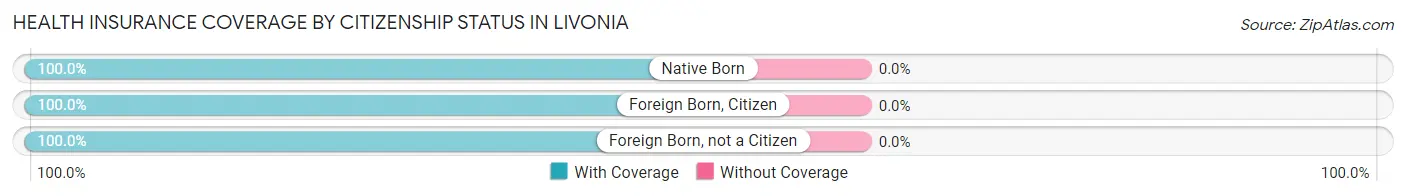
| Citizenship Status | With Coverage | Without Coverage |
| Native Born | 83 (100.0%) | 0 (0.0%) |
| Foreign Born, Citizen | 114 (100.0%) | 0 (0.0%) |
| Foreign Born, not a Citizen | 187 (100.0%) | 0 (0.0%) |
Health Insurance Coverage by Household Income in Livonia
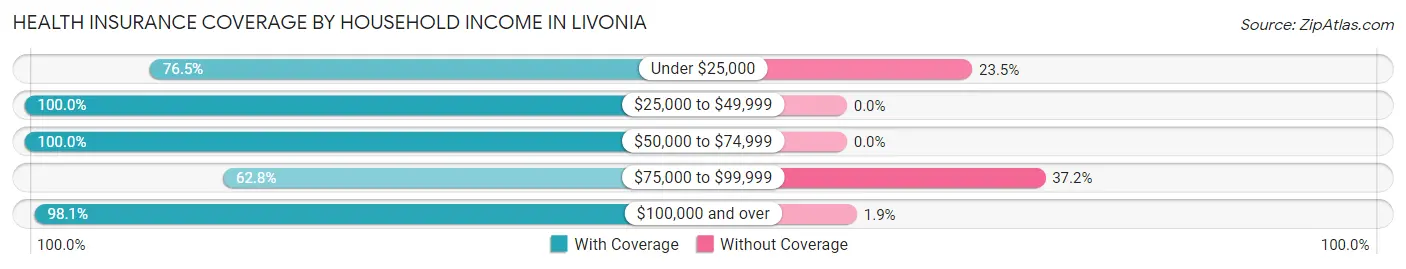
| Household Income | With Coverage | Without Coverage |
| Under $25,000 | 202 (76.5%) | 62 (23.5%) |
| $25,000 to $49,999 | 260 (100.0%) | 0 (0.0%) |
| $50,000 to $74,999 | 78 (100.0%) | 0 (0.0%) |
| $75,000 to $99,999 | 98 (62.8%) | 58 (37.2%) |
| $100,000 and over | 522 (98.1%) | 10 (1.9%) |
Public vs Private Health Insurance Coverage by Age in Livonia
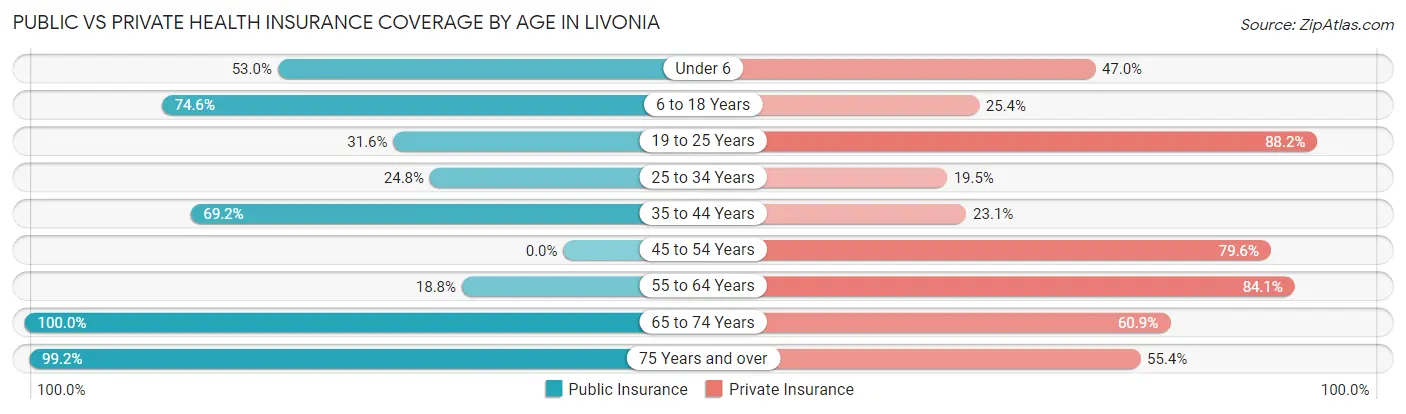
| Age Bracket | Public Insurance | Private Insurance |
| Under 6 | 44 (53.0%) | 39 (47.0%) |
| 6 to 18 Years | 85 (74.6%) | 29 (25.4%) |
| 19 to 25 Years | 59 (31.6%) | 165 (88.2%) |
| 25 to 34 Years | 28 (24.8%) | 22 (19.5%) |
| 35 to 44 Years | 45 (69.2%) | 15 (23.1%) |
| 45 to 54 Years | 0 (0.0%) | 176 (79.6%) |
| 55 to 64 Years | 52 (18.8%) | 232 (84.1%) |
| 65 to 74 Years | 110 (100.0%) | 67 (60.9%) |
| 75 Years and over | 120 (99.2%) | 67 (55.4%) |
| Total | 543 (42.1%) | 812 (62.9%) |
Disability Status by Sex by Age in Livonia
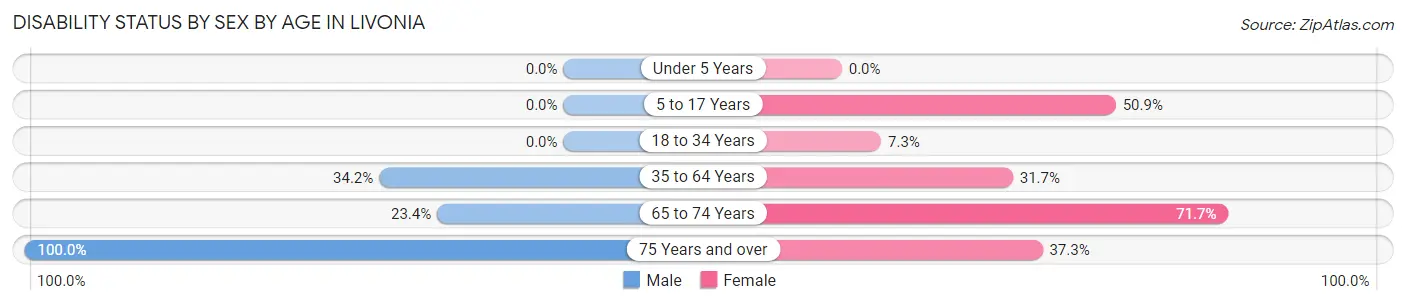
| Age Bracket | Male | Female |
| Under 5 Years | 0 (0.0%) | 0 (0.0%) |
| 5 to 17 Years | 0 (0.0%) | 30 (50.8%) |
| 18 to 34 Years | 0 (0.0%) | 13 (7.3%) |
| 35 to 64 Years | 92 (34.2%) | 93 (31.7%) |
| 65 to 74 Years | 15 (23.4%) | 33 (71.7%) |
| 75 Years and over | 19 (100.0%) | 38 (37.2%) |
Disability Class by Sex by Age in Livonia
Disability Class: Hearing Difficulty
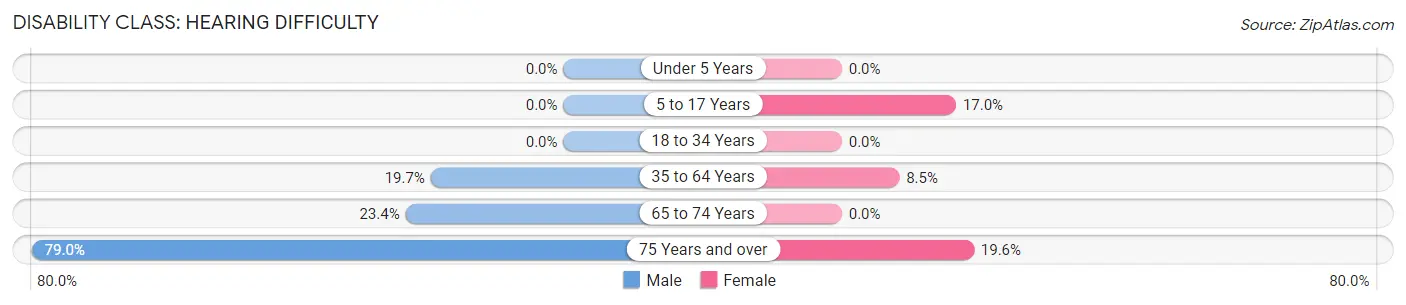
| Age Bracket | Male | Female |
| Under 5 Years | 0 (0.0%) | 0 (0.0%) |
| 5 to 17 Years | 0 (0.0%) | 10 (17.0%) |
| 18 to 34 Years | 0 (0.0%) | 0 (0.0%) |
| 35 to 64 Years | 53 (19.7%) | 25 (8.5%) |
| 65 to 74 Years | 15 (23.4%) | 0 (0.0%) |
| 75 Years and over | 15 (78.9%) | 20 (19.6%) |
Disability Class: Vision Difficulty
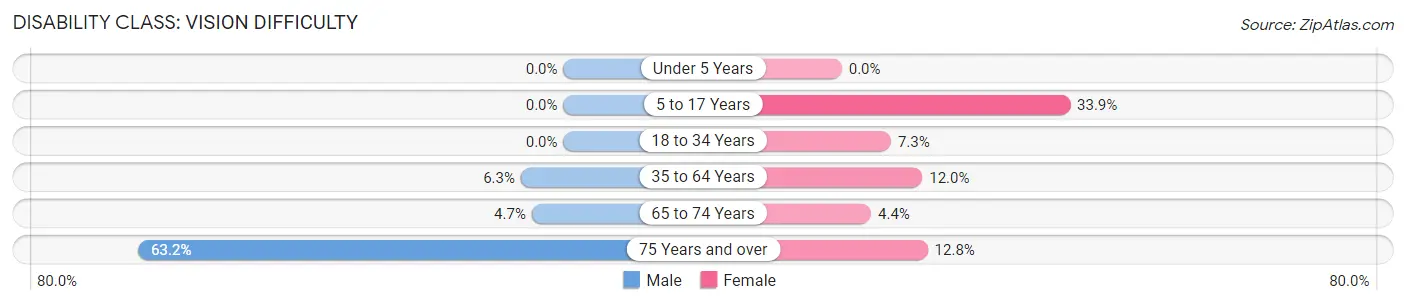
| Age Bracket | Male | Female |
| Under 5 Years | 0 (0.0%) | 0 (0.0%) |
| 5 to 17 Years | 0 (0.0%) | 20 (33.9%) |
| 18 to 34 Years | 0 (0.0%) | 13 (7.3%) |
| 35 to 64 Years | 17 (6.3%) | 35 (11.9%) |
| 65 to 74 Years | 3 (4.7%) | 2 (4.3%) |
| 75 Years and over | 12 (63.2%) | 13 (12.8%) |
Disability Class: Cognitive Difficulty
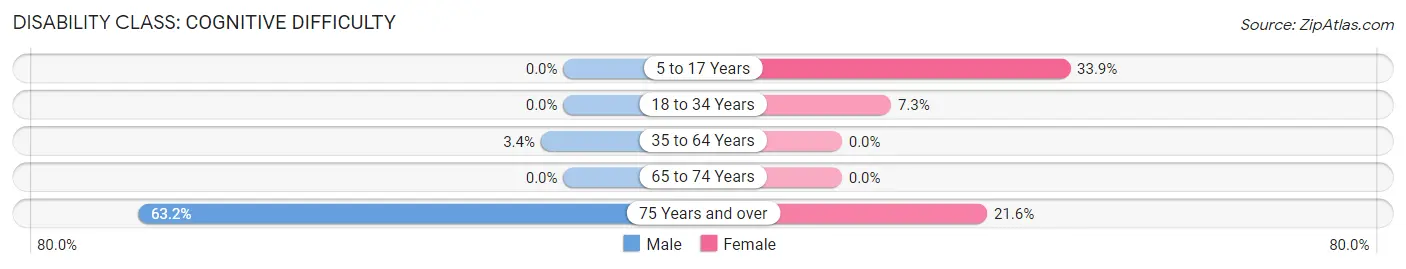
| Age Bracket | Male | Female |
| 5 to 17 Years | 0 (0.0%) | 20 (33.9%) |
| 18 to 34 Years | 0 (0.0%) | 13 (7.3%) |
| 35 to 64 Years | 9 (3.4%) | 0 (0.0%) |
| 65 to 74 Years | 0 (0.0%) | 0 (0.0%) |
| 75 Years and over | 12 (63.2%) | 22 (21.6%) |
Disability Class: Ambulatory Difficulty
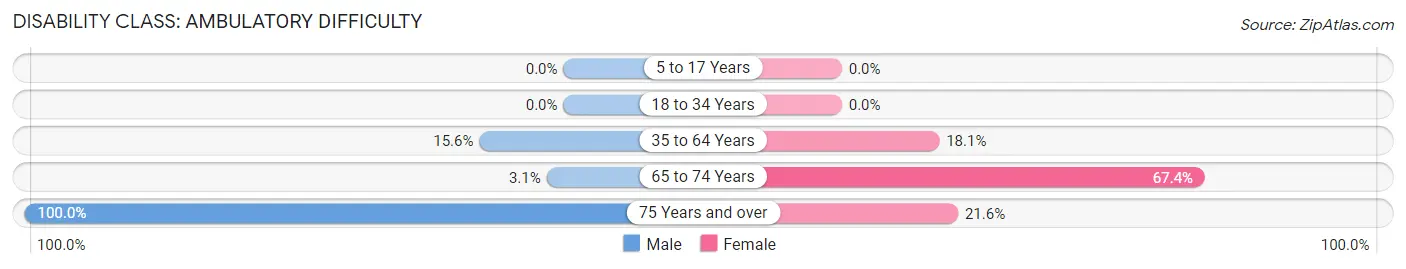
| Age Bracket | Male | Female |
| 5 to 17 Years | 0 (0.0%) | 0 (0.0%) |
| 18 to 34 Years | 0 (0.0%) | 0 (0.0%) |
| 35 to 64 Years | 42 (15.6%) | 53 (18.1%) |
| 65 to 74 Years | 2 (3.1%) | 31 (67.4%) |
| 75 Years and over | 19 (100.0%) | 22 (21.6%) |
Disability Class: Self-Care Difficulty
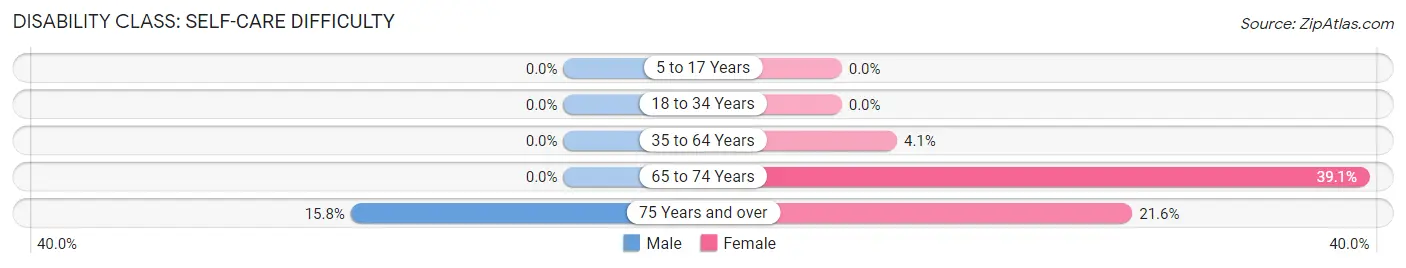
| Age Bracket | Male | Female |
| 5 to 17 Years | 0 (0.0%) | 0 (0.0%) |
| 18 to 34 Years | 0 (0.0%) | 0 (0.0%) |
| 35 to 64 Years | 0 (0.0%) | 12 (4.1%) |
| 65 to 74 Years | 0 (0.0%) | 18 (39.1%) |
| 75 Years and over | 3 (15.8%) | 22 (21.6%) |
Technology Access in Livonia
Computing Device Access in Livonia
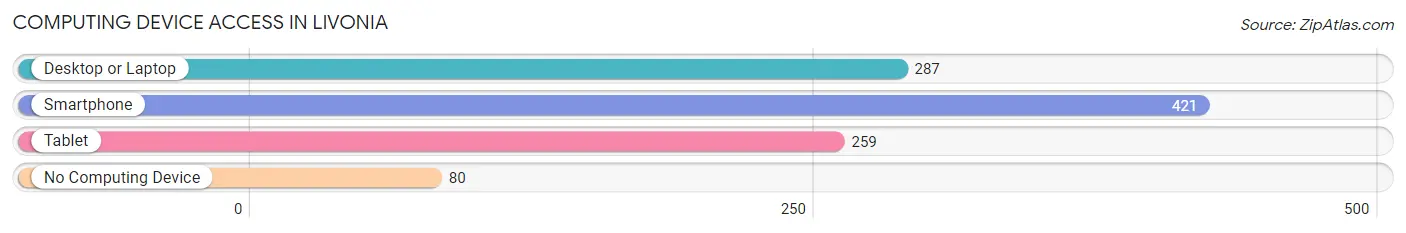
| Device Type | # Households | % Households |
| Desktop or Laptop | 287 | 55.4% |
| Smartphone | 421 | 81.3% |
| Tablet | 259 | 50.0% |
| No Computing Device | 80 | 15.4% |
| Total | 518 | 100.0% |
Internet Access in Livonia
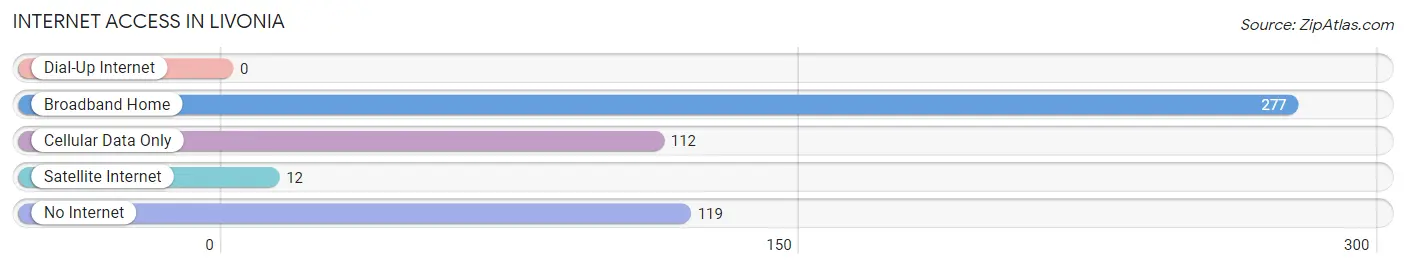
| Internet Type | # Households | % Households |
| Dial-Up Internet | 0 | 0.0% |
| Broadband Home | 277 | 53.5% |
| Cellular Data Only | 112 | 21.6% |
| Satellite Internet | 12 | 2.3% |
| No Internet | 119 | 23.0% |
| Total | 518 | 100.0% |
Livonia Summary
Livonia is a small town located in Pointe Coupee Parish, Louisiana. It is situated on the banks of the Mississippi River, approximately 25 miles northwest of Baton Rouge. The town has a population of 1,845 people, according to the 2010 census.
History
Livonia was founded in 1810 by French settlers who named it after the city of Livonia in France. The town was originally a trading post and was known as “Livonia Landing”. In 1820, the town was incorporated and the name was changed to Livonia.
In the early 19th century, Livonia was a thriving port town. It was a major stop for steamboats traveling up and down the Mississippi River. The town was also a major center for the cotton trade.
In the late 19th century, the town began to decline. The steamboat trade had shifted to other ports and the cotton industry had moved away. The town’s population decreased and many of the buildings were abandoned.
In the early 20th century, the town began to revive. The economy was bolstered by the construction of a sugar mill and the opening of a railroad line. The town’s population began to grow again and many of the abandoned buildings were restored.
Geography
Livonia is located in Pointe Coupee Parish, Louisiana. It is situated on the banks of the Mississippi River, approximately 25 miles northwest of Baton Rouge. The town is surrounded by farmland and is located near the Tunica Hills Wildlife Management Area.
The climate in Livonia is humid subtropical. The average temperature in the summer is around 90°F and the average temperature in the winter is around 50°F. The town receives an average of 54 inches of rain per year.
Economy
The economy of Livonia is largely based on agriculture. The town is surrounded by farmland and many of the residents are employed in the agricultural industry. Livonia is also home to a sugar mill, which is one of the largest employers in the area.
The town also has a small retail sector. There are several small shops and restaurants in the downtown area. Livonia also has a few small manufacturing businesses.
Demographics
According to the 2010 census, Livonia has a population of 1,845 people. The racial makeup of the town is 79.3% White, 19.2% African American, 0.2% Native American, 0.2% Asian, and 0.9% from other races.
The median household income in Livonia is $37,917. The median age of the population is 38.7 years. The town has a poverty rate of 22.3%.
Conclusion
Livonia is a small town located in Pointe Coupee Parish, Louisiana. It was founded in 1810 and was once a thriving port town. The town’s economy is largely based on agriculture and the sugar mill. The population of Livonia is 1,845 people, according to the 2010 census.
Common Questions
What is Per Capita Income in Livonia?
Per Capita income in Livonia is $29,446.
What is the Median Family Income in Livonia?
Median Family Income in Livonia is $85,994.
What is the Median Household income in Livonia?
Median Household Income in Livonia is $48,523.
What is Income or Wage Gap in Livonia?
Income or Wage Gap in Livonia is 1.6%.
Women in Livonia earn 98.4 cents for every dollar earned by a man.
What is Family Income Deficit in Livonia?
Family Income Deficit in Livonia is $9,844.
Families that are below poverty line in Livonia earn $9,844 less on average than the poverty threshold level.
What is Inequality or Gini Index in Livonia?
Inequality or Gini Index in Livonia is 0.50.
What is the Total Population of Livonia?
Total Population of Livonia is 1,290.
What is the Total Male Population of Livonia?
Total Male Population of Livonia is 584.
What is the Total Female Population of Livonia?
Total Female Population of Livonia is 706.
What is the Ratio of Males per 100 Females in Livonia?
There are 82.72 Males per 100 Females in Livonia.
What is the Ratio of Females per 100 Males in Livonia?
There are 120.89 Females per 100 Males in Livonia.
What is the Median Population Age in Livonia?
Median Population Age in Livonia is 49.7 Years.
What is the Average Family Size in Livonia
Average Family Size in Livonia is 3.1 People.
What is the Average Household Size in Livonia
Average Household Size in Livonia is 2.5 People.
How Large is the Labor Force in Livonia?
There are 546 People in the Labor Forcein in Livonia.
What is the Percentage of People in the Labor Force in Livonia?
49.3% of People are in the Labor Force in Livonia.
What is the Unemployment Rate in Livonia?
Unemployment Rate in Livonia is 1.5%.