St Maurice, LA Map & Demographics
St Maurice Map
St Maurice Overview
$15,839
PER CAPITA INCOME
$23,867
AVG FAMILY INCOME
0.55
INEQUALITY / GINI INDEX
330
TOTAL POPULATION
130
MALE POPULATION
200
FEMALE POPULATION
65.00
MALES / 100 FEMALES
153.85
FEMALES / 100 MALES
45.8
MEDIAN AGE
3.4
AVG FAMILY SIZE
3.8
AVG HOUSEHOLD SIZE
36
LABOR FORCE [ PEOPLE ]
14.8%
PERCENT IN LABOR FORCE
Income in St Maurice
Income Overview in St Maurice
| Characteristic | Number | Measure |
| Per Capita Income | 330 | $15,839 |
| Median Family Income | 77 | $23,867 |
| Mean Family Income | 77 | $58,145 |
| Median Household Income | 88 | $0 |
| Mean Household Income | 88 | $56,709 |
| Income Deficit | 77 | $0 |
| Wage / Income Gap (%) | 330 | 0.00% |
| Wage / Income Gap ($) | 330 | 100.00¢ per $1 |
| Gini / Inequality Index | 330 | 0.55 |
Earnings by Sex in St Maurice
| Sex | Number | Average Earnings |
| Male | 23 (63.9%) | $0 |
| Female | 13 (36.1%) | $0 |
| Total | 36 (100.0%) | $0 |
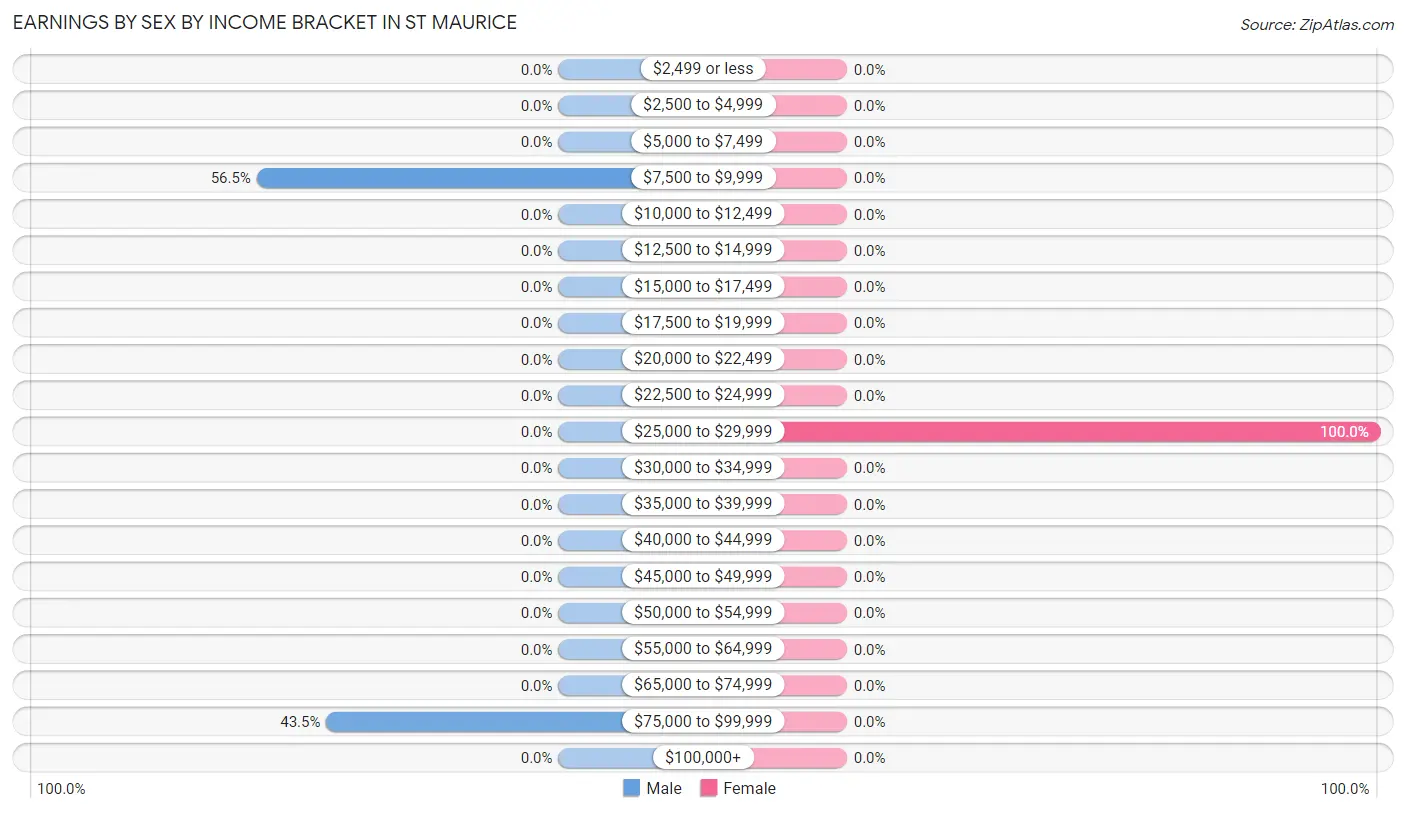
Earnings by Sex by Income Bracket in St Maurice
The most common earnings brackets in St Maurice are $7,500 to $9,999 for men (13 | 56.5%) and $25,000 to $29,999 for women (13 | 100.0%).
| Income | Male | Female |
| $2,499 or less | 0 (0.0%) | 0 (0.0%) |
| $2,500 to $4,999 | 0 (0.0%) | 0 (0.0%) |
| $5,000 to $7,499 | 0 (0.0%) | 0 (0.0%) |
| $7,500 to $9,999 | 13 (56.5%) | 0 (0.0%) |
| $10,000 to $12,499 | 0 (0.0%) | 0 (0.0%) |
| $12,500 to $14,999 | 0 (0.0%) | 0 (0.0%) |
| $15,000 to $17,499 | 0 (0.0%) | 0 (0.0%) |
| $17,500 to $19,999 | 0 (0.0%) | 0 (0.0%) |
| $20,000 to $22,499 | 0 (0.0%) | 0 (0.0%) |
| $22,500 to $24,999 | 0 (0.0%) | 0 (0.0%) |
| $25,000 to $29,999 | 0 (0.0%) | 13 (100.0%) |
| $30,000 to $34,999 | 0 (0.0%) | 0 (0.0%) |
| $35,000 to $39,999 | 0 (0.0%) | 0 (0.0%) |
| $40,000 to $44,999 | 0 (0.0%) | 0 (0.0%) |
| $45,000 to $49,999 | 0 (0.0%) | 0 (0.0%) |
| $50,000 to $54,999 | 0 (0.0%) | 0 (0.0%) |
| $55,000 to $64,999 | 0 (0.0%) | 0 (0.0%) |
| $65,000 to $74,999 | 0 (0.0%) | 0 (0.0%) |
| $75,000 to $99,999 | 10 (43.5%) | 0 (0.0%) |
| $100,000+ | 0 (0.0%) | 0 (0.0%) |
| Total | 23 (100.0%) | 13 (100.0%) |
Earnings by Sex by Educational Attainment in St Maurice
| Educational Attainment | Male Income | Female Income |
| Less than High School | - | - |
| High School Diploma | - | - |
| College or Associate's Degree | - | - |
| Bachelor's Degree | - | - |
| Graduate Degree | - | - |
| Total | - | - |
Family Income in St Maurice
Family Income Brackets in St Maurice
According to the St Maurice family income data, there are 32 families falling into the $15,000 to $24,999 income range, which is the most common income bracket and makes up 41.6% of all families.
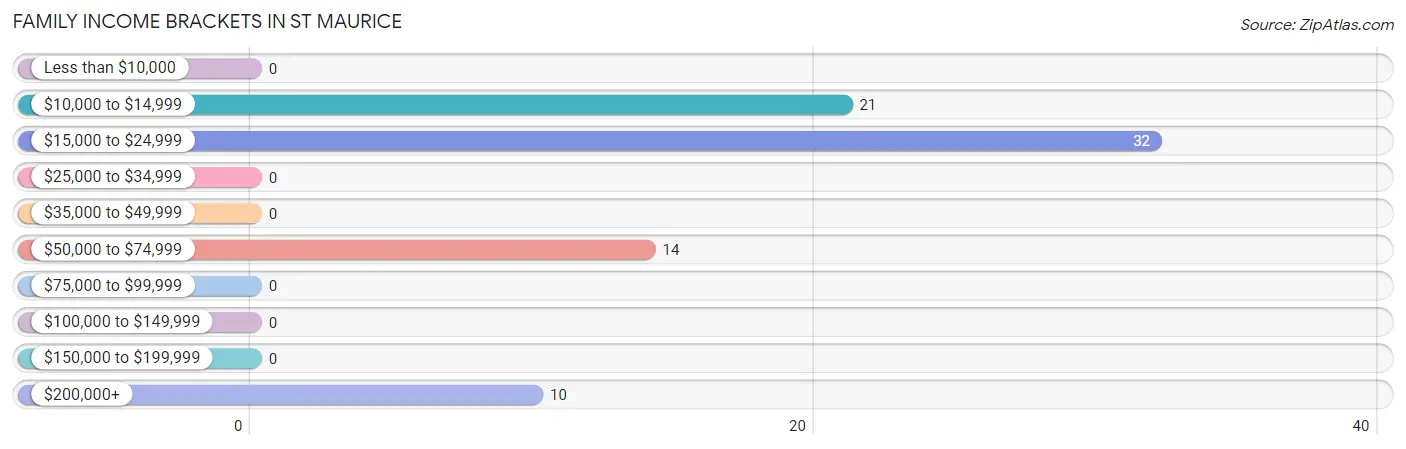
| Income Bracket | # Families | % Families |
| Less than $10,000 | 0 | 0.0% |
| $10,000 to $14,999 | 21 | 27.3% |
| $15,000 to $24,999 | 32 | 41.6% |
| $25,000 to $34,999 | 0 | 0.0% |
| $35,000 to $49,999 | 0 | 0.0% |
| $50,000 to $74,999 | 14 | 18.2% |
| $75,000 to $99,999 | 0 | 0.0% |
| $100,000 to $149,999 | 0 | 0.0% |
| $150,000 to $199,999 | 0 | 0.0% |
| $200,000+ | 10 | 13.0% |
Family Income by Famaliy Size in St Maurice
| Income Bracket | # Families | Median Income |
| 2-Person Families | 15 (19.5%) | $0 |
| 3-Person Families | 46 (59.7%) | $0 |
| 4-Person Families | 16 (20.8%) | $0 |
| 5-Person Families | 0 (0.0%) | $0 |
| 6-Person Families | 0 (0.0%) | $0 |
| 7+ Person Families | 0 (0.0%) | $0 |
| Total | 77 (100.0%) | $23,867 |
Family Income by Number of Earners in St Maurice
| Number of Earners | # Families | Median Income |
| No Earners | 35 (45.5%) | $0 |
| 1 Earner | 42 (54.5%) | $0 |
| 2 Earners | 0 (0.0%) | $0 |
| 3+ Earners | 0 (0.0%) | $0 |
| Total | 77 (100.0%) | $23,867 |
Household Income in St Maurice
Household Income Brackets in St Maurice
With 32 households falling in the category, the $15,000 to $24,999 income range is the most frequent in St Maurice, accounting for 36.4% of all households.
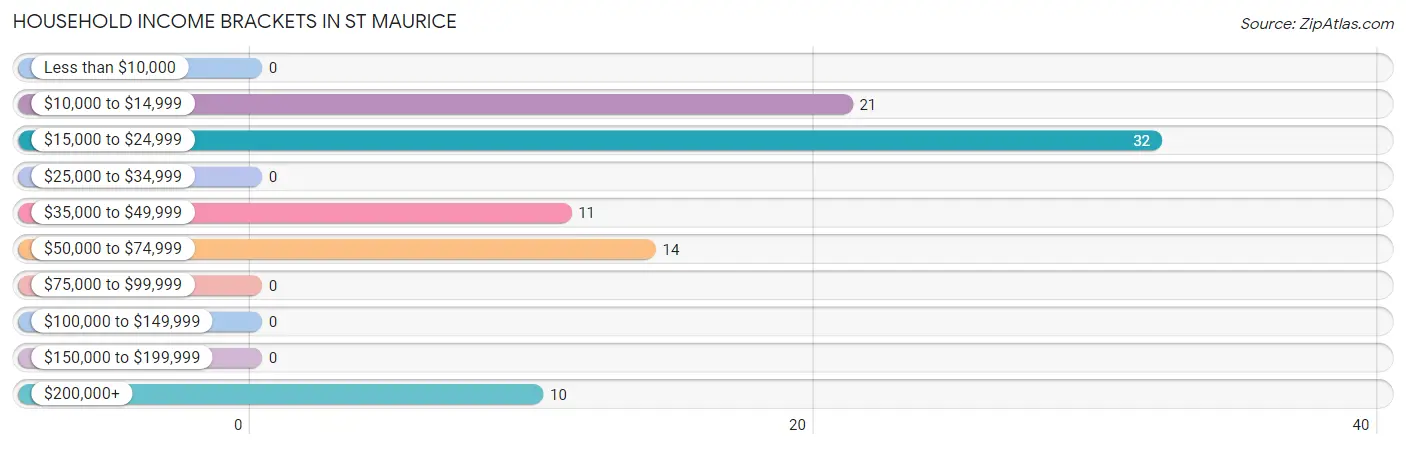
| Income Bracket | # Households | % Households |
| Less than $10,000 | 0 | 0.0% |
| $10,000 to $14,999 | 21 | 23.9% |
| $15,000 to $24,999 | 32 | 36.4% |
| $25,000 to $34,999 | 0 | 0.0% |
| $35,000 to $49,999 | 11 | 12.5% |
| $50,000 to $74,999 | 14 | 15.9% |
| $75,000 to $99,999 | 0 | 0.0% |
| $100,000 to $149,999 | 0 | 0.0% |
| $150,000 to $199,999 | 0 | 0.0% |
| $200,000+ | 10 | 11.4% |
Household Income by Householder Age in St Maurice
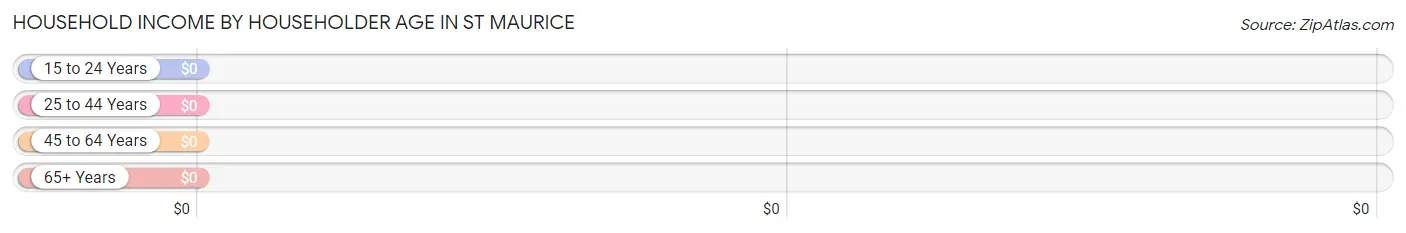
| Income Bracket | # Households | Median Income |
| 15 to 24 Years | 0 (0.0%) | $0 |
| 25 to 44 Years | 0 (0.0%) | $0 |
| 45 to 64 Years | 48 (54.5%) | $0 |
| 65+ Years | 40 (45.5%) | $0 |
| Total | 88 (100.0%) | $0 |
Poverty in St Maurice
Income Below Poverty by Sex and Age in St Maurice
With 36.8% poverty level for males and 52.6% for females among the residents of St Maurice, 15 year old males and 12 to 14 year old females are the most vulnerable to poverty, with 26 males (100.0%) and 17 females (100.0%) in their respective age groups living below the poverty level.
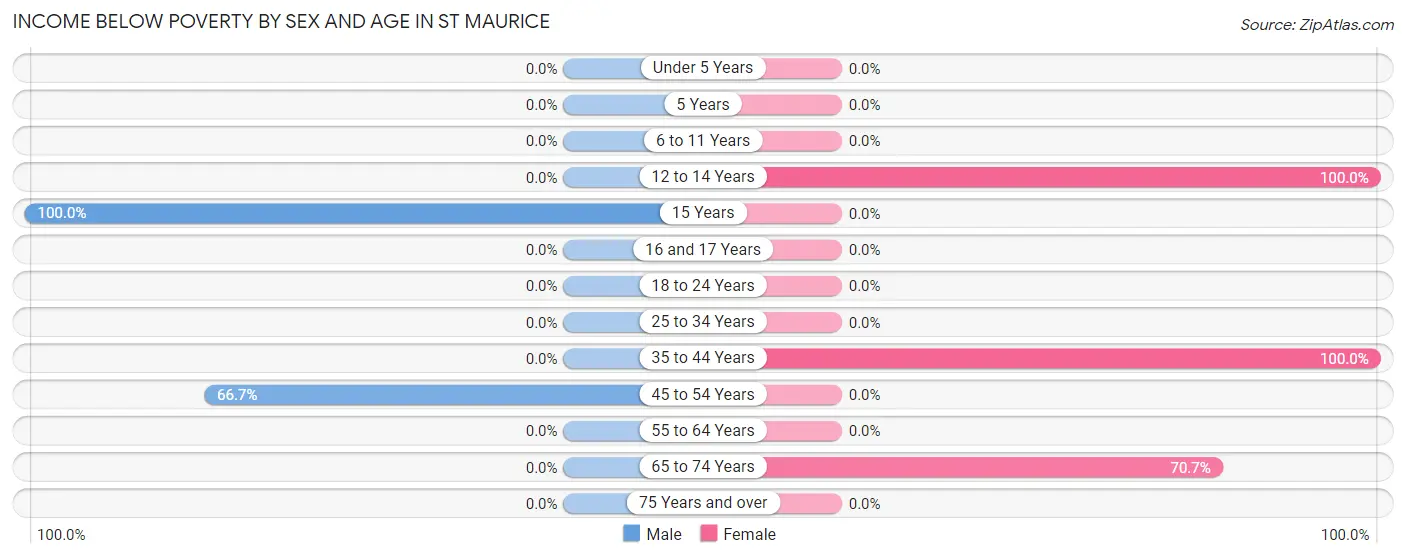
| Age Bracket | Male | Female |
| Under 5 Years | 0 (0.0%) | 0 (0.0%) |
| 5 Years | 0 (0.0%) | 0 (0.0%) |
| 6 to 11 Years | 0 (0.0%) | 0 (0.0%) |
| 12 to 14 Years | 0 (0.0%) | 17 (100.0%) |
| 15 Years | 26 (100.0%) | 0 (0.0%) |
| 16 and 17 Years | 0 (0.0%) | 0 (0.0%) |
| 18 to 24 Years | 0 (0.0%) | 0 (0.0%) |
| 25 to 34 Years | 0 (0.0%) | 0 (0.0%) |
| 35 to 44 Years | 0 (0.0%) | 21 (100.0%) |
| 45 to 54 Years | 16 (66.7%) | 0 (0.0%) |
| 55 to 64 Years | 0 (0.0%) | 0 (0.0%) |
| 65 to 74 Years | 0 (0.0%) | 53 (70.7%) |
| 75 Years and over | 0 (0.0%) | 0 (0.0%) |
| Total | 42 (36.8%) | 91 (52.6%) |
Income Above Poverty by Sex and Age in St Maurice
According to the poverty statistics in St Maurice, males aged 35 to 44 years and females aged 18 to 24 years are the age groups that are most secure financially, with 100.0% of males and 100.0% of females in these age groups living above the poverty line.
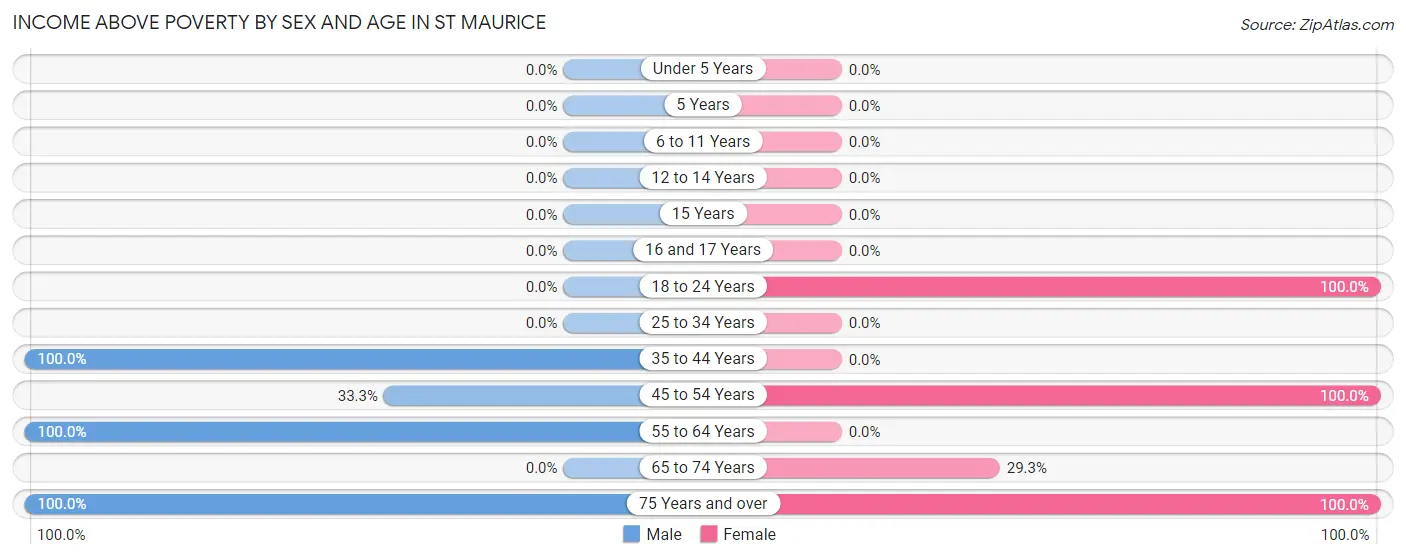
| Age Bracket | Male | Female |
| Under 5 Years | 0 (0.0%) | 0 (0.0%) |
| 5 Years | 0 (0.0%) | 0 (0.0%) |
| 6 to 11 Years | 0 (0.0%) | 0 (0.0%) |
| 12 to 14 Years | 0 (0.0%) | 0 (0.0%) |
| 15 Years | 0 (0.0%) | 0 (0.0%) |
| 16 and 17 Years | 0 (0.0%) | 0 (0.0%) |
| 18 to 24 Years | 0 (0.0%) | 33 (100.0%) |
| 25 to 34 Years | 0 (0.0%) | 0 (0.0%) |
| 35 to 44 Years | 13 (100.0%) | 0 (0.0%) |
| 45 to 54 Years | 8 (33.3%) | 13 (100.0%) |
| 55 to 64 Years | 32 (100.0%) | 0 (0.0%) |
| 65 to 74 Years | 0 (0.0%) | 22 (29.3%) |
| 75 Years and over | 19 (100.0%) | 14 (100.0%) |
| Total | 72 (63.2%) | 82 (47.4%) |
Income Below Poverty Among Married-Couple Families in St Maurice
The poverty statistics for married-couple families in St Maurice show that 40.0% or 16 of the total 40 families live below the poverty line. Families with 1 or 2 children have the highest poverty rate of 100.0%, comprising of 16 families. On the other hand, families with no children have the lowest poverty rate of 0.0%, which includes 0 families.
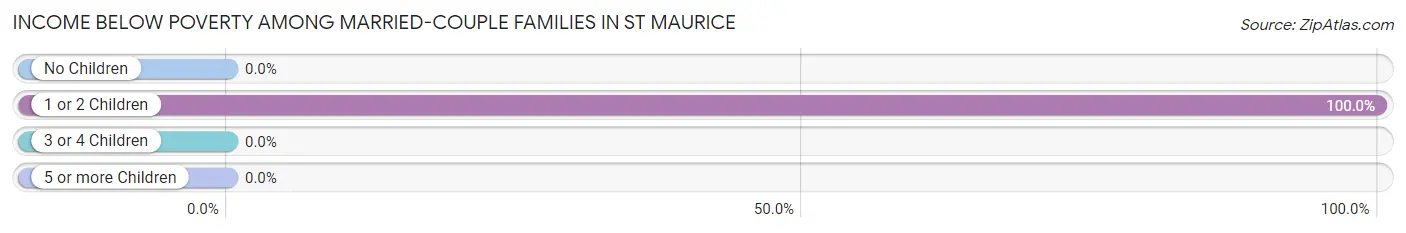
| Children | Above Poverty | Below Poverty |
| No Children | 24 (100.0%) | 0 (0.0%) |
| 1 or 2 Children | 0 (0.0%) | 16 (100.0%) |
| 3 or 4 Children | 0 (0.0%) | 0 (0.0%) |
| 5 or more Children | 0 (0.0%) | 0 (0.0%) |
| Total | 24 (60.0%) | 16 (40.0%) |
Income Below Poverty Among Single-Parent Households in St Maurice
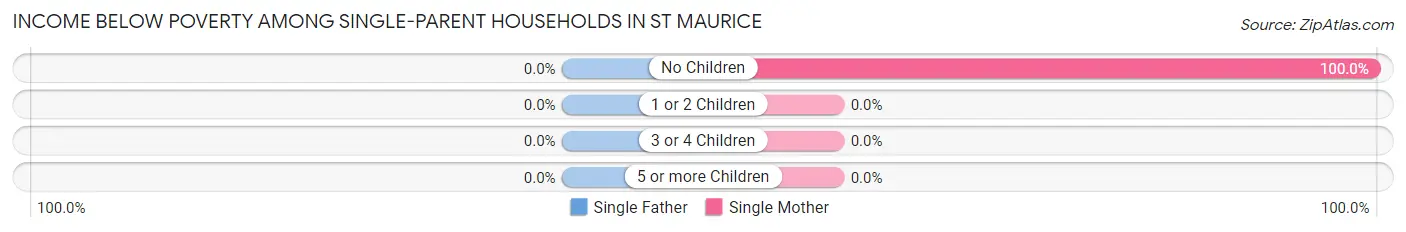
| Children | Single Father | Single Mother |
| No Children | 0 (0.0%) | 5 (100.0%) |
| 1 or 2 Children | 0 (0.0%) | 0 (0.0%) |
| 3 or 4 Children | 0 (0.0%) | 0 (0.0%) |
| 5 or more Children | 0 (0.0%) | 0 (0.0%) |
| Total | 0 (0.0%) | 5 (100.0%) |
Income Below Poverty Among Married-Couple vs Single-Parent Households in St Maurice
The poverty data for St Maurice shows that 16 of the married-couple family households (40.0%) and 5 of the single-parent households (13.5%) are living below the poverty level. Within the married-couple family households, those with 1 or 2 children have the highest poverty rate, with 16 households (100.0%) falling below the poverty line. Among the single-parent households, those with no children have the highest poverty rate, with 5 household (13.5%) living below poverty.
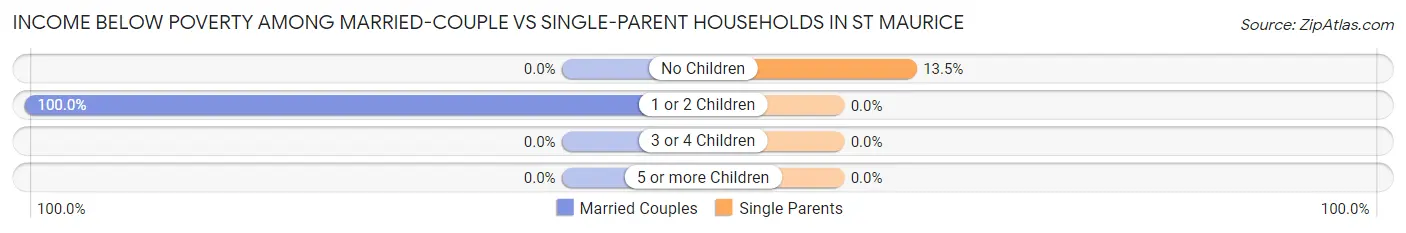
| Children | Married-Couple Families | Single-Parent Households |
| No Children | 0 (0.0%) | 5 (13.5%) |
| 1 or 2 Children | 16 (100.0%) | 0 (0.0%) |
| 3 or 4 Children | 0 (0.0%) | 0 (0.0%) |
| 5 or more Children | 0 (0.0%) | 0 (0.0%) |
| Total | 16 (40.0%) | 5 (13.5%) |
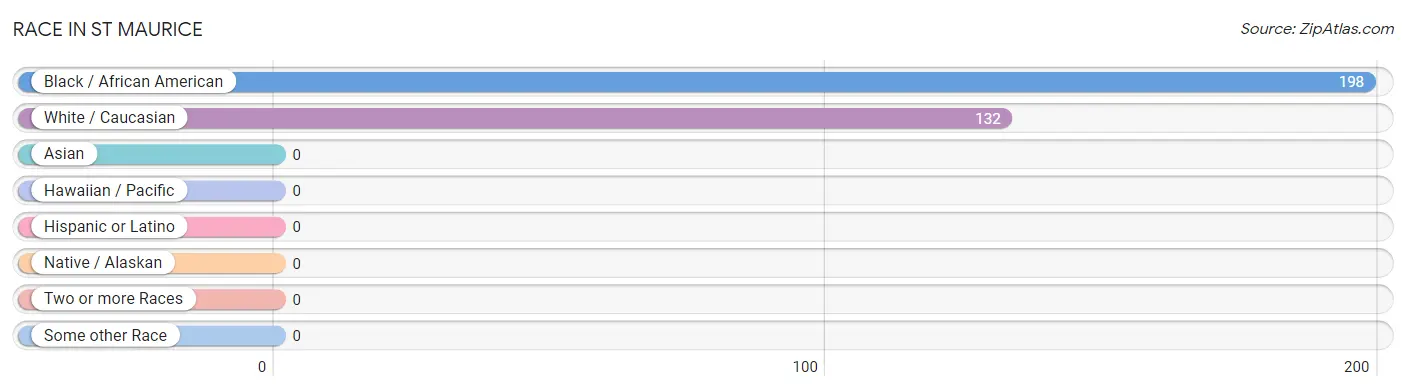
Race in St Maurice
The most populous races in St Maurice are Black / African American (198 | 60.0%), and White / Caucasian (132 | 40.0%).
| Race | # Population | % Population |
| Asian | 0 | 0.0% |
| Black / African American | 198 | 60.0% |
| Hawaiian / Pacific | 0 | 0.0% |
| Hispanic or Latino | 0 | 0.0% |
| Native / Alaskan | 0 | 0.0% |
| White / Caucasian | 132 | 40.0% |
| Two or more Races | 0 | 0.0% |
| Some other Race | 0 | 0.0% |
| Total | 330 | 100.0% |
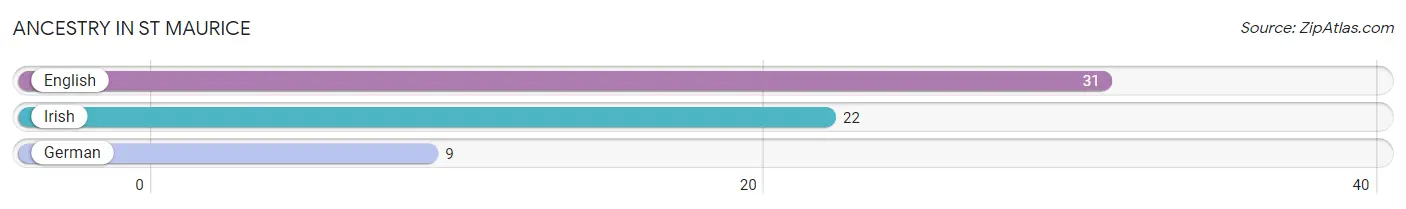
Ancestry in St Maurice
The most populous ancestries reported in St Maurice are English (31 | 9.4%), Irish (22 | 6.7%), and German (9 | 2.7%), together accounting for 18.8% of all St Maurice residents.
| Ancestry | # Population | % Population |
| English | 31 | 9.4% |
| German | 9 | 2.7% |
| Irish | 22 | 6.7% | View All 3 Rows |
Immigrants in St Maurice

| Immigration Origin | # Population | % Population | View All 0 Rows |
Sex and Age in St Maurice
Sex and Age in St Maurice
The most populous age groups in St Maurice are 60 to 64 Years (32 | 24.6%) for men and 65 to 69 Years (53 | 26.5%) for women.
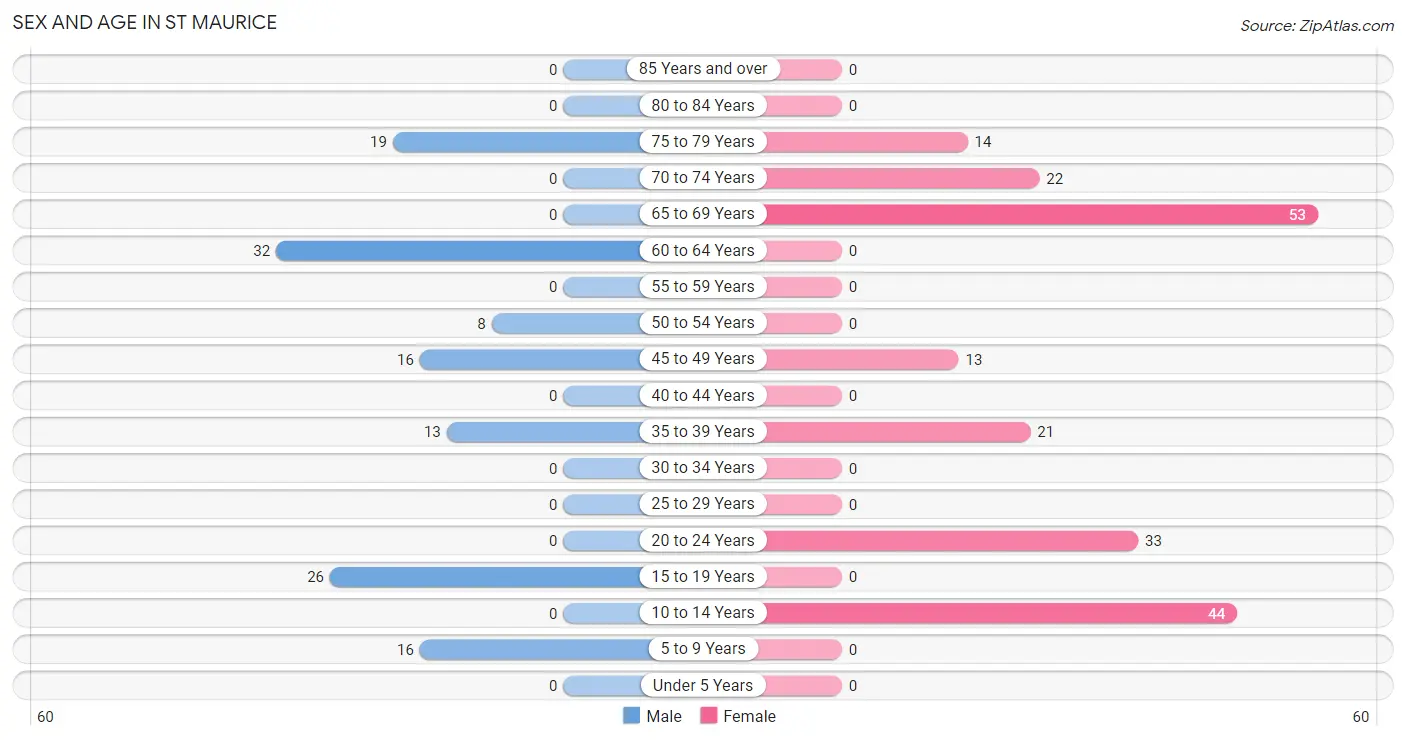
| Age Bracket | Male | Female |
| Under 5 Years | 0 (0.0%) | 0 (0.0%) |
| 5 to 9 Years | 16 (12.3%) | 0 (0.0%) |
| 10 to 14 Years | 0 (0.0%) | 44 (22.0%) |
| 15 to 19 Years | 26 (20.0%) | 0 (0.0%) |
| 20 to 24 Years | 0 (0.0%) | 33 (16.5%) |
| 25 to 29 Years | 0 (0.0%) | 0 (0.0%) |
| 30 to 34 Years | 0 (0.0%) | 0 (0.0%) |
| 35 to 39 Years | 13 (10.0%) | 21 (10.5%) |
| 40 to 44 Years | 0 (0.0%) | 0 (0.0%) |
| 45 to 49 Years | 16 (12.3%) | 13 (6.5%) |
| 50 to 54 Years | 8 (6.1%) | 0 (0.0%) |
| 55 to 59 Years | 0 (0.0%) | 0 (0.0%) |
| 60 to 64 Years | 32 (24.6%) | 0 (0.0%) |
| 65 to 69 Years | 0 (0.0%) | 53 (26.5%) |
| 70 to 74 Years | 0 (0.0%) | 22 (11.0%) |
| 75 to 79 Years | 19 (14.6%) | 14 (7.0%) |
| 80 to 84 Years | 0 (0.0%) | 0 (0.0%) |
| 85 Years and over | 0 (0.0%) | 0 (0.0%) |
| Total | 130 (100.0%) | 200 (100.0%) |
Families and Households in St Maurice
Median Family Size in St Maurice
The median family size in St Maurice is 3.42 persons per family, with single female/mother families (5 | 6.5%) accounting for the largest median family size of 10.6 persons per family. On the other hand, single male/father families (32 | 41.6%) represent the smallest median family size with 2.44 persons per family.
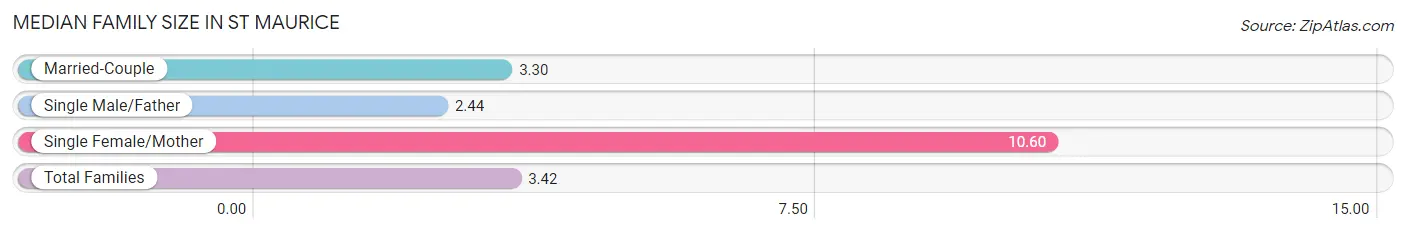
| Family Type | # Families | Family Size |
| Married-Couple | 40 (51.9%) | 3.30 |
| Single Male/Father | 32 (41.6%) | 2.44 |
| Single Female/Mother | 5 (6.5%) | 10.60 |
| Total Families | 77 (100.0%) | 3.42 |
Median Household Size in St Maurice
The median household size in St Maurice is 3.75 persons per household, with single female/mother households (5 | 5.7%) accounting for the largest median household size of 10.6 persons per household. single male/father households (32 | 36.4%) represent the smallest median household size with 2.44 persons per household.
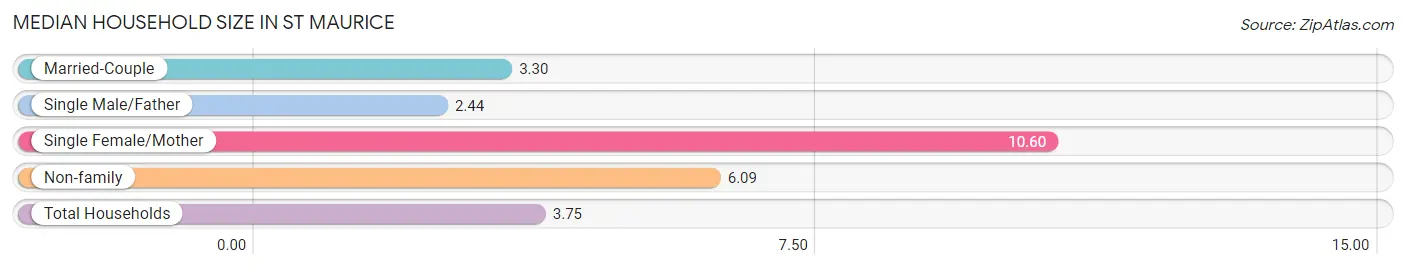
| Household Type | # Households | Household Size |
| Married-Couple | 40 (45.5%) | 3.30 |
| Single Male/Father | 32 (36.4%) | 2.44 |
| Single Female/Mother | 5 (5.7%) | 10.60 |
| Non-family | 11 (12.5%) | 6.09 |
| Total Households | 88 (100.0%) | 3.75 |
Household Size by Marriage Status in St Maurice
Out of a total of 88 households in St Maurice, 77 (87.5%) are family households, while 11 (12.5%) are nonfamily households. The most numerous type of family households are 3-person households, comprising 46, and the most common type of nonfamily households are 4-person households, comprising 11.
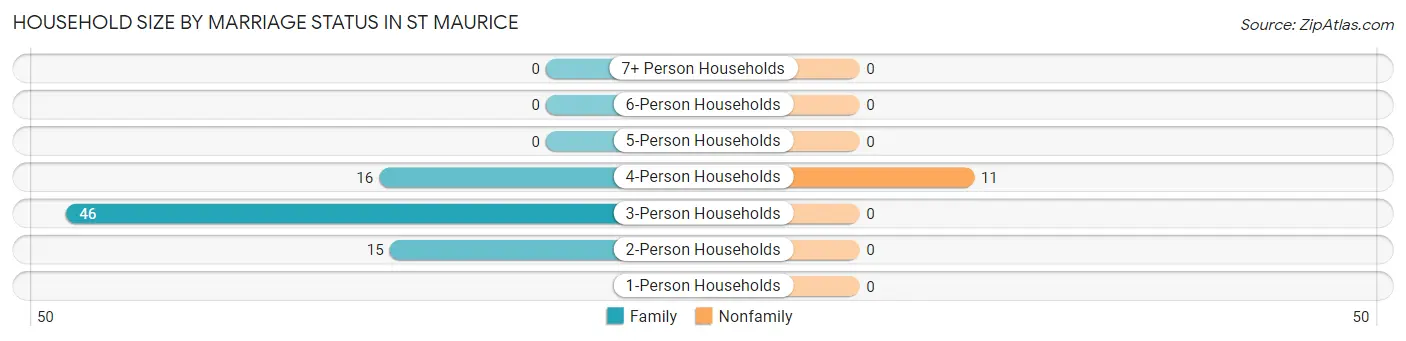
| Household Size | Family Households | Nonfamily Households |
| 1-Person Households | - | 0 (0.0%) |
| 2-Person Households | 15 (17.1%) | 0 (0.0%) |
| 3-Person Households | 46 (52.3%) | 0 (0.0%) |
| 4-Person Households | 16 (18.2%) | 11 (12.5%) |
| 5-Person Households | 0 (0.0%) | 0 (0.0%) |
| 6-Person Households | 0 (0.0%) | 0 (0.0%) |
| 7+ Person Households | 0 (0.0%) | 0 (0.0%) |
| Total | 77 (87.5%) | 11 (12.5%) |
Female Fertility in St Maurice
Fertility by Age in St Maurice
| Age Bracket | Women with Births | Births / 1,000 Women |
| 15 to 19 years | 0 (0.0%) | 0.0 |
| 20 to 34 years | 0 (0.0%) | 0.0 |
| 35 to 50 years | 0 (0.0%) | 0.0 |
| Total | 0 (0.0%) | 0.0 |
Fertility by Age by Marriage Status in St Maurice
| Age Bracket | Married | Unmarried |
| 15 to 19 years | 0 (0.0%) | 0 (0.0%) |
| 20 to 34 years | 0 (0.0%) | 0 (0.0%) |
| 35 to 50 years | 0 (0.0%) | 0 (0.0%) |
| Total | 0 (0.0%) | 0 (0.0%) |
Fertility by Education in St Maurice
| Educational Attainment | Women with Births | Births / 1,000 Women |
| Less than High School | 0 (0.0%) | 0.0 |
| High School Diploma | 0 (0.0%) | 0.0 |
| College or Associate's Degree | 0 (0.0%) | 0.0 |
| Bachelor's Degree | 0 (0.0%) | 0.0 |
| Graduate Degree | 0 (0.0%) | 0.0 |
| Total | 0 (0.0%) | 0.0 |
Fertility by Education by Marriage Status in St Maurice
| Educational Attainment | Married | Unmarried |
| Less than High School | 0 (0.0%) | 0 (0.0%) |
| High School Diploma | 0 (0.0%) | 0 (0.0%) |
| College or Associate's Degree | 0 (0.0%) | 0 (0.0%) |
| Bachelor's Degree | 0 (0.0%) | 0 (0.0%) |
| Graduate Degree | 0 (0.0%) | 0 (0.0%) |
| Total | 0 (0.0%) | 0 (0.0%) |
Employment Characteristics in St Maurice
Employment by Class of Employer in St Maurice
Among the 36 employed individuals in St Maurice, private company employees (26 | 72.2%), and unpaid family workers (10 | 27.8%) make up the most common classes of employment.
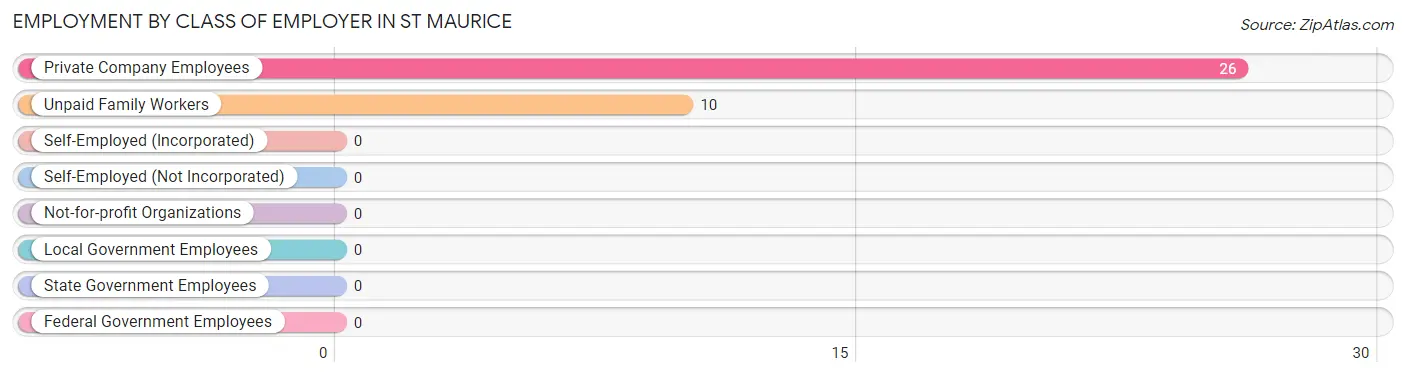
| Employer Class | # Employees | % Employees |
| Private Company Employees | 26 | 72.2% |
| Self-Employed (Incorporated) | 0 | 0.0% |
| Self-Employed (Not Incorporated) | 0 | 0.0% |
| Not-for-profit Organizations | 0 | 0.0% |
| Local Government Employees | 0 | 0.0% |
| State Government Employees | 0 | 0.0% |
| Federal Government Employees | 0 | 0.0% |
| Unpaid Family Workers | 10 | 27.8% |
| Total | 36 | 100.0% |
Employment Status by Age in St Maurice
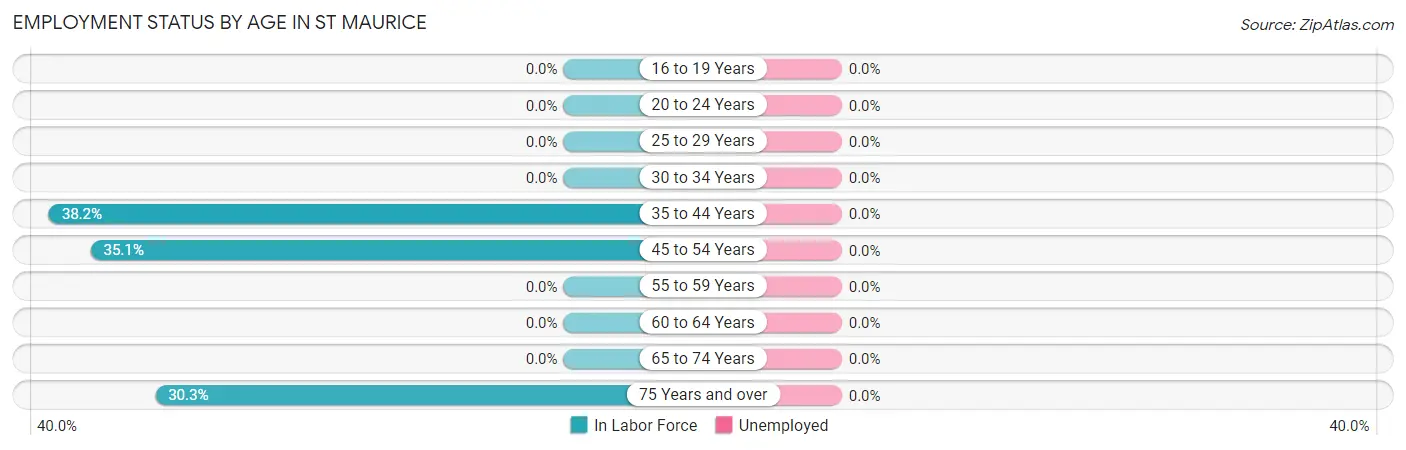
| Age Bracket | In Labor Force | Unemployed |
| 16 to 19 Years | 0 (0.0%) | 0 (0.0%) |
| 20 to 24 Years | 0 (0.0%) | 0 (0.0%) |
| 25 to 29 Years | 0 (0.0%) | 0 (0.0%) |
| 30 to 34 Years | 0 (0.0%) | 0 (0.0%) |
| 35 to 44 Years | 13 (38.2%) | 0 (0.0%) |
| 45 to 54 Years | 13 (35.1%) | 0 (0.0%) |
| 55 to 59 Years | 0 (0.0%) | 0 (0.0%) |
| 60 to 64 Years | 0 (0.0%) | 0 (0.0%) |
| 65 to 74 Years | 0 (0.0%) | 0 (0.0%) |
| 75 Years and over | 10 (30.3%) | 0 (0.0%) |
| Total | 36 (14.8%) | 0 (0.0%) |
Employment Status by Educational Attainment in St Maurice
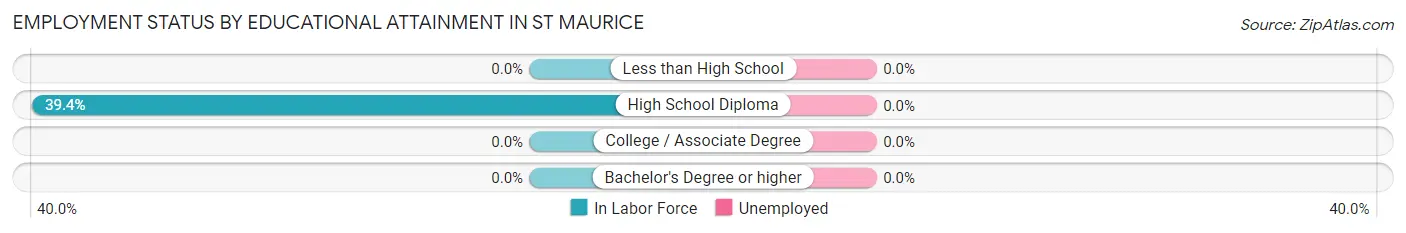
| Educational Attainment | In Labor Force | Unemployed |
| Less than High School | 0 (0.0%) | 0 (0.0%) |
| High School Diploma | 26 (39.4%) | 0 (0.0%) |
| College / Associate Degree | 0 (0.0%) | 0 (0.0%) |
| Bachelor's Degree or higher | 0 (0.0%) | 0 (0.0%) |
| Total | 26 (25.2%) | 0 (0.0%) |
Employment Occupations by Sex in St Maurice
Management, Business, Science and Arts Occupations
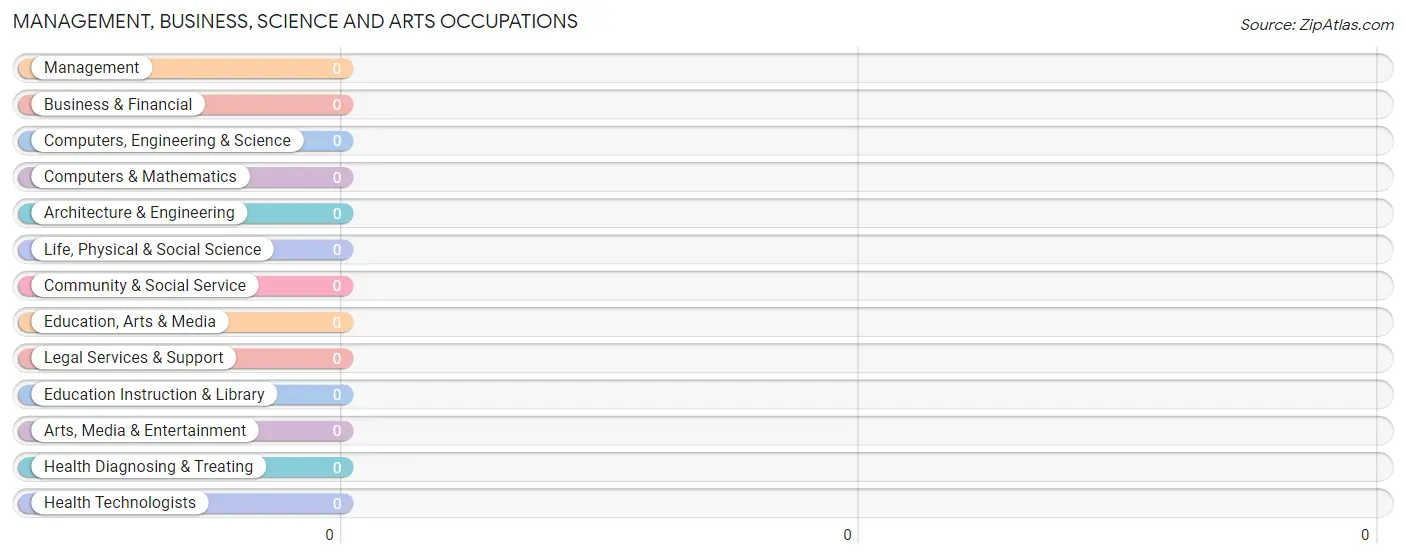
Management, Business, Science and Arts Occupations by Sex
| Occupation | Male | Female |
| Management | 0 (0.0%) | 0 (0.0%) |
| Business & Financial | 0 (0.0%) | 0 (0.0%) |
| Computers, Engineering & Science | 0 (0.0%) | 0 (0.0%) |
| Computers & Mathematics | 0 (0.0%) | 0 (0.0%) |
| Architecture & Engineering | 0 (0.0%) | 0 (0.0%) |
| Life, Physical & Social Science | 0 (0.0%) | 0 (0.0%) |
| Community & Social Service | 0 (0.0%) | 0 (0.0%) |
| Education, Arts & Media | 0 (0.0%) | 0 (0.0%) |
| Legal Services & Support | 0 (0.0%) | 0 (0.0%) |
| Education Instruction & Library | 0 (0.0%) | 0 (0.0%) |
| Arts, Media & Entertainment | 0 (0.0%) | 0 (0.0%) |
| Health Diagnosing & Treating | 0 (0.0%) | 0 (0.0%) |
| Health Technologists | 0 (0.0%) | 0 (0.0%) |
| Total (Category) | 0 (0.0%) | 0 (0.0%) |
| Total (Overall) | 23 (63.9%) | 13 (36.1%) |
Services Occupations
Services Occupations by Sex
| Occupation | Male | Female |
| Healthcare Support | 0 (0.0%) | 0 (0.0%) |
| Security & Protection | 0 (0.0%) | 0 (0.0%) |
| Firefighting & Prevention | 0 (0.0%) | 0 (0.0%) |
| Law Enforcement | 0 (0.0%) | 0 (0.0%) |
| Food Preparation & Serving | 0 (0.0%) | 0 (0.0%) |
| Cleaning & Maintenance | 0 (0.0%) | 0 (0.0%) |
| Personal Care & Service | 0 (0.0%) | 0 (0.0%) |
| Total (Category) | 0 (0.0%) | 0 (0.0%) |
| Total (Overall) | 23 (63.9%) | 13 (36.1%) |
Sales and Office Occupations
Sales and Office Occupations by Sex
| Occupation | Male | Female |
| Sales & Related | 0 (0.0%) | 0 (0.0%) |
| Office & Administration | 0 (0.0%) | 0 (0.0%) |
| Total (Category) | 0 (0.0%) | 0 (0.0%) |
| Total (Overall) | 23 (63.9%) | 13 (36.1%) |
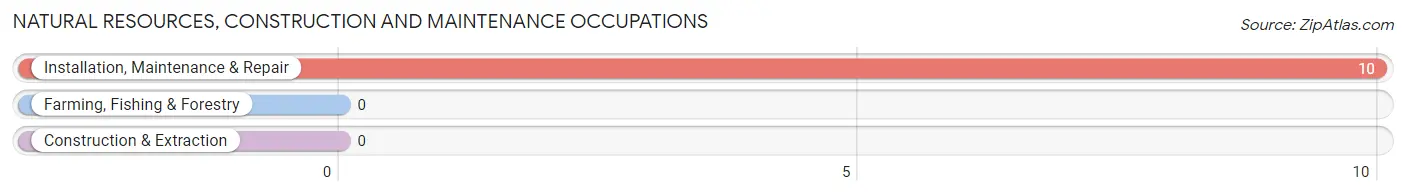
Natural Resources, Construction and Maintenance Occupations
The most common Natural Resources, Construction and Maintenance occupations in St Maurice are , and Installation, Maintenance & Repair (10 | 27.8%).
Natural Resources, Construction and Maintenance Occupations by Sex
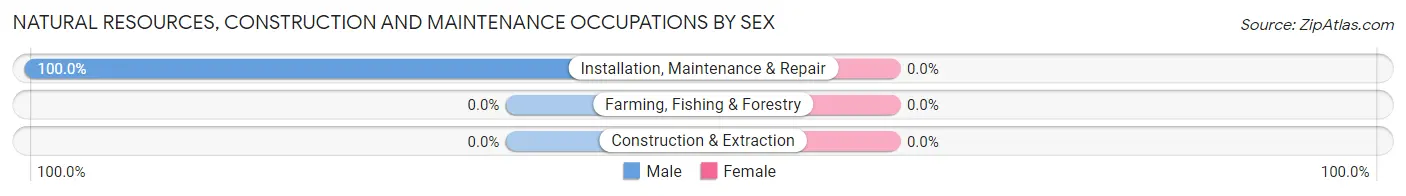
| Occupation | Male | Female |
| Farming, Fishing & Forestry | 0 (0.0%) | 0 (0.0%) |
| Construction & Extraction | 0 (0.0%) | 0 (0.0%) |
| Installation, Maintenance & Repair | 10 (100.0%) | 0 (0.0%) |
| Total (Category) | 10 (100.0%) | 0 (0.0%) |
| Total (Overall) | 23 (63.9%) | 13 (36.1%) |
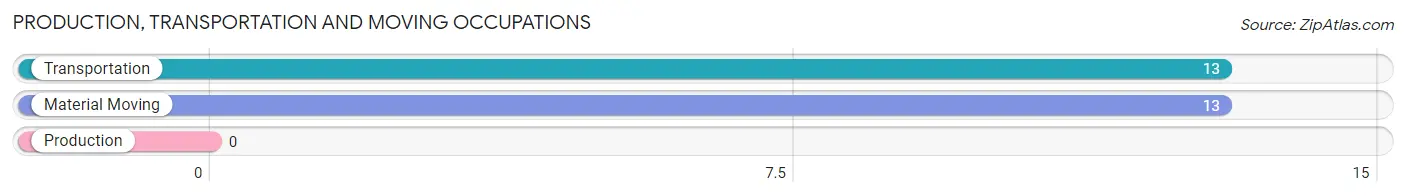
Production, Transportation and Moving Occupations
The most common Production, Transportation and Moving occupations in St Maurice are Transportation (13 | 36.1%), and Material Moving (13 | 36.1%).
Production, Transportation and Moving Occupations by Sex
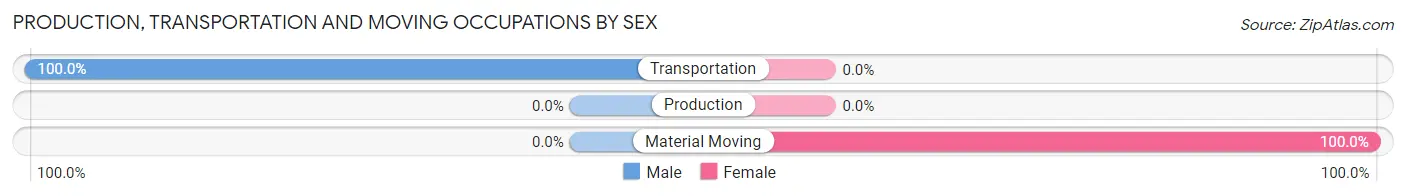
| Occupation | Male | Female |
| Production | 0 (0.0%) | 0 (0.0%) |
| Transportation | 13 (100.0%) | 0 (0.0%) |
| Material Moving | 0 (0.0%) | 13 (100.0%) |
| Total (Category) | 13 (50.0%) | 13 (50.0%) |
| Total (Overall) | 23 (63.9%) | 13 (36.1%) |
Employment Industries by Sex in St Maurice
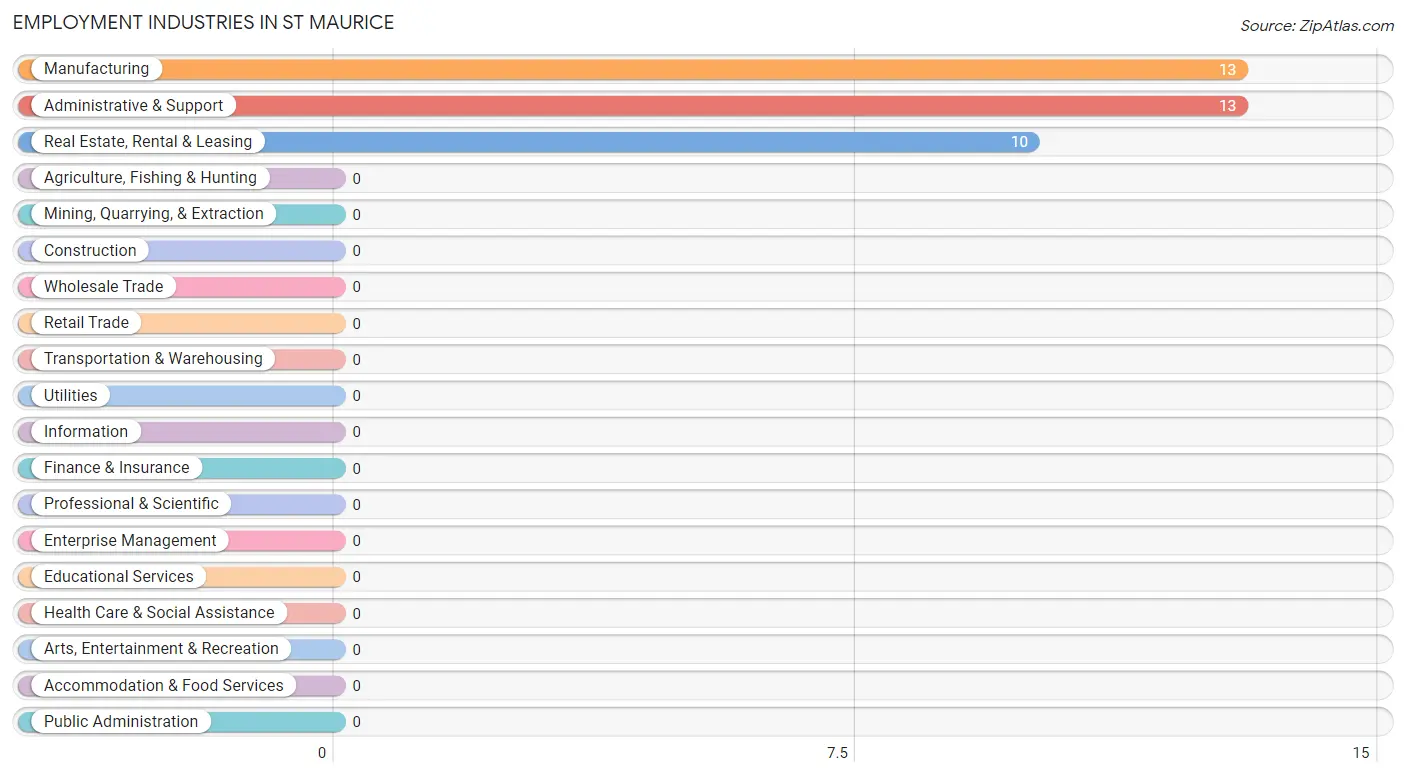
Employment Industries in St Maurice
The major employment industries in St Maurice include Manufacturing (13 | 36.1%), Administrative & Support (13 | 36.1%), and Real Estate, Rental & Leasing (10 | 27.8%).
Employment Industries by Sex in St Maurice
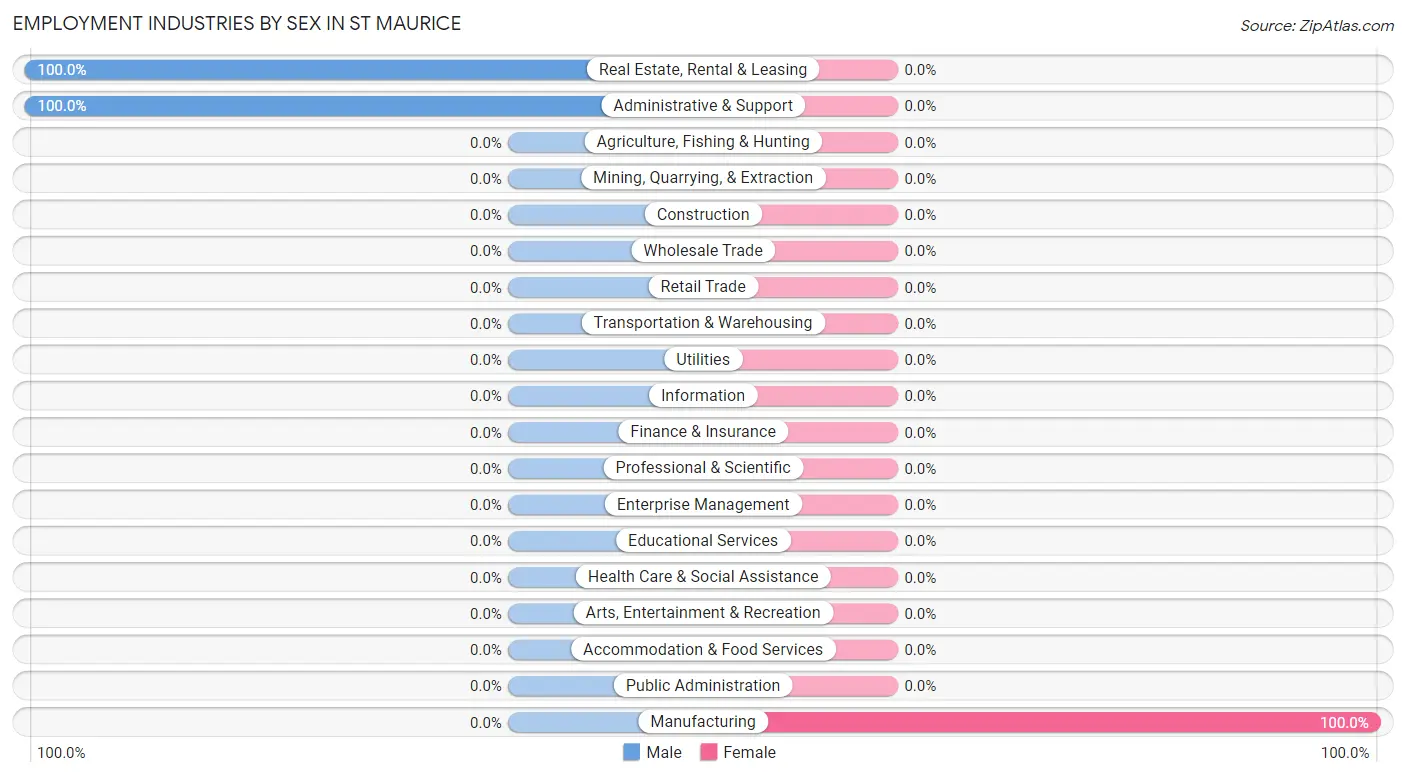
| Industry | Male | Female |
| Agriculture, Fishing & Hunting | 0 (0.0%) | 0 (0.0%) |
| Mining, Quarrying, & Extraction | 0 (0.0%) | 0 (0.0%) |
| Construction | 0 (0.0%) | 0 (0.0%) |
| Manufacturing | 0 (0.0%) | 13 (100.0%) |
| Wholesale Trade | 0 (0.0%) | 0 (0.0%) |
| Retail Trade | 0 (0.0%) | 0 (0.0%) |
| Transportation & Warehousing | 0 (0.0%) | 0 (0.0%) |
| Utilities | 0 (0.0%) | 0 (0.0%) |
| Information | 0 (0.0%) | 0 (0.0%) |
| Finance & Insurance | 0 (0.0%) | 0 (0.0%) |
| Real Estate, Rental & Leasing | 10 (100.0%) | 0 (0.0%) |
| Professional & Scientific | 0 (0.0%) | 0 (0.0%) |
| Enterprise Management | 0 (0.0%) | 0 (0.0%) |
| Administrative & Support | 13 (100.0%) | 0 (0.0%) |
| Educational Services | 0 (0.0%) | 0 (0.0%) |
| Health Care & Social Assistance | 0 (0.0%) | 0 (0.0%) |
| Arts, Entertainment & Recreation | 0 (0.0%) | 0 (0.0%) |
| Accommodation & Food Services | 0 (0.0%) | 0 (0.0%) |
| Public Administration | 0 (0.0%) | 0 (0.0%) |
| Total | 23 (63.9%) | 13 (36.1%) |
Education in St Maurice
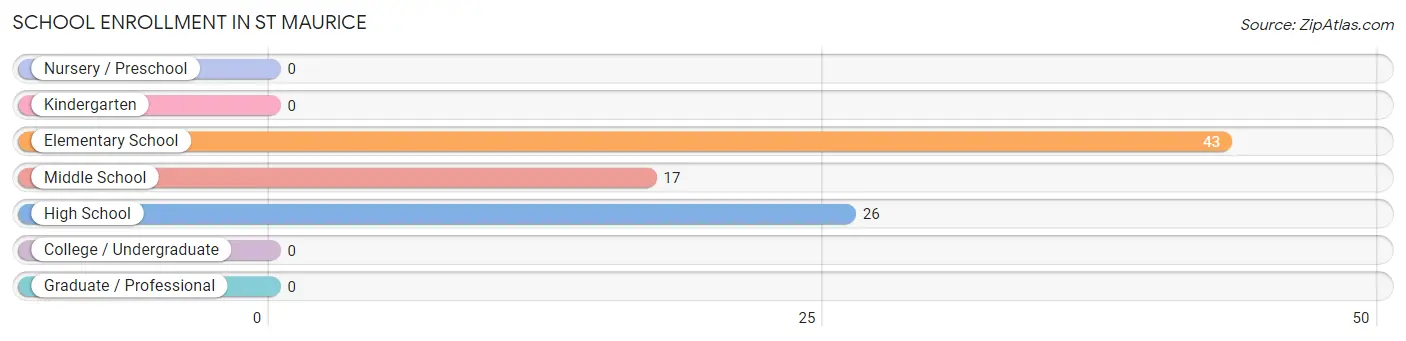
School Enrollment in St Maurice
The most common levels of schooling among the 86 students in St Maurice are elementary school (43 | 50.0%), high school (26 | 30.2%), and middle school (17 | 19.8%).
| School Level | # Students | % Students |
| Nursery / Preschool | 0 | 0.0% |
| Kindergarten | 0 | 0.0% |
| Elementary School | 43 | 50.0% |
| Middle School | 17 | 19.8% |
| High School | 26 | 30.2% |
| College / Undergraduate | 0 | 0.0% |
| Graduate / Professional | 0 | 0.0% |
| Total | 86 | 100.0% |
School Enrollment by Age by Funding Source in St Maurice
Out of a total of 86 students who are enrolled in schools in St Maurice, 17 (19.8%) attend a private institution, while the remaining 69 (80.2%) are enrolled in public schools. The age group of 10 to 14 year olds has the highest likelihood of being enrolled in private schools, with 17 (38.6% in the age bracket) enrolled. Conversely, the age group of 5 to 9 year old has the lowest likelihood of being enrolled in a private school, with 16 (100.0% in the age bracket) attending a public institution.
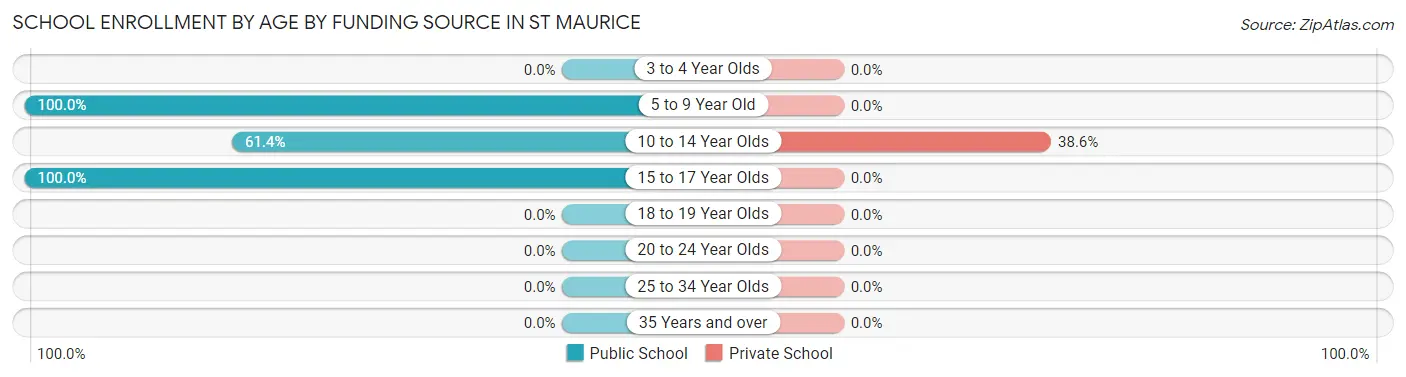
| Age Bracket | Public School | Private School |
| 3 to 4 Year Olds | 0 (0.0%) | 0 (0.0%) |
| 5 to 9 Year Old | 16 (100.0%) | 0 (0.0%) |
| 10 to 14 Year Olds | 27 (61.4%) | 17 (38.6%) |
| 15 to 17 Year Olds | 26 (100.0%) | 0 (0.0%) |
| 18 to 19 Year Olds | 0 (0.0%) | 0 (0.0%) |
| 20 to 24 Year Olds | 0 (0.0%) | 0 (0.0%) |
| 25 to 34 Year Olds | 0 (0.0%) | 0 (0.0%) |
| 35 Years and over | 0 (0.0%) | 0 (0.0%) |
| Total | 69 (80.2%) | 17 (19.8%) |
Educational Attainment by Field of Study in St Maurice
| Field of Study | # Graduates | % Graduates |
| Computers & Mathematics | 0 | 0.0% |
| Bio, Nature & Agricultural | 0 | 0.0% |
| Physical & Health Sciences | 0 | 0.0% |
| Psychology | 0 | 0.0% |
| Social Sciences | 0 | 0.0% |
| Engineering | 0 | 0.0% |
| Multidisciplinary Studies | 0 | 0.0% |
| Science & Technology | 0 | 0.0% |
| Business | 0 | 0.0% |
| Education | 0 | 0.0% |
| Literature & Languages | 0 | 0.0% |
| Liberal Arts & History | 0 | 0.0% |
| Visual & Performing Arts | 0 | 0.0% |
| Communications | 0 | 0.0% |
| Arts & Humanities | 0 | 0.0% |
| Total | 0 | 0.0% |
Transportation & Commute in St Maurice
Vehicle Availability by Sex in St Maurice
The most prevalent vehicle ownership categories in St Maurice are males with 5 or more vehicles (13, accounting for 56.5%) and females with 5 or more vehicles (0, making up 100.0%).
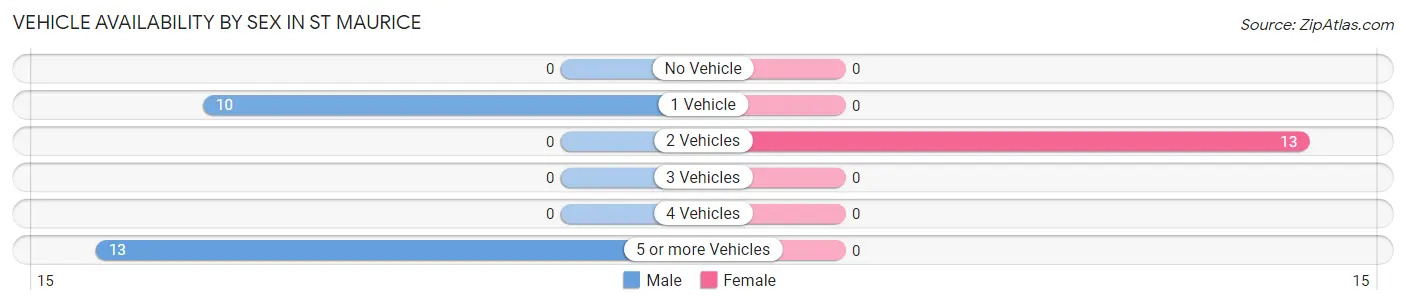
| Vehicles Available | Male | Female |
| No Vehicle | 0 (0.0%) | 0 (0.0%) |
| 1 Vehicle | 10 (43.5%) | 0 (0.0%) |
| 2 Vehicles | 0 (0.0%) | 13 (100.0%) |
| 3 Vehicles | 0 (0.0%) | 0 (0.0%) |
| 4 Vehicles | 0 (0.0%) | 0 (0.0%) |
| 5 or more Vehicles | 13 (56.5%) | 0 (0.0%) |
| Total | 23 (100.0%) | 13 (100.0%) |
Commute Time in St Maurice
The most frequently occuring commute durations in St Maurice are 20 to 24 minutes (13 commuters, 36.1%), 45 to 59 minutes (13 commuters, 36.1%), and 15 to 19 minutes (10 commuters, 27.8%).
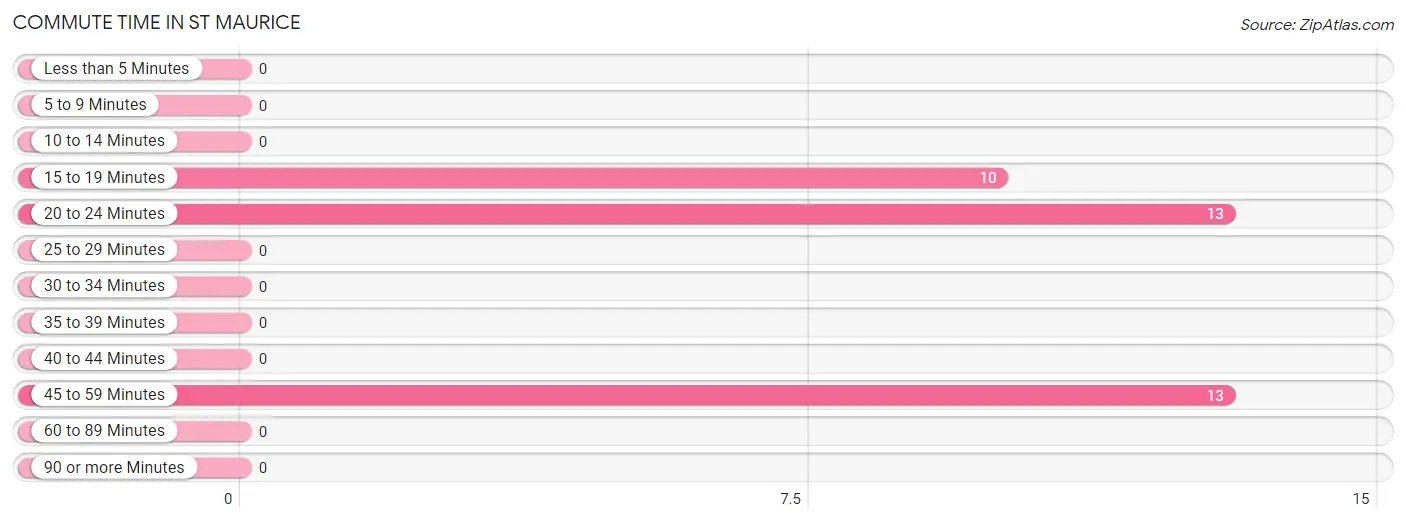
| Commute Time | # Commuters | % Commuters |
| Less than 5 Minutes | 0 | 0.0% |
| 5 to 9 Minutes | 0 | 0.0% |
| 10 to 14 Minutes | 0 | 0.0% |
| 15 to 19 Minutes | 10 | 27.8% |
| 20 to 24 Minutes | 13 | 36.1% |
| 25 to 29 Minutes | 0 | 0.0% |
| 30 to 34 Minutes | 0 | 0.0% |
| 35 to 39 Minutes | 0 | 0.0% |
| 40 to 44 Minutes | 0 | 0.0% |
| 45 to 59 Minutes | 13 | 36.1% |
| 60 to 89 Minutes | 0 | 0.0% |
| 90 or more Minutes | 0 | 0.0% |
Commute Time by Sex in St Maurice
The most common commute times in St Maurice are 20 to 24 minutes (13 commuters, 56.5%) for males and 45 to 59 minutes (13 commuters, 100.0%) for females.
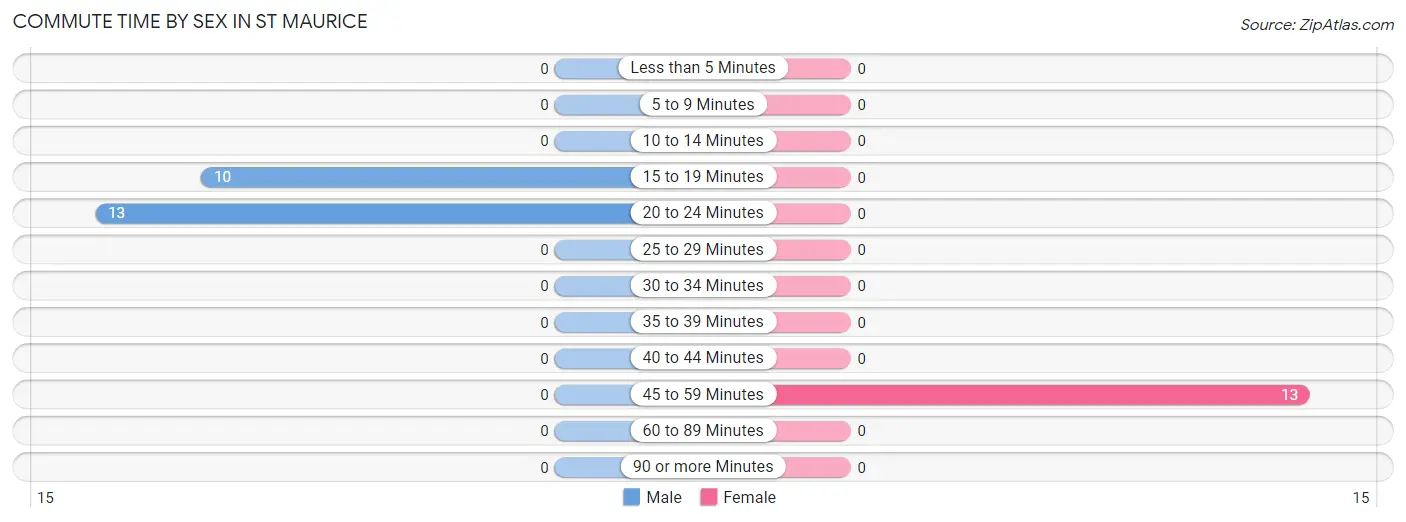
| Commute Time | Male | Female |
| Less than 5 Minutes | 0 (0.0%) | 0 (0.0%) |
| 5 to 9 Minutes | 0 (0.0%) | 0 (0.0%) |
| 10 to 14 Minutes | 0 (0.0%) | 0 (0.0%) |
| 15 to 19 Minutes | 10 (43.5%) | 0 (0.0%) |
| 20 to 24 Minutes | 13 (56.5%) | 0 (0.0%) |
| 25 to 29 Minutes | 0 (0.0%) | 0 (0.0%) |
| 30 to 34 Minutes | 0 (0.0%) | 0 (0.0%) |
| 35 to 39 Minutes | 0 (0.0%) | 0 (0.0%) |
| 40 to 44 Minutes | 0 (0.0%) | 0 (0.0%) |
| 45 to 59 Minutes | 0 (0.0%) | 13 (100.0%) |
| 60 to 89 Minutes | 0 (0.0%) | 0 (0.0%) |
| 90 or more Minutes | 0 (0.0%) | 0 (0.0%) |
Time of Departure to Work by Sex in St Maurice
The most frequent times of departure to work in St Maurice are 5:00 AM to 5:29 AM (13, 56.5%) for males and 12:00 AM to 4:59 AM (13, 100.0%) for females.
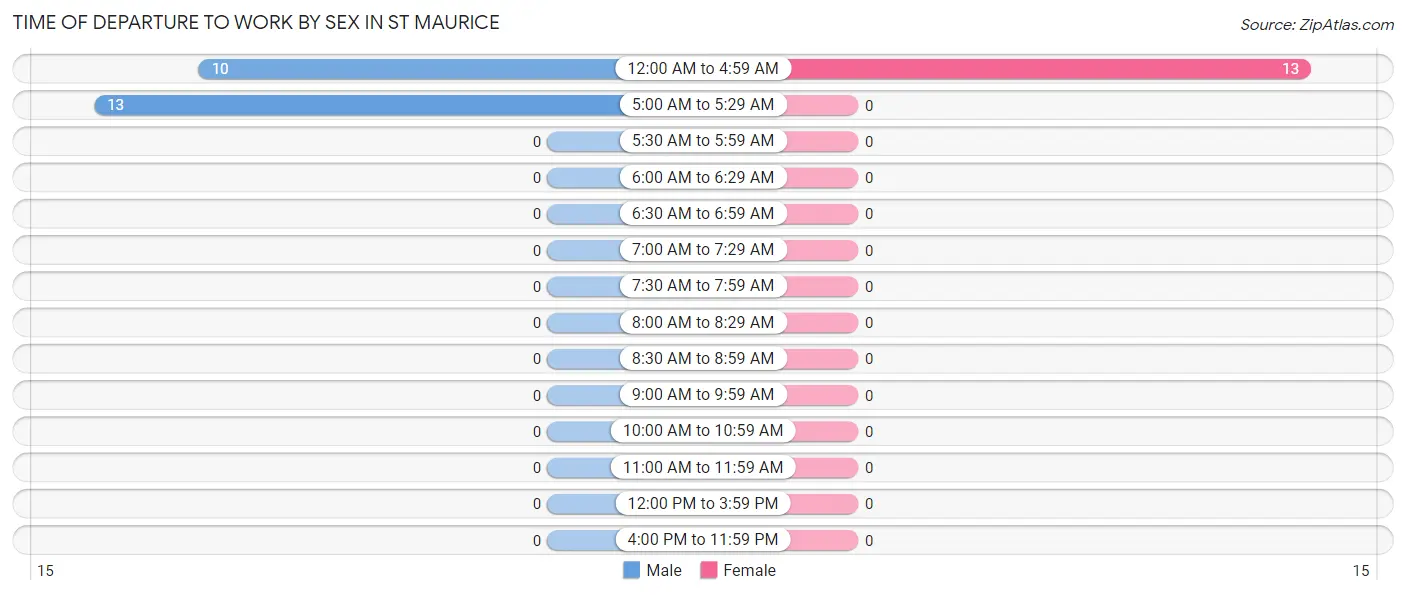
| Time of Departure | Male | Female |
| 12:00 AM to 4:59 AM | 10 (43.5%) | 13 (100.0%) |
| 5:00 AM to 5:29 AM | 13 (56.5%) | 0 (0.0%) |
| 5:30 AM to 5:59 AM | 0 (0.0%) | 0 (0.0%) |
| 6:00 AM to 6:29 AM | 0 (0.0%) | 0 (0.0%) |
| 6:30 AM to 6:59 AM | 0 (0.0%) | 0 (0.0%) |
| 7:00 AM to 7:29 AM | 0 (0.0%) | 0 (0.0%) |
| 7:30 AM to 7:59 AM | 0 (0.0%) | 0 (0.0%) |
| 8:00 AM to 8:29 AM | 0 (0.0%) | 0 (0.0%) |
| 8:30 AM to 8:59 AM | 0 (0.0%) | 0 (0.0%) |
| 9:00 AM to 9:59 AM | 0 (0.0%) | 0 (0.0%) |
| 10:00 AM to 10:59 AM | 0 (0.0%) | 0 (0.0%) |
| 11:00 AM to 11:59 AM | 0 (0.0%) | 0 (0.0%) |
| 12:00 PM to 3:59 PM | 0 (0.0%) | 0 (0.0%) |
| 4:00 PM to 11:59 PM | 0 (0.0%) | 0 (0.0%) |
| Total | 23 (100.0%) | 13 (100.0%) |
Housing Occupancy in St Maurice
Occupancy by Ownership in St Maurice
Of the total 88 dwellings in St Maurice, owner-occupied units account for 88 (100.0%), while renter-occupied units make up 0 (0.0%).
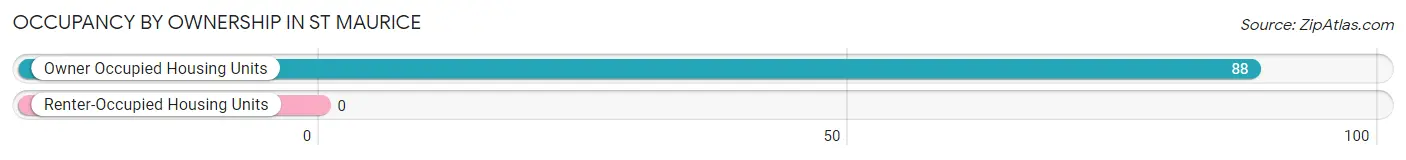
| Occupancy | # Housing Units | % Housing Units |
| Owner Occupied Housing Units | 88 | 100.0% |
| Renter-Occupied Housing Units | 0 | 0.0% |
| Total Occupied Housing Units | 88 | 100.0% |
Occupancy by Household Size in St Maurice
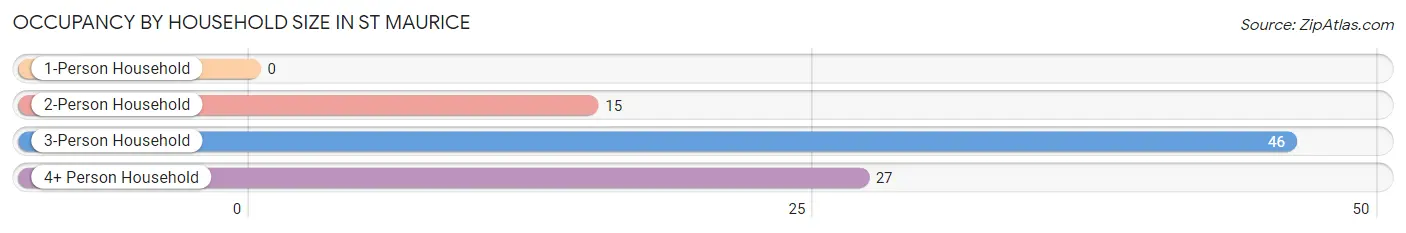
| Household Size | # Housing Units | % Housing Units |
| 1-Person Household | 0 | 0.0% |
| 2-Person Household | 15 | 17.1% |
| 3-Person Household | 46 | 52.3% |
| 4+ Person Household | 27 | 30.7% |
| Total Housing Units | 88 | 100.0% |
Occupancy by Ownership by Household Size in St Maurice
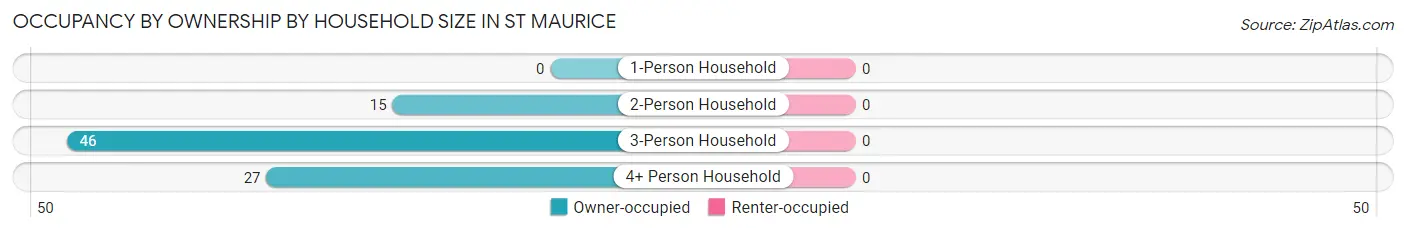
| Household Size | Owner-occupied | Renter-occupied |
| 1-Person Household | 0 (0.0%) | 0 (0.0%) |
| 2-Person Household | 15 (100.0%) | 0 (0.0%) |
| 3-Person Household | 46 (100.0%) | 0 (0.0%) |
| 4+ Person Household | 27 (100.0%) | 0 (0.0%) |
| Total Housing Units | 88 (100.0%) | 0 (0.0%) |
Occupancy by Educational Attainment in St Maurice
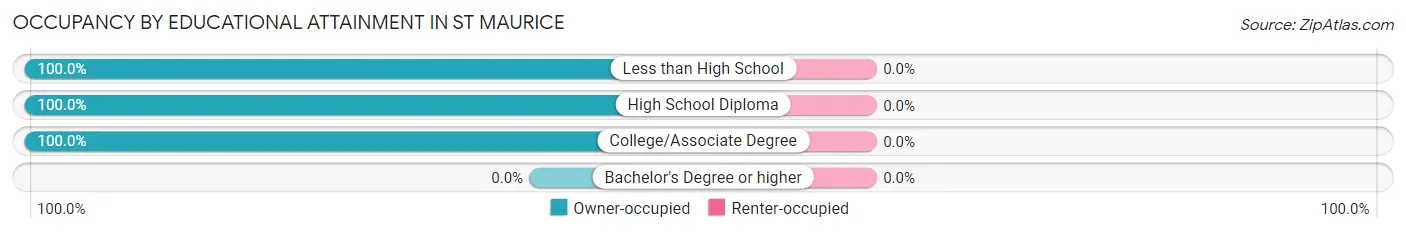
| Household Size | Owner-occupied | Renter-occupied |
| Less than High School | 16 (100.0%) | 0 (0.0%) |
| High School Diploma | 37 (100.0%) | 0 (0.0%) |
| College/Associate Degree | 35 (100.0%) | 0 (0.0%) |
| Bachelor's Degree or higher | 0 (0.0%) | 0 (0.0%) |
Occupancy by Age of Householder in St Maurice
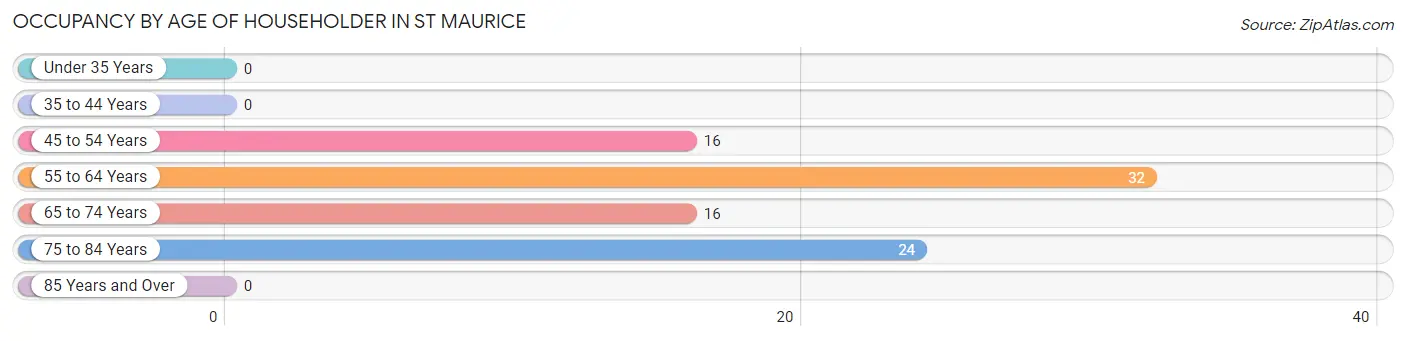
| Age Bracket | # Households | % Households |
| Under 35 Years | 0 | 0.0% |
| 35 to 44 Years | 0 | 0.0% |
| 45 to 54 Years | 16 | 18.2% |
| 55 to 64 Years | 32 | 36.4% |
| 65 to 74 Years | 16 | 18.2% |
| 75 to 84 Years | 24 | 27.3% |
| 85 Years and Over | 0 | 0.0% |
| Total | 88 | 100.0% |
Housing Finances in St Maurice
Median Income by Occupancy in St Maurice
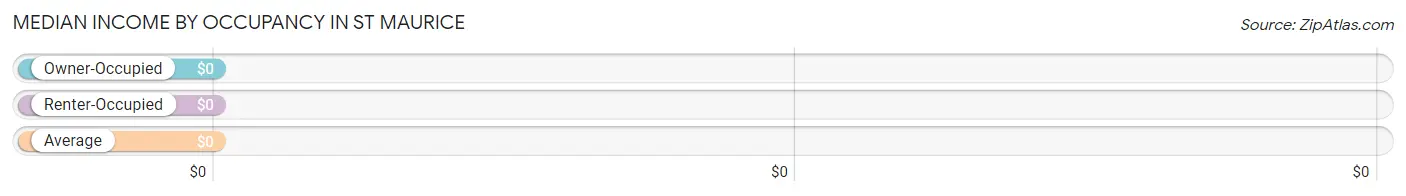
| Occupancy Type | # Households | Median Income |
| Owner-Occupied | 88 (100.0%) | $0 |
| Renter-Occupied | 0 (0.0%) | $0 |
| Average | 88 (100.0%) | $0 |
Occupancy by Householder Income Bracket in St Maurice
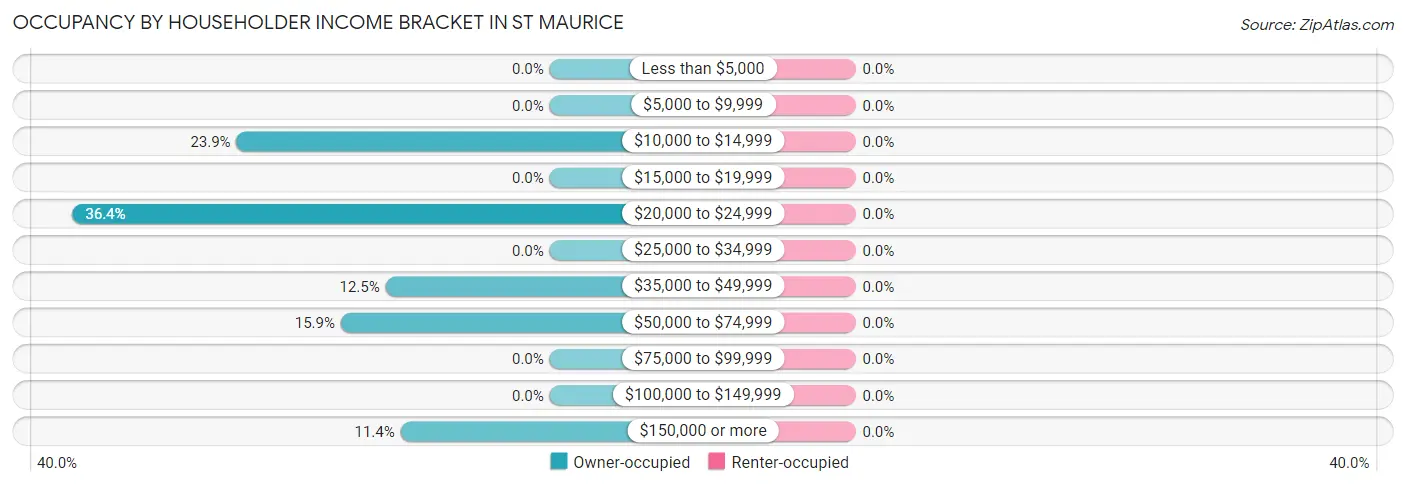
| Income Bracket | Owner-occupied | Renter-occupied |
| Less than $5,000 | 0 (0.0%) | 0 (0.0%) |
| $5,000 to $9,999 | 0 (0.0%) | 0 (0.0%) |
| $10,000 to $14,999 | 21 (23.9%) | 0 (0.0%) |
| $15,000 to $19,999 | 0 (0.0%) | 0 (0.0%) |
| $20,000 to $24,999 | 32 (36.4%) | 0 (0.0%) |
| $25,000 to $34,999 | 0 (0.0%) | 0 (0.0%) |
| $35,000 to $49,999 | 11 (12.5%) | 0 (0.0%) |
| $50,000 to $74,999 | 14 (15.9%) | 0 (0.0%) |
| $75,000 to $99,999 | 0 (0.0%) | 0 (0.0%) |
| $100,000 to $149,999 | 0 (0.0%) | 0 (0.0%) |
| $150,000 or more | 10 (11.4%) | 0 (0.0%) |
| Total | 88 (100.0%) | 0 (0.0%) |
Monthly Housing Cost Tiers in St Maurice
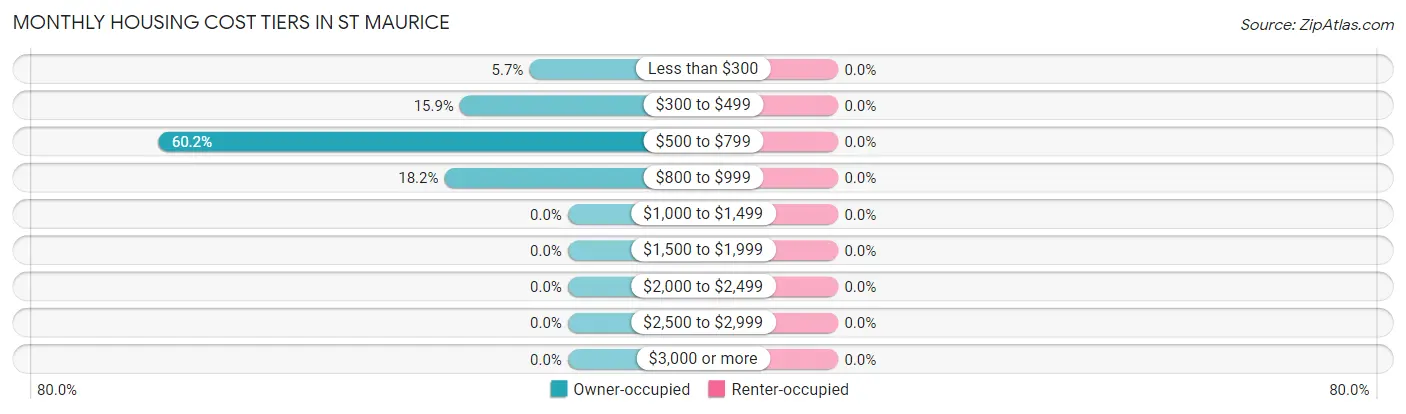
| Monthly Cost | Owner-occupied | Renter-occupied |
| Less than $300 | 5 (5.7%) | 0 (0.0%) |
| $300 to $499 | 14 (15.9%) | 0 (0.0%) |
| $500 to $799 | 53 (60.2%) | 0 (0.0%) |
| $800 to $999 | 16 (18.2%) | 0 (0.0%) |
| $1,000 to $1,499 | 0 (0.0%) | 0 (0.0%) |
| $1,500 to $1,999 | 0 (0.0%) | 0 (0.0%) |
| $2,000 to $2,499 | 0 (0.0%) | 0 (0.0%) |
| $2,500 to $2,999 | 0 (0.0%) | 0 (0.0%) |
| $3,000 or more | 0 (0.0%) | 0 (0.0%) |
| Total | 88 (100.0%) | 0 (0.0%) |
Physical Housing Characteristics in St Maurice
Housing Structures in St Maurice
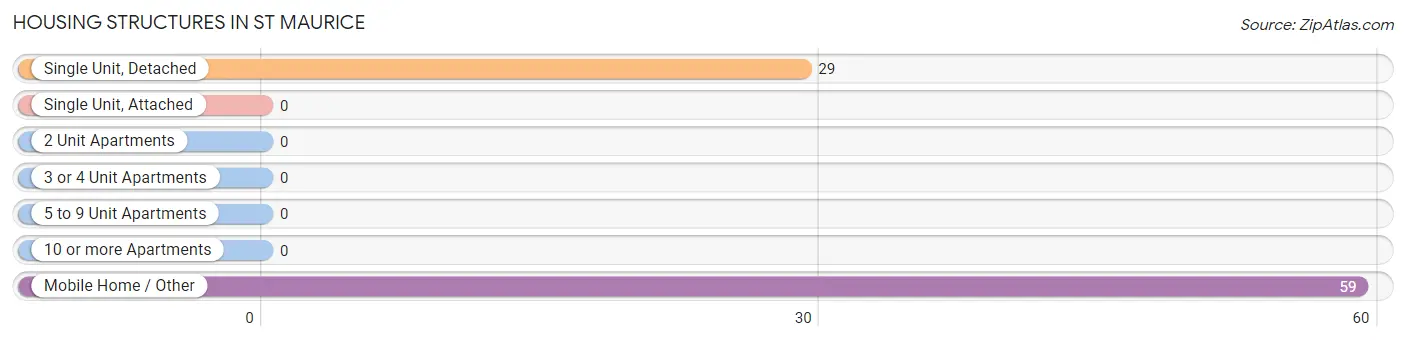
| Structure Type | # Housing Units | % Housing Units |
| Single Unit, Detached | 29 | 33.0% |
| Single Unit, Attached | 0 | 0.0% |
| 2 Unit Apartments | 0 | 0.0% |
| 3 or 4 Unit Apartments | 0 | 0.0% |
| 5 to 9 Unit Apartments | 0 | 0.0% |
| 10 or more Apartments | 0 | 0.0% |
| Mobile Home / Other | 59 | 67.0% |
| Total | 88 | 100.0% |
Housing Structures by Occupancy in St Maurice
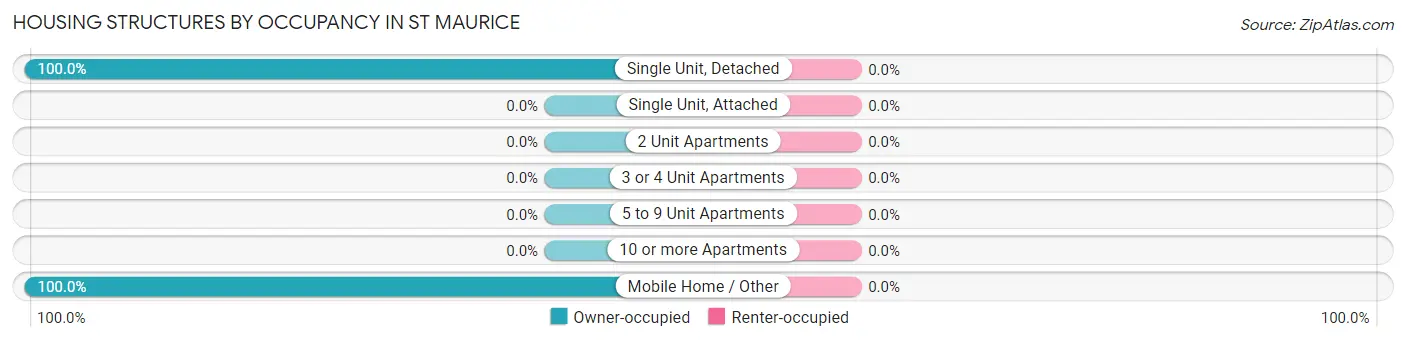
| Structure Type | Owner-occupied | Renter-occupied |
| Single Unit, Detached | 29 (100.0%) | 0 (0.0%) |
| Single Unit, Attached | 0 (0.0%) | 0 (0.0%) |
| 2 Unit Apartments | 0 (0.0%) | 0 (0.0%) |
| 3 or 4 Unit Apartments | 0 (0.0%) | 0 (0.0%) |
| 5 to 9 Unit Apartments | 0 (0.0%) | 0 (0.0%) |
| 10 or more Apartments | 0 (0.0%) | 0 (0.0%) |
| Mobile Home / Other | 59 (100.0%) | 0 (0.0%) |
| Total | 88 (100.0%) | 0 (0.0%) |
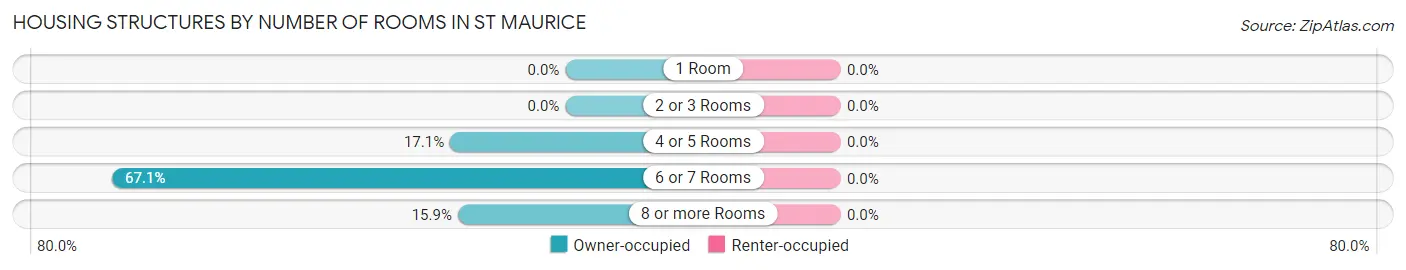
Housing Structures by Number of Rooms in St Maurice
| Number of Rooms | Owner-occupied | Renter-occupied |
| 1 Room | 0 (0.0%) | 0 (0.0%) |
| 2 or 3 Rooms | 0 (0.0%) | 0 (0.0%) |
| 4 or 5 Rooms | 15 (17.1%) | 0 (0.0%) |
| 6 or 7 Rooms | 59 (67.0%) | 0 (0.0%) |
| 8 or more Rooms | 14 (15.9%) | 0 (0.0%) |
| Total | 88 (100.0%) | 0 (0.0%) |
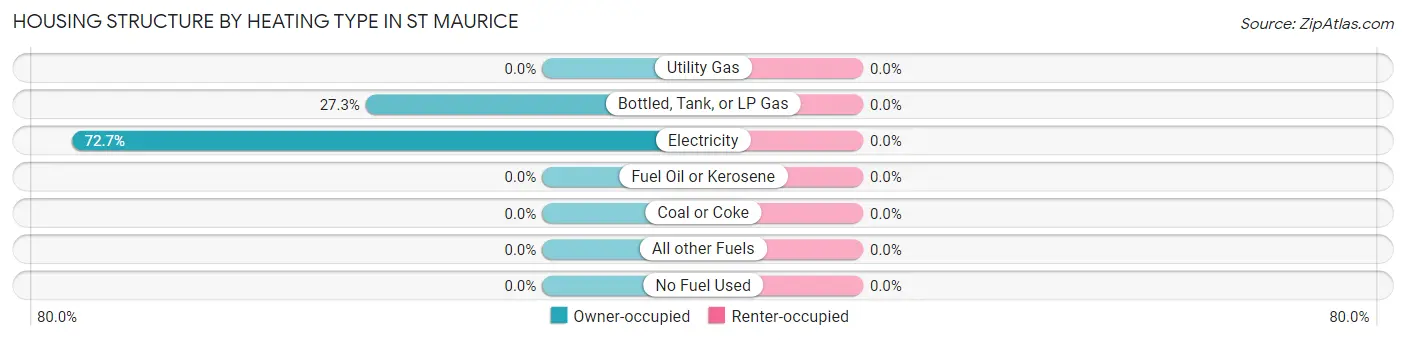
Housing Structure by Heating Type in St Maurice
| Heating Type | Owner-occupied | Renter-occupied |
| Utility Gas | 0 (0.0%) | 0 (0.0%) |
| Bottled, Tank, or LP Gas | 24 (27.3%) | 0 (0.0%) |
| Electricity | 64 (72.7%) | 0 (0.0%) |
| Fuel Oil or Kerosene | 0 (0.0%) | 0 (0.0%) |
| Coal or Coke | 0 (0.0%) | 0 (0.0%) |
| All other Fuels | 0 (0.0%) | 0 (0.0%) |
| No Fuel Used | 0 (0.0%) | 0 (0.0%) |
| Total | 88 (100.0%) | 0 (0.0%) |
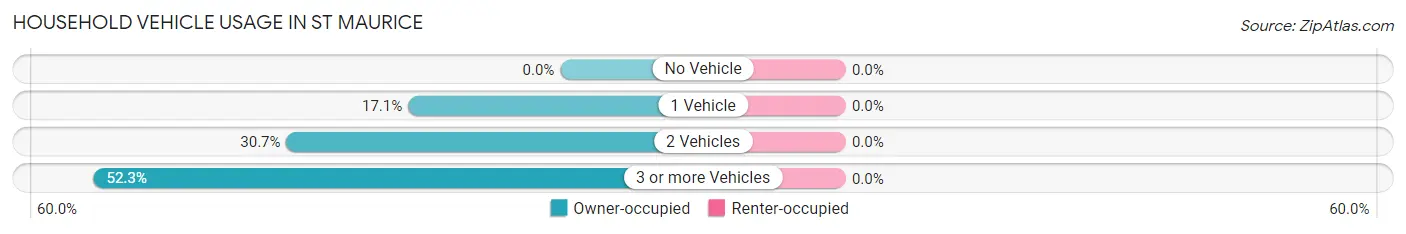
Household Vehicle Usage in St Maurice
| Vehicles per Household | Owner-occupied | Renter-occupied |
| No Vehicle | 0 (0.0%) | 0 (0.0%) |
| 1 Vehicle | 15 (17.1%) | 0 (0.0%) |
| 2 Vehicles | 27 (30.7%) | 0 (0.0%) |
| 3 or more Vehicles | 46 (52.3%) | 0 (0.0%) |
| Total | 88 (100.0%) | 0 (0.0%) |
Real Estate & Mortgages in St Maurice
Real Estate and Mortgage Overview in St Maurice
| Characteristic | Without Mortgage | With Mortgage |
| Housing Units | 72 | 16 |
| Median Property Value | $47,200 | $0 |
| Median Household Income | - | - |
| Monthly Housing Costs | $540 | $0 |
| Real Estate Taxes | - | - |
Property Value by Mortgage Status in St Maurice
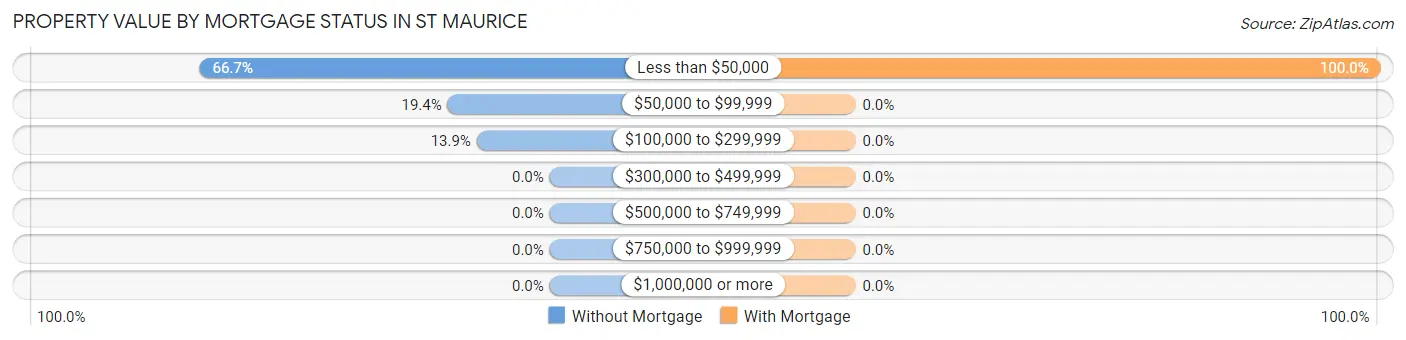
| Property Value | Without Mortgage | With Mortgage |
| Less than $50,000 | 48 (66.7%) | 16 (100.0%) |
| $50,000 to $99,999 | 14 (19.4%) | 0 (0.0%) |
| $100,000 to $299,999 | 10 (13.9%) | 0 (0.0%) |
| $300,000 to $499,999 | 0 (0.0%) | 0 (0.0%) |
| $500,000 to $749,999 | 0 (0.0%) | 0 (0.0%) |
| $750,000 to $999,999 | 0 (0.0%) | 0 (0.0%) |
| $1,000,000 or more | 0 (0.0%) | 0 (0.0%) |
| Total | 72 (100.0%) | 16 (100.0%) |
Household Income by Mortgage Status in St Maurice
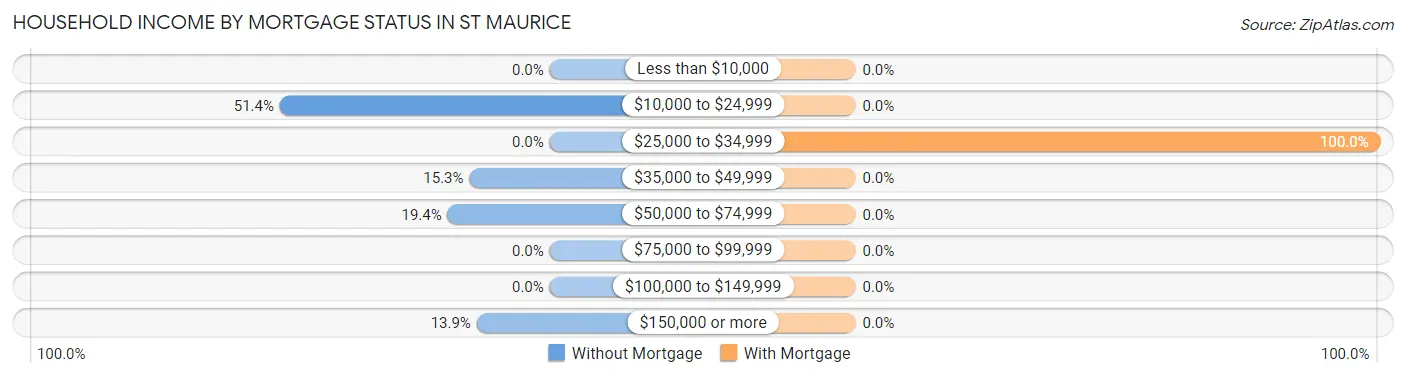
| Household Income | Without Mortgage | With Mortgage |
| Less than $10,000 | 0 (0.0%) | 0 (0.0%) |
| $10,000 to $24,999 | 37 (51.4%) | 0 (0.0%) |
| $25,000 to $34,999 | 0 (0.0%) | 16 (100.0%) |
| $35,000 to $49,999 | 11 (15.3%) | 0 (0.0%) |
| $50,000 to $74,999 | 14 (19.4%) | 0 (0.0%) |
| $75,000 to $99,999 | 0 (0.0%) | 0 (0.0%) |
| $100,000 to $149,999 | 0 (0.0%) | 0 (0.0%) |
| $150,000 or more | 10 (13.9%) | 0 (0.0%) |
| Total | 72 (100.0%) | 16 (100.0%) |
Property Value to Household Income Ratio in St Maurice
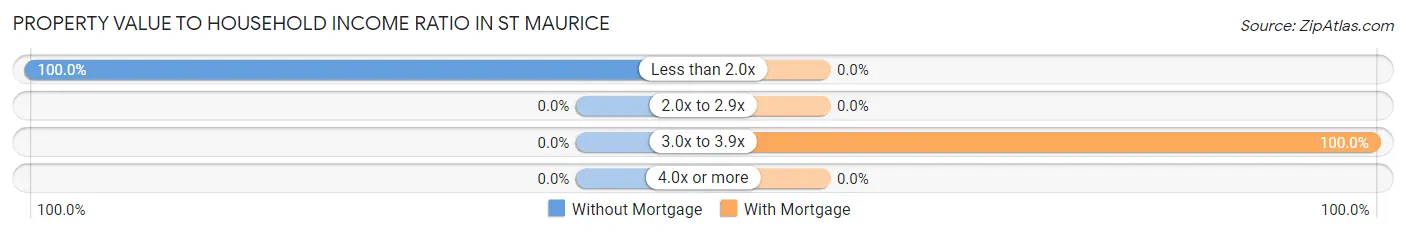
| Value-to-Income Ratio | Without Mortgage | With Mortgage |
| Less than 2.0x | 72 (100.0%) | 0 (0.0%) |
| 2.0x to 2.9x | 0 (0.0%) | 0 (0.0%) |
| 3.0x to 3.9x | 0 (0.0%) | 16 (100.0%) |
| 4.0x or more | 0 (0.0%) | 0 (0.0%) |
| Total | 72 (100.0%) | 16 (100.0%) |
Real Estate Taxes by Mortgage Status in St Maurice
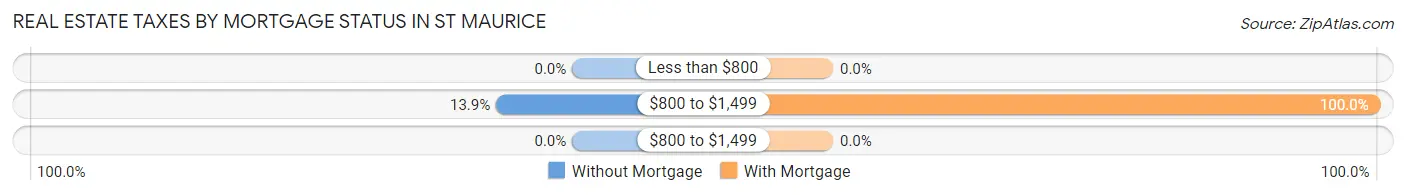
| Property Taxes | Without Mortgage | With Mortgage |
| Less than $800 | 0 (0.0%) | 0 (0.0%) |
| $800 to $1,499 | 10 (13.9%) | 16 (100.0%) |
| $800 to $1,499 | 0 (0.0%) | 0 (0.0%) |
| Total | 72 (100.0%) | 16 (100.0%) |
Health & Disability in St Maurice
Health Insurance Coverage by Age in St Maurice
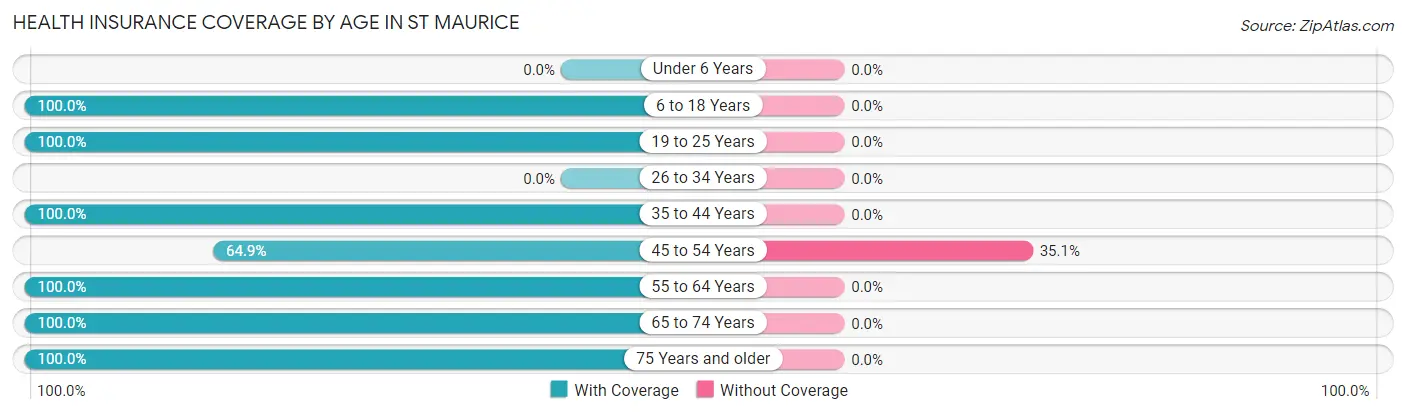
| Age Bracket | With Coverage | Without Coverage |
| Under 6 Years | 0 (0.0%) | 0 (0.0%) |
| 6 to 18 Years | 86 (100.0%) | 0 (0.0%) |
| 19 to 25 Years | 33 (100.0%) | 0 (0.0%) |
| 26 to 34 Years | 0 (0.0%) | 0 (0.0%) |
| 35 to 44 Years | 34 (100.0%) | 0 (0.0%) |
| 45 to 54 Years | 24 (64.9%) | 13 (35.1%) |
| 55 to 64 Years | 32 (100.0%) | 0 (0.0%) |
| 65 to 74 Years | 75 (100.0%) | 0 (0.0%) |
| 75 Years and older | 33 (100.0%) | 0 (0.0%) |
| Total | 317 (96.1%) | 13 (3.9%) |
Health Insurance Coverage by Citizenship Status in St Maurice
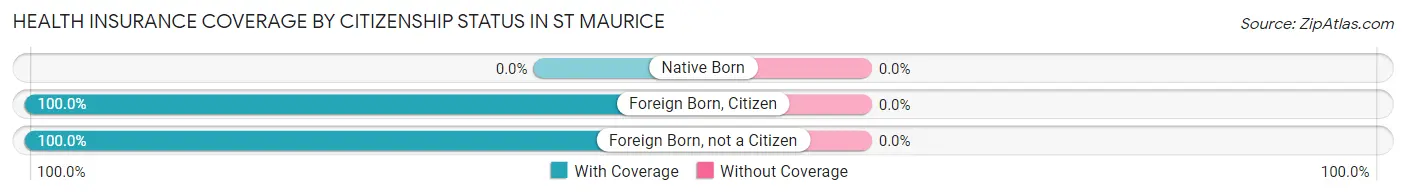
| Citizenship Status | With Coverage | Without Coverage |
| Native Born | 0 (0.0%) | 0 (0.0%) |
| Foreign Born, Citizen | 86 (100.0%) | 0 (0.0%) |
| Foreign Born, not a Citizen | 33 (100.0%) | 0 (0.0%) |
Health Insurance Coverage by Household Income in St Maurice
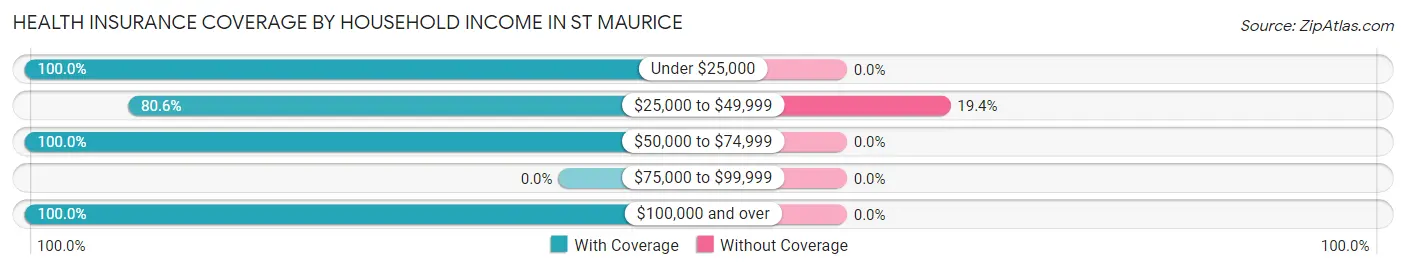
| Household Income | With Coverage | Without Coverage |
| Under $25,000 | 211 (100.0%) | 0 (0.0%) |
| $25,000 to $49,999 | 54 (80.6%) | 13 (19.4%) |
| $50,000 to $74,999 | 31 (100.0%) | 0 (0.0%) |
| $75,000 to $99,999 | 0 (0.0%) | 0 (0.0%) |
| $100,000 and over | 21 (100.0%) | 0 (0.0%) |
Public vs Private Health Insurance Coverage by Age in St Maurice
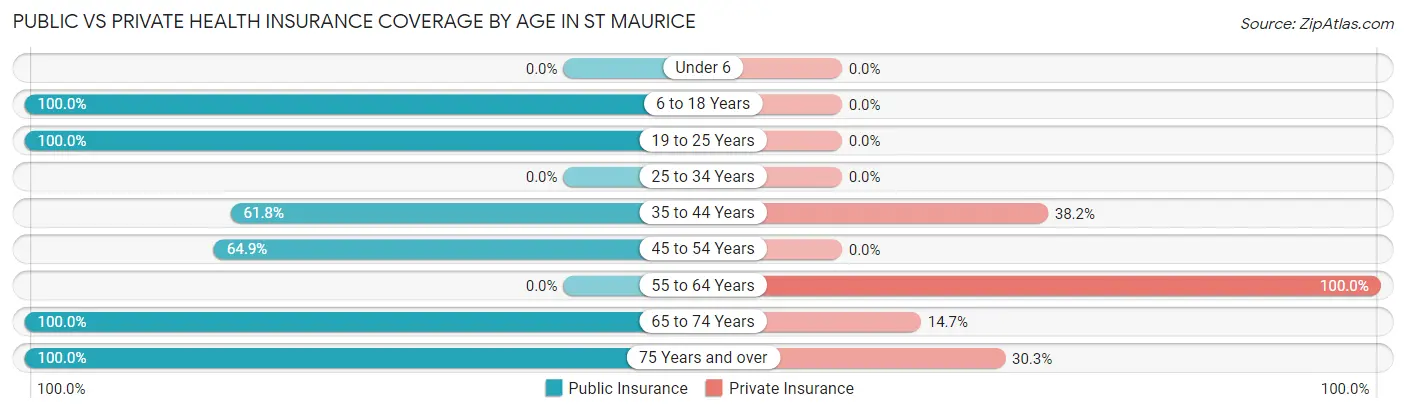
| Age Bracket | Public Insurance | Private Insurance |
| Under 6 | 0 (0.0%) | 0 (0.0%) |
| 6 to 18 Years | 86 (100.0%) | 0 (0.0%) |
| 19 to 25 Years | 33 (100.0%) | 0 (0.0%) |
| 25 to 34 Years | 0 (0.0%) | 0 (0.0%) |
| 35 to 44 Years | 21 (61.8%) | 13 (38.2%) |
| 45 to 54 Years | 24 (64.9%) | 0 (0.0%) |
| 55 to 64 Years | 0 (0.0%) | 32 (100.0%) |
| 65 to 74 Years | 75 (100.0%) | 11 (14.7%) |
| 75 Years and over | 33 (100.0%) | 10 (30.3%) |
| Total | 272 (82.4%) | 66 (20.0%) |
Disability Status by Sex by Age in St Maurice
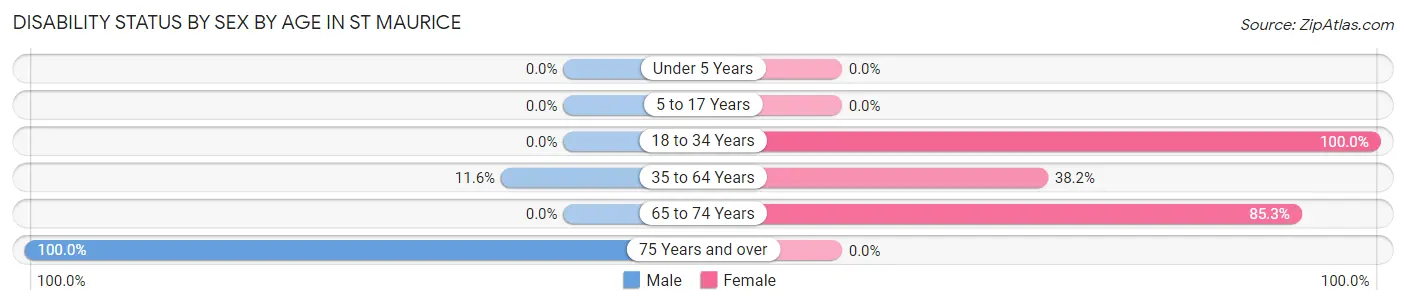
| Age Bracket | Male | Female |
| Under 5 Years | 0 (0.0%) | 0 (0.0%) |
| 5 to 17 Years | 0 (0.0%) | 0 (0.0%) |
| 18 to 34 Years | 0 (0.0%) | 33 (100.0%) |
| 35 to 64 Years | 8 (11.6%) | 13 (38.2%) |
| 65 to 74 Years | 0 (0.0%) | 64 (85.3%) |
| 75 Years and over | 19 (100.0%) | 0 (0.0%) |
Disability Class by Sex by Age in St Maurice
Disability Class: Hearing Difficulty
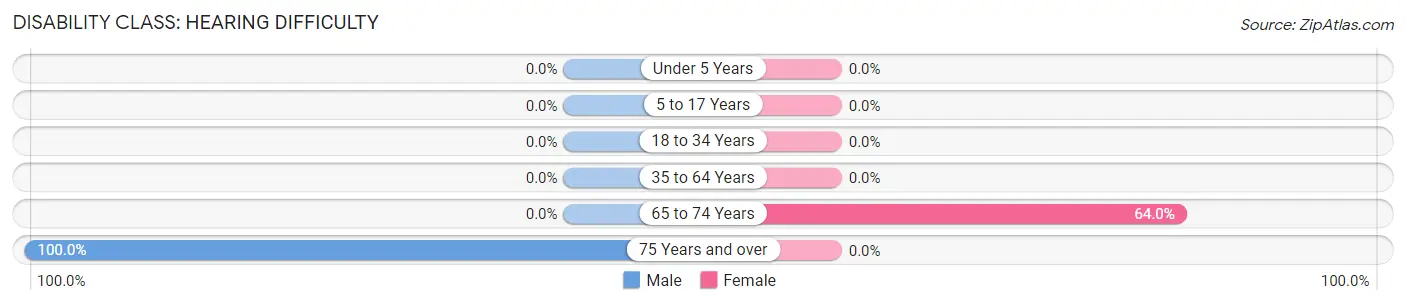
| Age Bracket | Male | Female |
| Under 5 Years | 0 (0.0%) | 0 (0.0%) |
| 5 to 17 Years | 0 (0.0%) | 0 (0.0%) |
| 18 to 34 Years | 0 (0.0%) | 0 (0.0%) |
| 35 to 64 Years | 0 (0.0%) | 0 (0.0%) |
| 65 to 74 Years | 0 (0.0%) | 48 (64.0%) |
| 75 Years and over | 19 (100.0%) | 0 (0.0%) |
Disability Class: Vision Difficulty
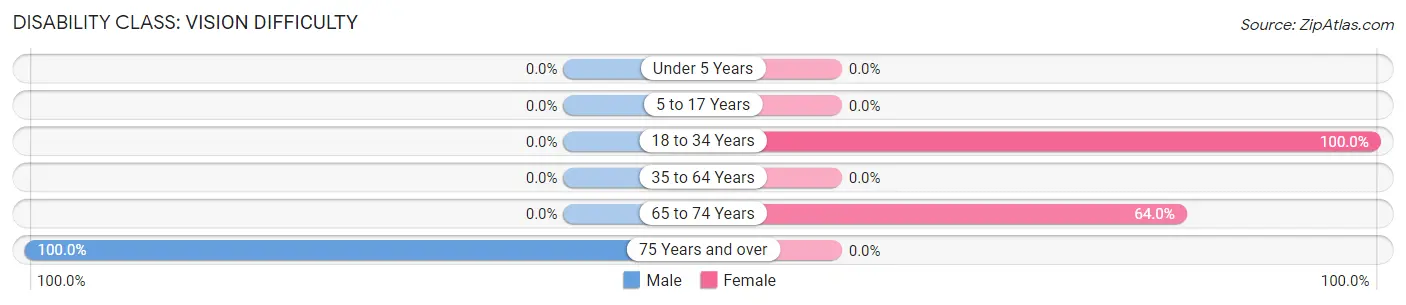
| Age Bracket | Male | Female |
| Under 5 Years | 0 (0.0%) | 0 (0.0%) |
| 5 to 17 Years | 0 (0.0%) | 0 (0.0%) |
| 18 to 34 Years | 0 (0.0%) | 33 (100.0%) |
| 35 to 64 Years | 0 (0.0%) | 0 (0.0%) |
| 65 to 74 Years | 0 (0.0%) | 48 (64.0%) |
| 75 Years and over | 19 (100.0%) | 0 (0.0%) |
Disability Class: Cognitive Difficulty
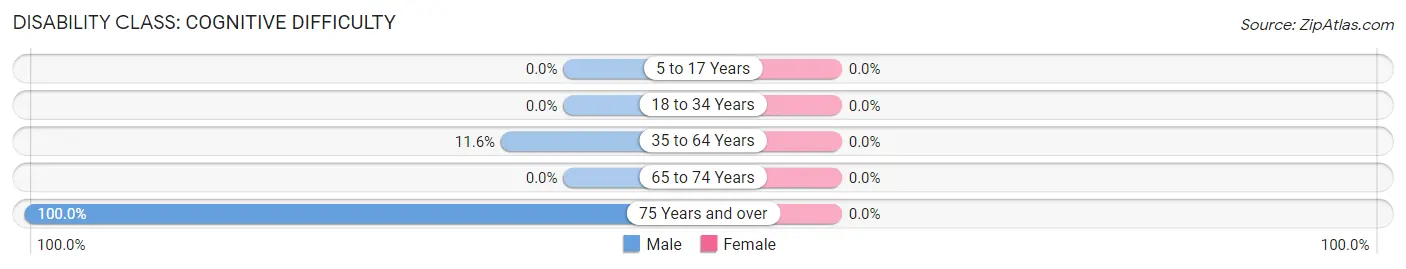
| Age Bracket | Male | Female |
| 5 to 17 Years | 0 (0.0%) | 0 (0.0%) |
| 18 to 34 Years | 0 (0.0%) | 0 (0.0%) |
| 35 to 64 Years | 8 (11.6%) | 0 (0.0%) |
| 65 to 74 Years | 0 (0.0%) | 0 (0.0%) |
| 75 Years and over | 19 (100.0%) | 0 (0.0%) |
Disability Class: Ambulatory Difficulty
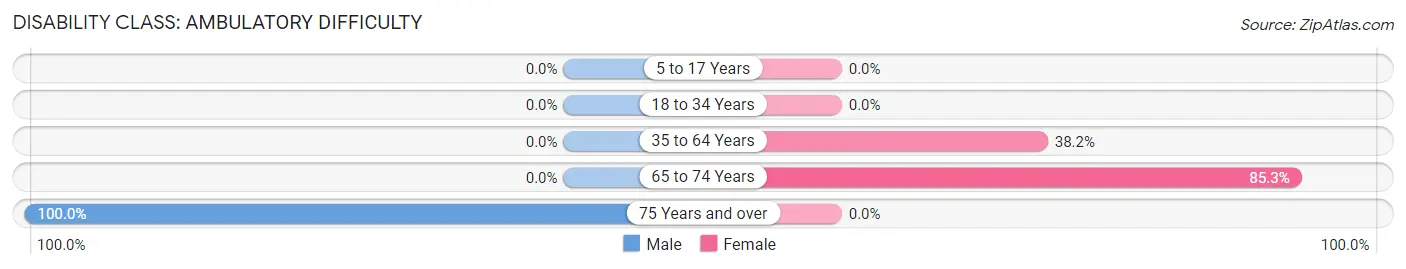
| Age Bracket | Male | Female |
| 5 to 17 Years | 0 (0.0%) | 0 (0.0%) |
| 18 to 34 Years | 0 (0.0%) | 0 (0.0%) |
| 35 to 64 Years | 0 (0.0%) | 13 (38.2%) |
| 65 to 74 Years | 0 (0.0%) | 64 (85.3%) |
| 75 Years and over | 19 (100.0%) | 0 (0.0%) |
Disability Class: Self-Care Difficulty
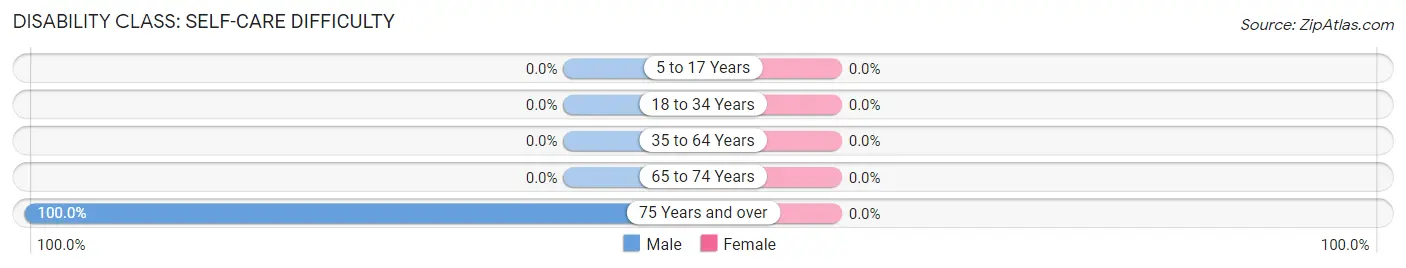
| Age Bracket | Male | Female |
| 5 to 17 Years | 0 (0.0%) | 0 (0.0%) |
| 18 to 34 Years | 0 (0.0%) | 0 (0.0%) |
| 35 to 64 Years | 0 (0.0%) | 0 (0.0%) |
| 65 to 74 Years | 0 (0.0%) | 0 (0.0%) |
| 75 Years and over | 19 (100.0%) | 0 (0.0%) |
Technology Access in St Maurice
Computing Device Access in St Maurice
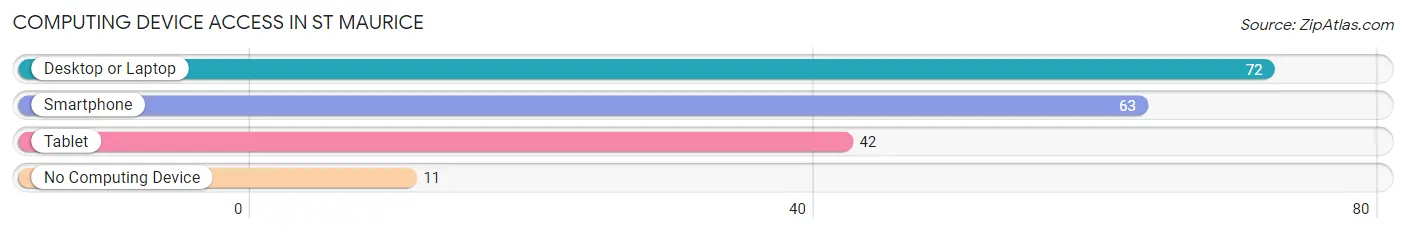
| Device Type | # Households | % Households |
| Desktop or Laptop | 72 | 81.8% |
| Smartphone | 63 | 71.6% |
| Tablet | 42 | 47.7% |
| No Computing Device | 11 | 12.5% |
| Total | 88 | 100.0% |
Internet Access in St Maurice
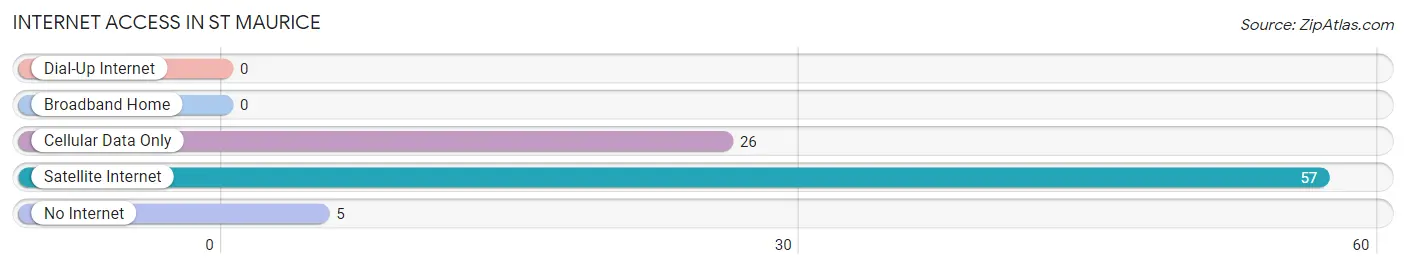
| Internet Type | # Households | % Households |
| Dial-Up Internet | 0 | 0.0% |
| Broadband Home | 0 | 0.0% |
| Cellular Data Only | 26 | 29.5% |
| Satellite Internet | 57 | 64.8% |
| No Internet | 5 | 5.7% |
| Total | 88 | 100.0% |
St Maurice Summary
Maurice is a small town located in the state of Louisiana, United States. It is situated in the parish of St. Landry, and is part of the Opelousas-Eunice Metropolitan Statistical Area. The town has a population of 1,845 people, according to the 2010 census.
History
Maurice was founded in 1883 by a group of French-speaking settlers from the nearby town of Opelousas. The town was named after Maurice, a French saint. The settlers were attracted to the area due to its fertile soil and abundant natural resources.
The town quickly grew and by the early 1900s, it had become a thriving agricultural center. The town was home to several cotton gins, a sawmill, and a brick factory. The town also had a post office, a bank, and a hotel.
In the early 1900s, the town was also home to a large number of African-American residents. Many of these residents worked in the cotton fields and in the brick factory.
Geography
Maurice is located in the southwestern part of the state of Louisiana. It is situated in the parish of St. Landry, and is part of the Opelousas-Eunice Metropolitan Statistical Area. The town is located at an elevation of 33 feet (10 m) above sea level.
The town is located in a rural area, and is surrounded by farmland. The nearest major city is Lafayette, which is located about 40 miles (64 km) to the east.
Economy
Maurice is a small, rural town, and its economy is largely based on agriculture. The town is home to several cotton gins, a sawmill, and a brick factory. The town also has a post office, a bank, and a hotel.
The town is also home to several small businesses, including a grocery store, a hardware store, and a restaurant.
Demographics
According to the 2010 census, the population of Maurice was 1,845 people. The racial makeup of the town was 79.3% White, 19.2% African American, 0.2% Native American, 0.2% Asian, and 0.9% from other races.
The median household income in Maurice was $30,938, and the median family income was $37,813. The per capita income was $15,845. About 17.2% of the population was below the poverty line.
Conclusion
Maurice is a small town located in the state of Louisiana, United States. It is situated in the parish of St. Landry, and is part of the Opelousas-Eunice Metropolitan Statistical Area. The town has a population of 1,845 people, according to the 2010 census. The town is largely agricultural, and its economy is based on cotton gins, sawmills, and brick factories. The town is also home to several small businesses, including a grocery store, a hardware store, and a restaurant. The racial makeup of the town is 79.3% White, 19.2% African American, 0.2% Native American, 0.2% Asian, and 0.9% from other races. The median household income in Maurice was $30,938, and the median family income was $37,813. About 17.2% of the population was below the poverty line.
Common Questions
What is Per Capita Income in St Maurice?
Per Capita income in St Maurice is $15,839.
What is the Median Family Income in St Maurice?
Median Family Income in St Maurice is $23,867.
What is Inequality or Gini Index in St Maurice?
Inequality or Gini Index in St Maurice is 0.55.
What is the Total Population of St Maurice?
Total Population of St Maurice is 330.
What is the Total Male Population of St Maurice?
Total Male Population of St Maurice is 130.
What is the Total Female Population of St Maurice?
Total Female Population of St Maurice is 200.
What is the Ratio of Males per 100 Females in St Maurice?
There are 65.00 Males per 100 Females in St Maurice.
What is the Ratio of Females per 100 Males in St Maurice?
There are 153.85 Females per 100 Males in St Maurice.
What is the Median Population Age in St Maurice?
Median Population Age in St Maurice is 45.8 Years.
What is the Average Family Size in St Maurice
Average Family Size in St Maurice is 3.4 People.
What is the Average Household Size in St Maurice
Average Household Size in St Maurice is 3.8 People.
How Large is the Labor Force in St Maurice?
There are 36 People in the Labor Forcein in St Maurice.
What is the Percentage of People in the Labor Force in St Maurice?
14.8% of People are in the Labor Force in St Maurice.