Fort Jesup, LA Map & Demographics
Fort Jesup Map
Fort Jesup Overview
$25,166
PER CAPITA INCOME
$113,000
AVG FAMILY INCOME
71.0%
WAGE / INCOME GAP [ % ]
29.0¢/ $1
WAGE / INCOME GAP [ $ ]
0.57
INEQUALITY / GINI INDEX
483
TOTAL POPULATION
235
MALE POPULATION
248
FEMALE POPULATION
94.76
MALES / 100 FEMALES
105.53
FEMALES / 100 MALES
27.8
MEDIAN AGE
3.1
AVG FAMILY SIZE
2.1
AVG HOUSEHOLD SIZE
128
LABOR FORCE [ PEOPLE ]
36.2%
PERCENT IN LABOR FORCE
Income in Fort Jesup
Income Overview in Fort Jesup
| Characteristic | Number | Measure |
| Per Capita Income | 483 | $25,166 |
| Median Family Income | 124 | $113,000 |
| Mean Family Income | 124 | $97,561 |
| Median Household Income | 225 | $0 |
| Mean Household Income | 225 | $56,760 |
| Income Deficit | 124 | $0 |
| Wage / Income Gap (%) | 483 | 70.98% |
| Wage / Income Gap ($) | 483 | 29.02¢ per $1 |
| Gini / Inequality Index | 483 | 0.57 |
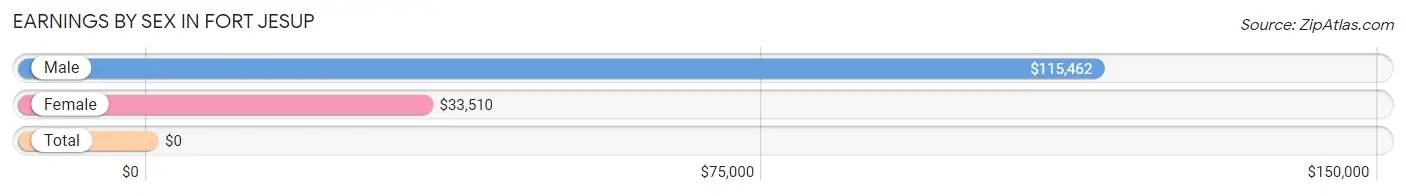
Earnings by Sex in Fort Jesup
| Sex | Number | Average Earnings |
| Male | 75 (58.6%) | $115,462 |
| Female | 53 (41.4%) | $33,510 |
| Total | 128 (100.0%) | $0 |
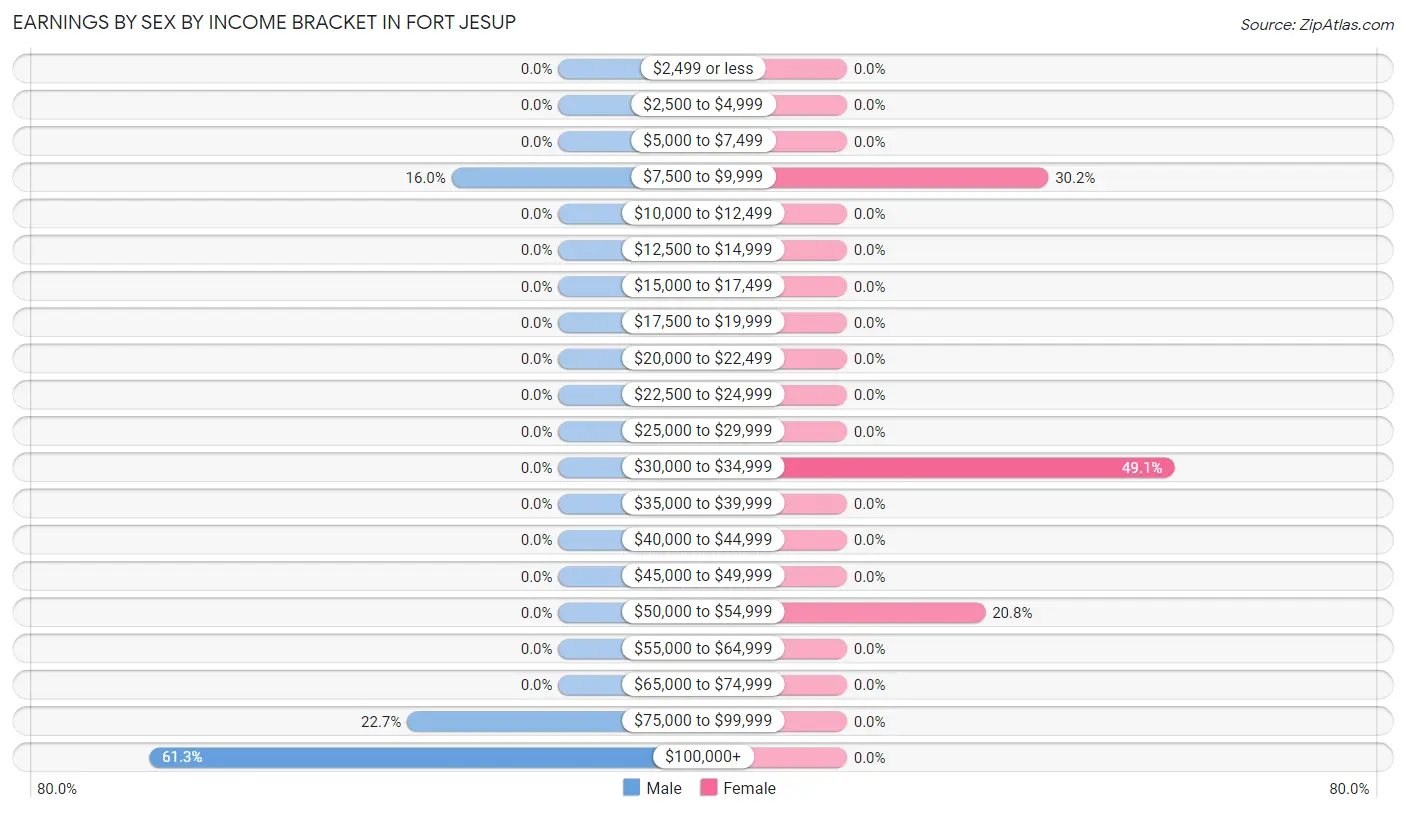
Earnings by Sex by Income Bracket in Fort Jesup
The most common earnings brackets in Fort Jesup are $100,000+ for men (46 | 61.3%) and $30,000 to $34,999 for women (26 | 49.1%).
| Income | Male | Female |
| $2,499 or less | 0 (0.0%) | 0 (0.0%) |
| $2,500 to $4,999 | 0 (0.0%) | 0 (0.0%) |
| $5,000 to $7,499 | 0 (0.0%) | 0 (0.0%) |
| $7,500 to $9,999 | 12 (16.0%) | 16 (30.2%) |
| $10,000 to $12,499 | 0 (0.0%) | 0 (0.0%) |
| $12,500 to $14,999 | 0 (0.0%) | 0 (0.0%) |
| $15,000 to $17,499 | 0 (0.0%) | 0 (0.0%) |
| $17,500 to $19,999 | 0 (0.0%) | 0 (0.0%) |
| $20,000 to $22,499 | 0 (0.0%) | 0 (0.0%) |
| $22,500 to $24,999 | 0 (0.0%) | 0 (0.0%) |
| $25,000 to $29,999 | 0 (0.0%) | 0 (0.0%) |
| $30,000 to $34,999 | 0 (0.0%) | 26 (49.1%) |
| $35,000 to $39,999 | 0 (0.0%) | 0 (0.0%) |
| $40,000 to $44,999 | 0 (0.0%) | 0 (0.0%) |
| $45,000 to $49,999 | 0 (0.0%) | 0 (0.0%) |
| $50,000 to $54,999 | 0 (0.0%) | 11 (20.7%) |
| $55,000 to $64,999 | 0 (0.0%) | 0 (0.0%) |
| $65,000 to $74,999 | 0 (0.0%) | 0 (0.0%) |
| $75,000 to $99,999 | 17 (22.7%) | 0 (0.0%) |
| $100,000+ | 46 (61.3%) | 0 (0.0%) |
| Total | 75 (100.0%) | 53 (100.0%) |
Earnings by Sex by Educational Attainment in Fort Jesup
| Educational Attainment | Male Income | Female Income |
| Less than High School | - | - |
| High School Diploma | - | - |
| College or Associate's Degree | - | - |
| Bachelor's Degree | - | - |
| Graduate Degree | - | - |
| Total | - | - |
Family Income in Fort Jesup
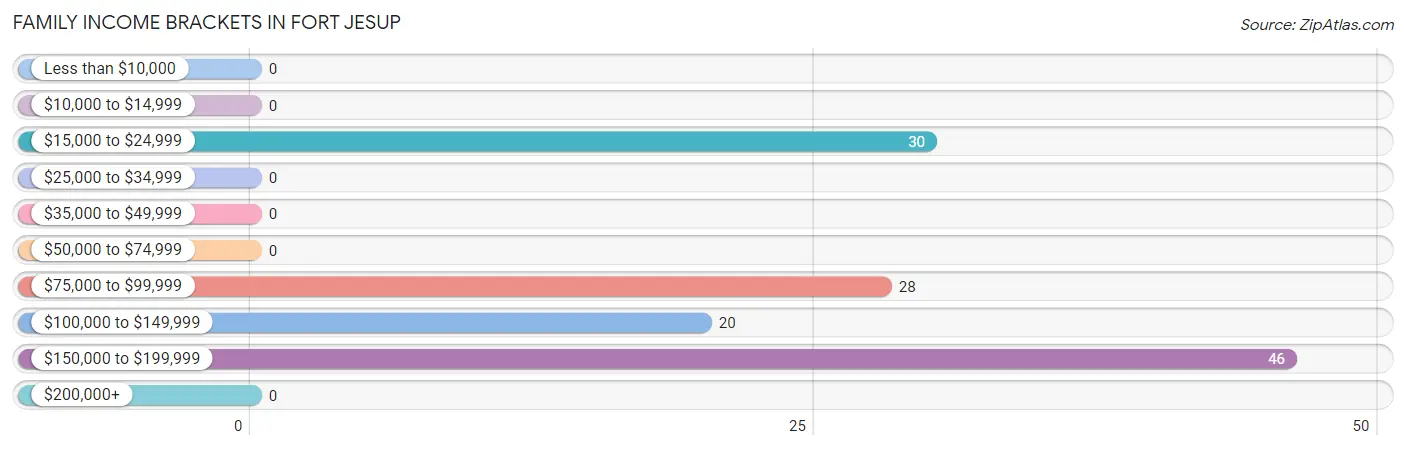
Family Income Brackets in Fort Jesup
According to the Fort Jesup family income data, there are 46 families falling into the $150,000 to $199,999 income range, which is the most common income bracket and makes up 37.1% of all families.
| Income Bracket | # Families | % Families |
| Less than $10,000 | 0 | 0.0% |
| $10,000 to $14,999 | 0 | 0.0% |
| $15,000 to $24,999 | 30 | 24.2% |
| $25,000 to $34,999 | 0 | 0.0% |
| $35,000 to $49,999 | 0 | 0.0% |
| $50,000 to $74,999 | 0 | 0.0% |
| $75,000 to $99,999 | 28 | 22.6% |
| $100,000 to $149,999 | 20 | 16.1% |
| $150,000 to $199,999 | 46 | 37.1% |
| $200,000+ | 0 | 0.0% |
Family Income by Famaliy Size in Fort Jesup
| Income Bracket | # Families | Median Income |
| 2-Person Families | 41 (33.1%) | $0 |
| 3-Person Families | 66 (53.2%) | $0 |
| 4-Person Families | 17 (13.7%) | $0 |
| 5-Person Families | 0 (0.0%) | $0 |
| 6-Person Families | 0 (0.0%) | $0 |
| 7+ Person Families | 0 (0.0%) | $0 |
| Total | 124 (100.0%) | $113,000 |
Family Income by Number of Earners in Fort Jesup
| Number of Earners | # Families | Median Income |
| No Earners | 50 (40.3%) | $0 |
| 1 Earner | 17 (13.7%) | $0 |
| 2 Earners | 57 (46.0%) | $0 |
| 3+ Earners | 0 (0.0%) | $0 |
| Total | 124 (100.0%) | $113,000 |
Household Income in Fort Jesup
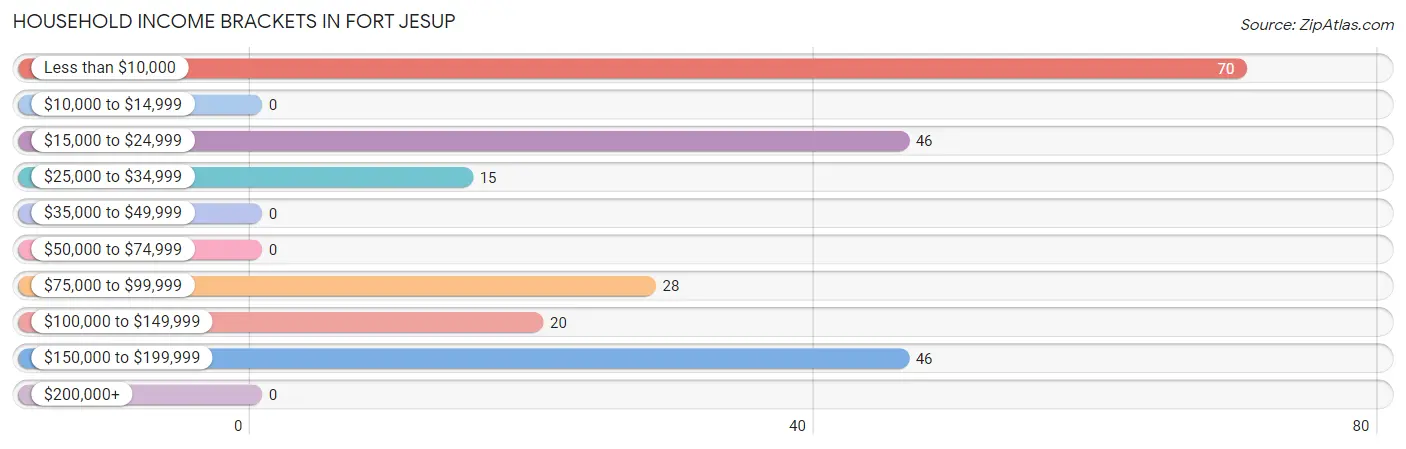
Household Income Brackets in Fort Jesup
With 70 households falling in the category, the less than $10,000 income range is the most frequent in Fort Jesup, accounting for 31.1% of all households.
| Income Bracket | # Households | % Households |
| Less than $10,000 | 70 | 31.1% |
| $10,000 to $14,999 | 0 | 0.0% |
| $15,000 to $24,999 | 46 | 20.4% |
| $25,000 to $34,999 | 15 | 6.7% |
| $35,000 to $49,999 | 0 | 0.0% |
| $50,000 to $74,999 | 0 | 0.0% |
| $75,000 to $99,999 | 28 | 12.4% |
| $100,000 to $149,999 | 20 | 8.9% |
| $150,000 to $199,999 | 46 | 20.4% |
| $200,000+ | 0 | 0.0% |
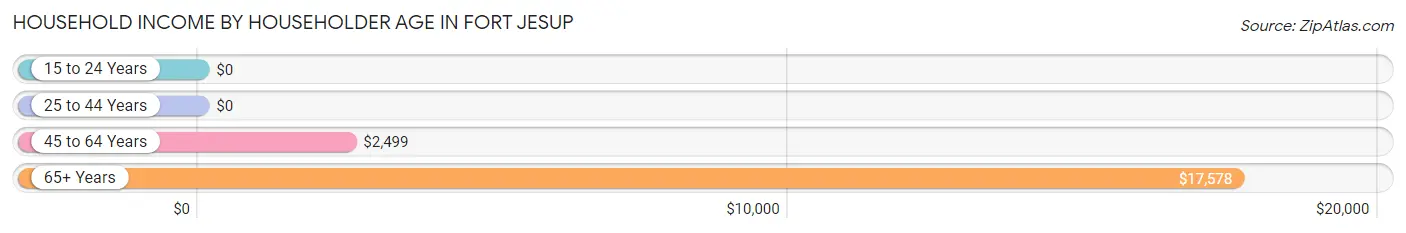
Household Income by Householder Age in Fort Jesup
The median household income in Fort Jesup is $0, with the highest median household income of $17,578 found in the 65+ years age bracket for the primary householder. A total of 61 households (27.1%) fall into this category. Meanwhile, the 15 to 24 years age bracket for the primary householder has the lowest median household income of $0, with 46 households (20.4%) in this group.
| Income Bracket | # Households | Median Income |
| 15 to 24 Years | 46 (20.4%) | $0 |
| 25 to 44 Years | 17 (7.6%) | $0 |
| 45 to 64 Years | 101 (44.9%) | $2,499 |
| 65+ Years | 61 (27.1%) | $17,578 |
| Total | 225 (100.0%) | $0 |
Poverty in Fort Jesup
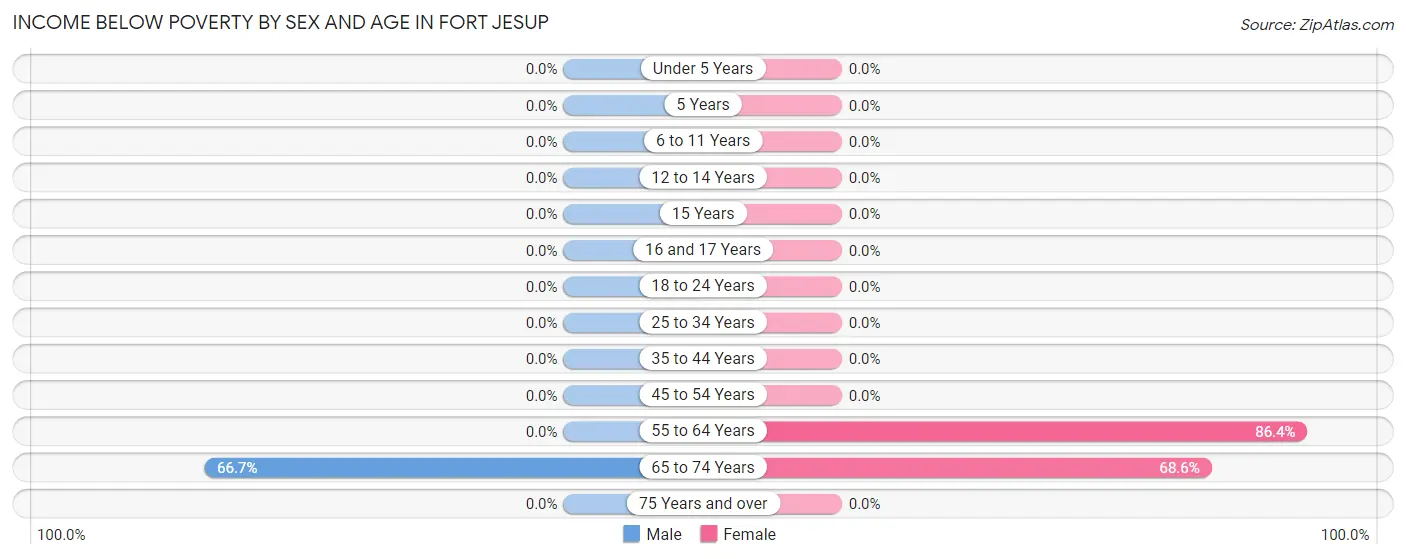
Income Below Poverty by Sex and Age in Fort Jesup
With 12.8% poverty level for males and 42.3% for females among the residents of Fort Jesup, 65 to 74 year old males and 55 to 64 year old females are the most vulnerable to poverty, with 30 males (66.7%) and 70 females (86.4%) in their respective age groups living below the poverty level.
| Age Bracket | Male | Female |
| Under 5 Years | 0 (0.0%) | 0 (0.0%) |
| 5 Years | 0 (0.0%) | 0 (0.0%) |
| 6 to 11 Years | 0 (0.0%) | 0 (0.0%) |
| 12 to 14 Years | 0 (0.0%) | 0 (0.0%) |
| 15 Years | 0 (0.0%) | 0 (0.0%) |
| 16 and 17 Years | 0 (0.0%) | 0 (0.0%) |
| 18 to 24 Years | 0 (0.0%) | 0 (0.0%) |
| 25 to 34 Years | 0 (0.0%) | 0 (0.0%) |
| 35 to 44 Years | 0 (0.0%) | 0 (0.0%) |
| 45 to 54 Years | 0 (0.0%) | 0 (0.0%) |
| 55 to 64 Years | 0 (0.0%) | 70 (86.4%) |
| 65 to 74 Years | 30 (66.7%) | 35 (68.6%) |
| 75 Years and over | 0 (0.0%) | 0 (0.0%) |
| Total | 30 (12.8%) | 105 (42.3%) |
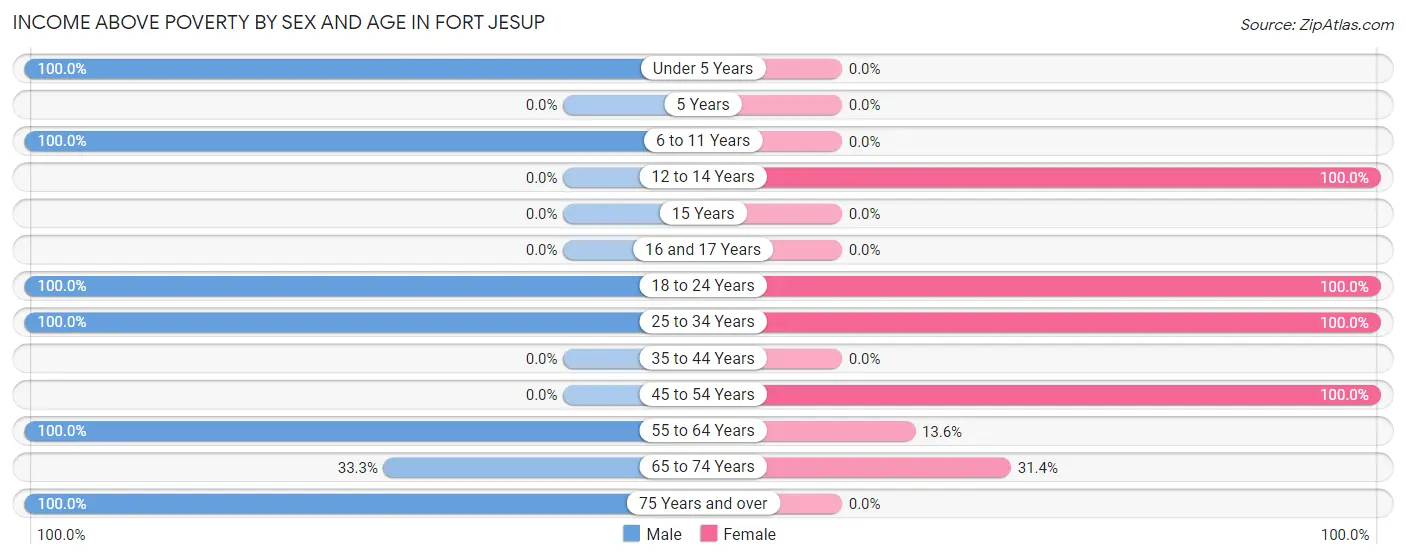
Income Above Poverty by Sex and Age in Fort Jesup
According to the poverty statistics in Fort Jesup, males aged under 5 years and females aged 12 to 14 years are the age groups that are most secure financially, with 100.0% of males and 100.0% of females in these age groups living above the poverty line.
| Age Bracket | Male | Female |
| Under 5 Years | 39 (100.0%) | 0 (0.0%) |
| 5 Years | 0 (0.0%) | 0 (0.0%) |
| 6 to 11 Years | 56 (100.0%) | 0 (0.0%) |
| 12 to 14 Years | 0 (0.0%) | 34 (100.0%) |
| 15 Years | 0 (0.0%) | 0 (0.0%) |
| 16 and 17 Years | 0 (0.0%) | 0 (0.0%) |
| 18 to 24 Years | 46 (100.0%) | 26 (100.0%) |
| 25 to 34 Years | 17 (100.0%) | 29 (100.0%) |
| 35 to 44 Years | 0 (0.0%) | 0 (0.0%) |
| 45 to 54 Years | 0 (0.0%) | 27 (100.0%) |
| 55 to 64 Years | 20 (100.0%) | 11 (13.6%) |
| 65 to 74 Years | 15 (33.3%) | 16 (31.4%) |
| 75 Years and over | 12 (100.0%) | 0 (0.0%) |
| Total | 205 (87.2%) | 143 (57.7%) |
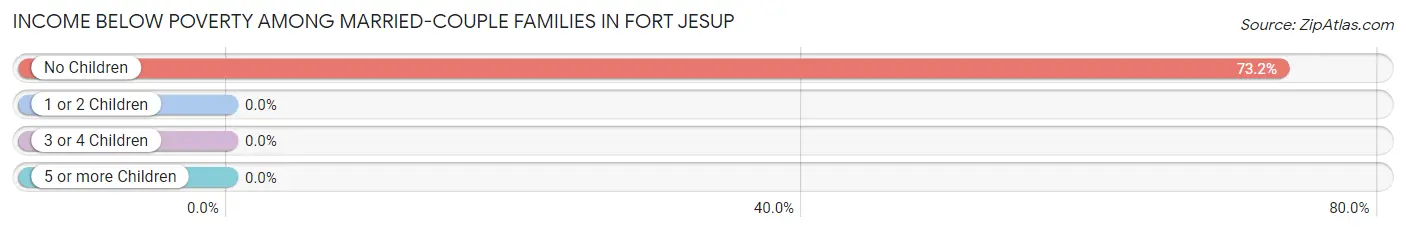
Income Below Poverty Among Married-Couple Families in Fort Jesup
The poverty statistics for married-couple families in Fort Jesup show that 24.2% or 30 of the total 124 families live below the poverty line. Families with no children have the highest poverty rate of 73.2%, comprising of 30 families. On the other hand, families with 1 or 2 children have the lowest poverty rate of 0.0%, which includes 0 families.
| Children | Above Poverty | Below Poverty |
| No Children | 11 (26.8%) | 30 (73.2%) |
| 1 or 2 Children | 83 (100.0%) | 0 (0.0%) |
| 3 or 4 Children | 0 (0.0%) | 0 (0.0%) |
| 5 or more Children | 0 (0.0%) | 0 (0.0%) |
| Total | 94 (75.8%) | 30 (24.2%) |
Income Below Poverty Among Single-Parent Households in Fort Jesup
| Children | Single Father | Single Mother |
| No Children | 0 (0.0%) | 0 (0.0%) |
| 1 or 2 Children | 0 (0.0%) | 0 (0.0%) |
| 3 or 4 Children | 0 (0.0%) | 0 (0.0%) |
| 5 or more Children | 0 (0.0%) | 0 (0.0%) |
| Total | 0 (0.0%) | 0 (0.0%) |
Income Below Poverty Among Married-Couple vs Single-Parent Households in Fort Jesup
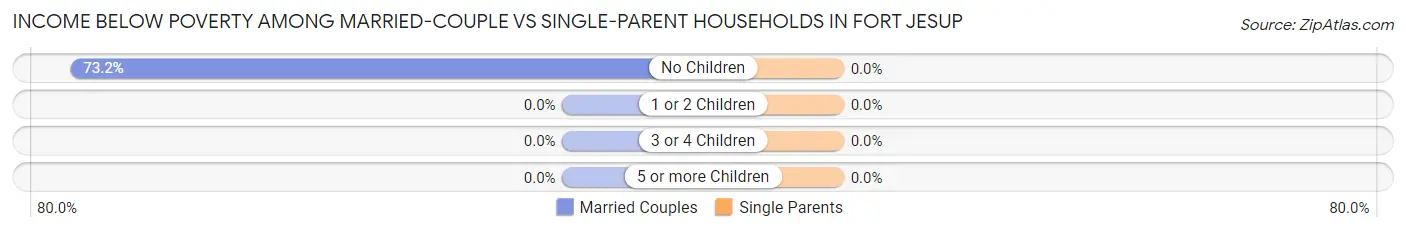
| Children | Married-Couple Families | Single-Parent Households |
| No Children | 30 (73.2%) | 0 (0.0%) |
| 1 or 2 Children | 0 (0.0%) | 0 (0.0%) |
| 3 or 4 Children | 0 (0.0%) | 0 (0.0%) |
| 5 or more Children | 0 (0.0%) | 0 (0.0%) |
| Total | 30 (24.2%) | 0 (0.0%) |
Race in Fort Jesup
The most populous races in Fort Jesup are White / Caucasian (418 | 86.5%), and Black / African American (65 | 13.5%).
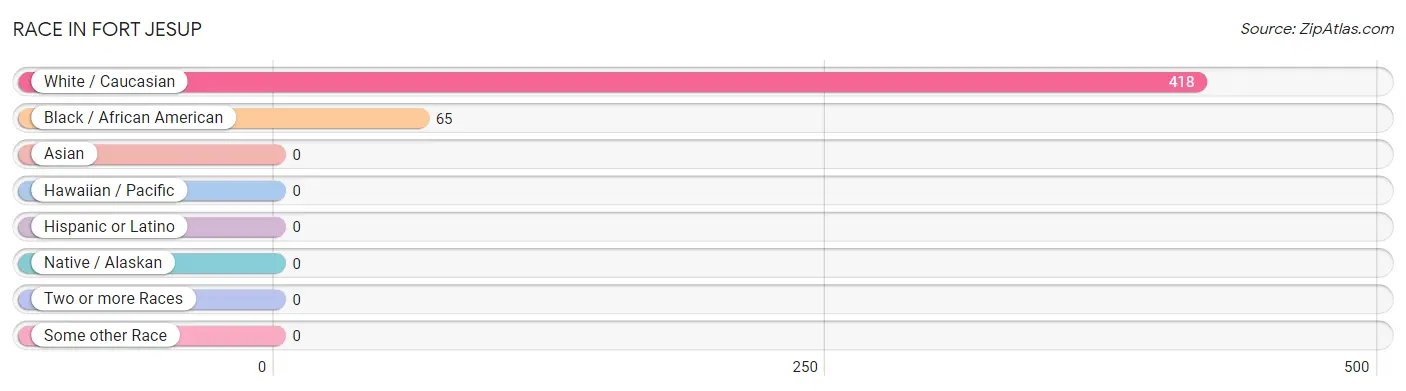
| Race | # Population | % Population |
| Asian | 0 | 0.0% |
| Black / African American | 65 | 13.5% |
| Hawaiian / Pacific | 0 | 0.0% |
| Hispanic or Latino | 0 | 0.0% |
| Native / Alaskan | 0 | 0.0% |
| White / Caucasian | 418 | 86.5% |
| Two or more Races | 0 | 0.0% |
| Some other Race | 0 | 0.0% |
| Total | 483 | 100.0% |
Ancestry in Fort Jesup
The most populous ancestries reported in Fort Jesup are English (124 | 25.7%), Irish (34 | 7.0%), American (31 | 6.4%), French (27 | 5.6%), and Scotch-Irish (27 | 5.6%), together accounting for 50.3% of all Fort Jesup residents.
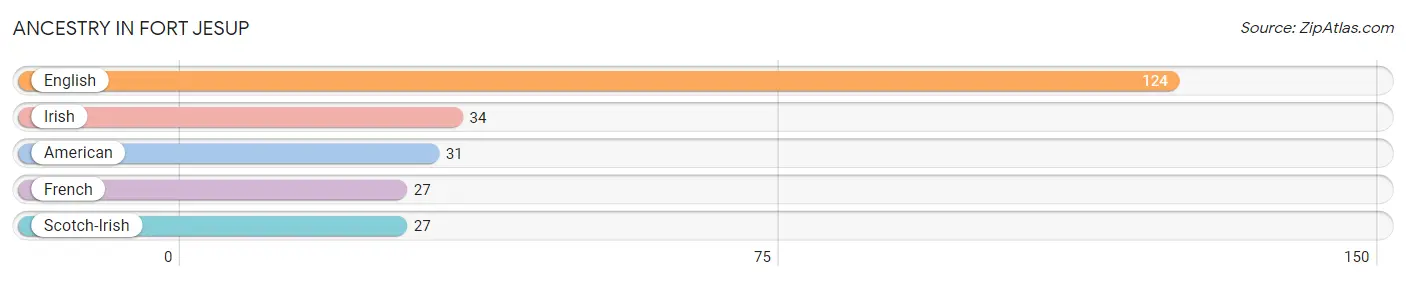
| Ancestry | # Population | % Population |
| American | 31 | 6.4% |
| English | 124 | 25.7% |
| French | 27 | 5.6% |
| Irish | 34 | 7.0% |
| Scotch-Irish | 27 | 5.6% | View All 5 Rows |
Immigrants in Fort Jesup

| Immigration Origin | # Population | % Population | View All 0 Rows |
Sex and Age in Fort Jesup
Sex and Age in Fort Jesup
The most populous age groups in Fort Jesup are 5 to 9 Years (56 | 23.8%) for men and 60 to 64 Years (81 | 32.7%) for women.
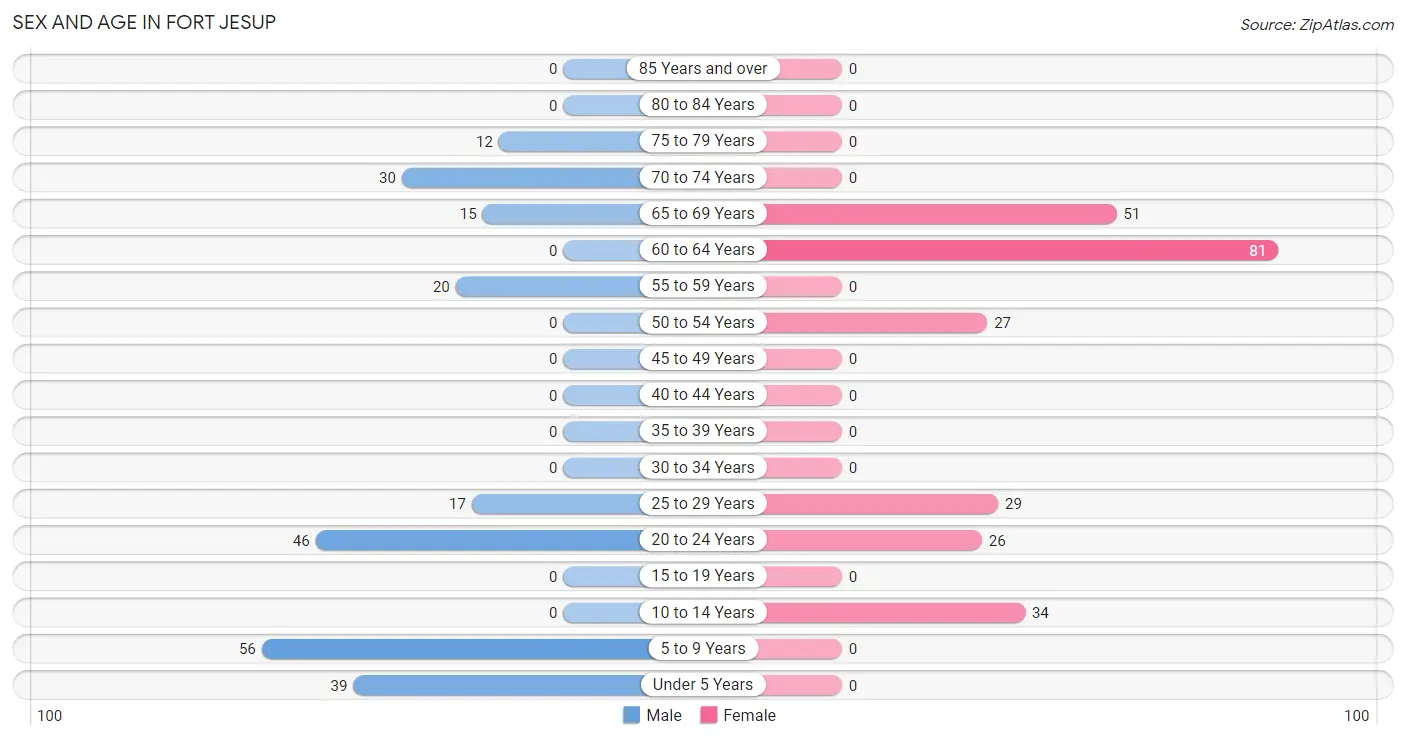
| Age Bracket | Male | Female |
| Under 5 Years | 39 (16.6%) | 0 (0.0%) |
| 5 to 9 Years | 56 (23.8%) | 0 (0.0%) |
| 10 to 14 Years | 0 (0.0%) | 34 (13.7%) |
| 15 to 19 Years | 0 (0.0%) | 0 (0.0%) |
| 20 to 24 Years | 46 (19.6%) | 26 (10.5%) |
| 25 to 29 Years | 17 (7.2%) | 29 (11.7%) |
| 30 to 34 Years | 0 (0.0%) | 0 (0.0%) |
| 35 to 39 Years | 0 (0.0%) | 0 (0.0%) |
| 40 to 44 Years | 0 (0.0%) | 0 (0.0%) |
| 45 to 49 Years | 0 (0.0%) | 0 (0.0%) |
| 50 to 54 Years | 0 (0.0%) | 27 (10.9%) |
| 55 to 59 Years | 20 (8.5%) | 0 (0.0%) |
| 60 to 64 Years | 0 (0.0%) | 81 (32.7%) |
| 65 to 69 Years | 15 (6.4%) | 51 (20.6%) |
| 70 to 74 Years | 30 (12.8%) | 0 (0.0%) |
| 75 to 79 Years | 12 (5.1%) | 0 (0.0%) |
| 80 to 84 Years | 0 (0.0%) | 0 (0.0%) |
| 85 Years and over | 0 (0.0%) | 0 (0.0%) |
| Total | 235 (100.0%) | 248 (100.0%) |
Families and Households in Fort Jesup
Median Family Size in Fort Jesup
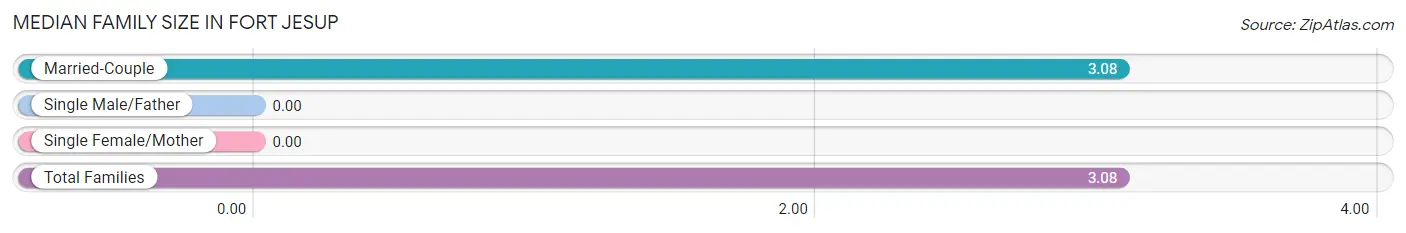
| Family Type | # Families | Family Size |
| Married-Couple | 124 (100.0%) | 3.08 |
| Single Male/Father | 0 (0.0%) | - |
| Single Female/Mother | 0 (0.0%) | - |
| Total Families | 124 (100.0%) | 3.08 |
Median Household Size in Fort Jesup
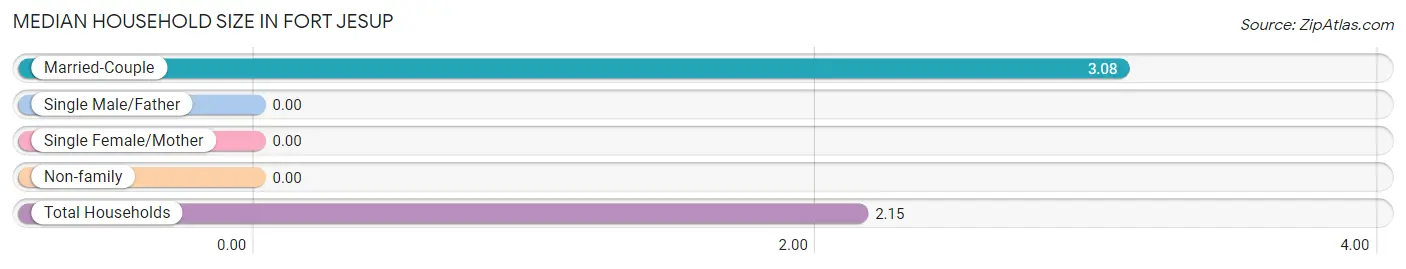
| Household Type | # Households | Household Size |
| Married-Couple | 124 (55.1%) | 3.08 |
| Single Male/Father | 0 (0.0%) | - |
| Single Female/Mother | 0 (0.0%) | - |
| Non-family | 101 (44.9%) | - |
| Total Households | 225 (100.0%) | 2.15 |
Household Size by Marriage Status in Fort Jesup
Out of a total of 225 households in Fort Jesup, 124 (55.1%) are family households, while 101 (44.9%) are nonfamily households. The most numerous type of family households are 3-person households, comprising 66, and the most common type of nonfamily households are 1-person households, comprising 101.
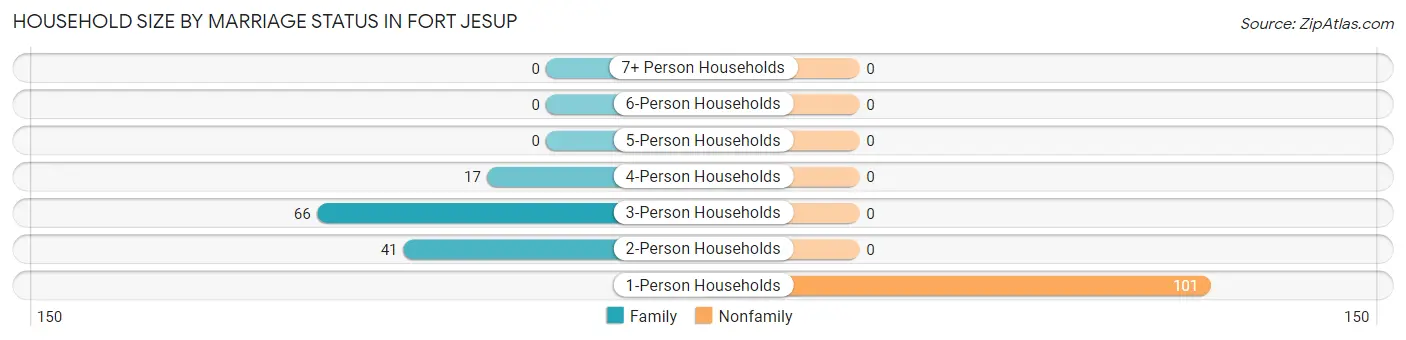
| Household Size | Family Households | Nonfamily Households |
| 1-Person Households | - | 101 (44.9%) |
| 2-Person Households | 41 (18.2%) | 0 (0.0%) |
| 3-Person Households | 66 (29.3%) | 0 (0.0%) |
| 4-Person Households | 17 (7.6%) | 0 (0.0%) |
| 5-Person Households | 0 (0.0%) | 0 (0.0%) |
| 6-Person Households | 0 (0.0%) | 0 (0.0%) |
| 7+ Person Households | 0 (0.0%) | 0 (0.0%) |
| Total | 124 (55.1%) | 101 (44.9%) |
Female Fertility in Fort Jesup
Fertility by Age in Fort Jesup
| Age Bracket | Women with Births | Births / 1,000 Women |
| 15 to 19 years | 0 (0.0%) | 0.0 |
| 20 to 34 years | 0 (0.0%) | 0.0 |
| 35 to 50 years | 0 (0.0%) | 0.0 |
| Total | 0 (0.0%) | 0.0 |
Fertility by Age by Marriage Status in Fort Jesup
| Age Bracket | Married | Unmarried |
| 15 to 19 years | 0 (0.0%) | 0 (0.0%) |
| 20 to 34 years | 0 (0.0%) | 0 (0.0%) |
| 35 to 50 years | 0 (0.0%) | 0 (0.0%) |
| Total | 0 (0.0%) | 0 (0.0%) |
Fertility by Education in Fort Jesup
| Educational Attainment | Women with Births | Births / 1,000 Women |
| Less than High School | 0 (0.0%) | 0.0 |
| High School Diploma | 0 (0.0%) | 0.0 |
| College or Associate's Degree | 0 (0.0%) | 0.0 |
| Bachelor's Degree | 0 (0.0%) | 0.0 |
| Graduate Degree | 0 (0.0%) | 0.0 |
| Total | 0 (0.0%) | 0.0 |
Fertility by Education by Marriage Status in Fort Jesup
| Educational Attainment | Married | Unmarried |
| Less than High School | 0 (0.0%) | 0 (0.0%) |
| High School Diploma | 0 (0.0%) | 0 (0.0%) |
| College or Associate's Degree | 0 (0.0%) | 0 (0.0%) |
| Bachelor's Degree | 0 (0.0%) | 0 (0.0%) |
| Graduate Degree | 0 (0.0%) | 0 (0.0%) |
| Total | 0 (0.0%) | 0 (0.0%) |
Employment Characteristics in Fort Jesup
Employment by Class of Employer in Fort Jesup
Among the 128 employed individuals in Fort Jesup, private company employees (79 | 61.7%), local government employees (37 | 28.9%), and self-employed (incorporated) (12 | 9.4%) make up the most common classes of employment.
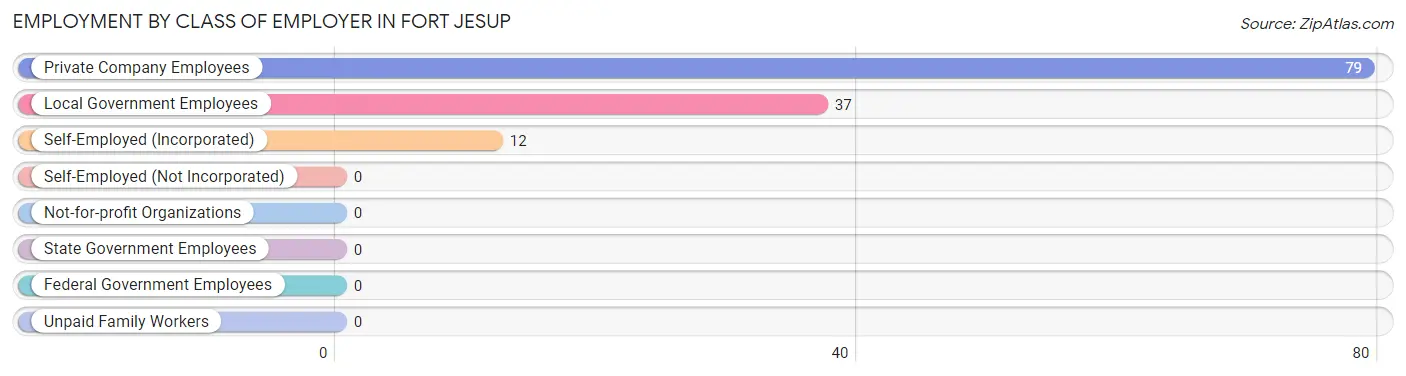
| Employer Class | # Employees | % Employees |
| Private Company Employees | 79 | 61.7% |
| Self-Employed (Incorporated) | 12 | 9.4% |
| Self-Employed (Not Incorporated) | 0 | 0.0% |
| Not-for-profit Organizations | 0 | 0.0% |
| Local Government Employees | 37 | 28.9% |
| State Government Employees | 0 | 0.0% |
| Federal Government Employees | 0 | 0.0% |
| Unpaid Family Workers | 0 | 0.0% |
| Total | 128 | 100.0% |
Employment Status by Age in Fort Jesup
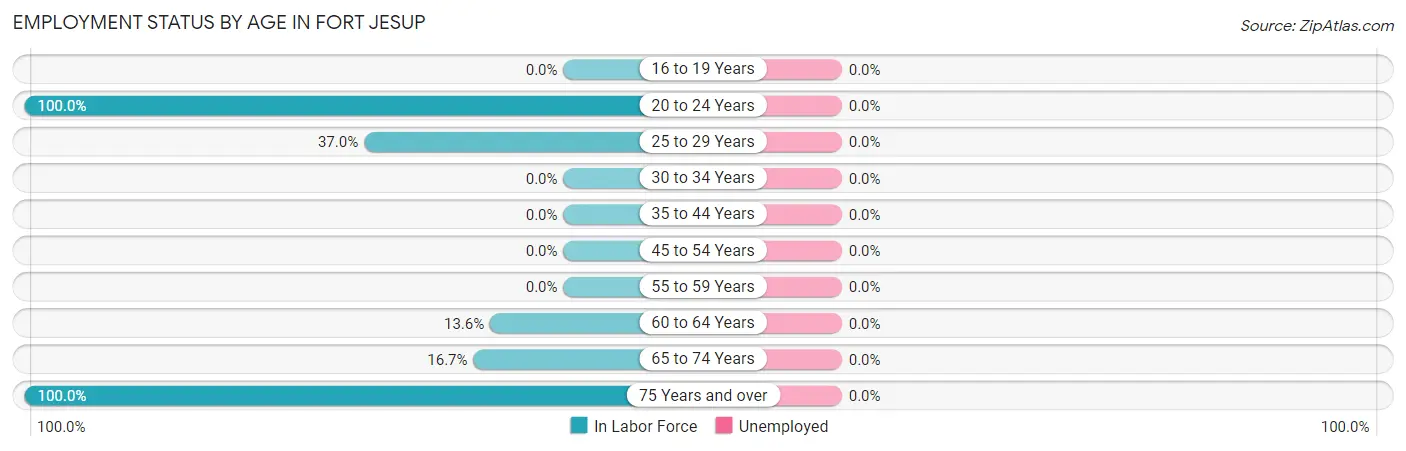
| Age Bracket | In Labor Force | Unemployed |
| 16 to 19 Years | 0 (0.0%) | 0 (0.0%) |
| 20 to 24 Years | 72 (100.0%) | 0 (0.0%) |
| 25 to 29 Years | 17 (37.0%) | 0 (0.0%) |
| 30 to 34 Years | 0 (0.0%) | 0 (0.0%) |
| 35 to 44 Years | 0 (0.0%) | 0 (0.0%) |
| 45 to 54 Years | 0 (0.0%) | 0 (0.0%) |
| 55 to 59 Years | 0 (0.0%) | 0 (0.0%) |
| 60 to 64 Years | 11 (13.6%) | 0 (0.0%) |
| 65 to 74 Years | 16 (16.7%) | 0 (0.0%) |
| 75 Years and over | 12 (100.0%) | 0 (0.0%) |
| Total | 128 (36.2%) | 0 (0.0%) |
Employment Status by Educational Attainment in Fort Jesup
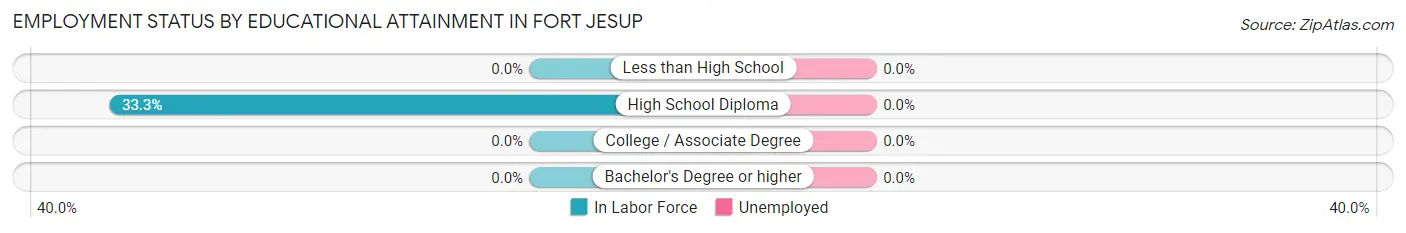
| Educational Attainment | In Labor Force | Unemployed |
| Less than High School | 0 (0.0%) | 0 (0.0%) |
| High School Diploma | 28 (33.3%) | 0 (0.0%) |
| College / Associate Degree | 0 (0.0%) | 0 (0.0%) |
| Bachelor's Degree or higher | 0 (0.0%) | 0 (0.0%) |
| Total | 28 (16.1%) | 0 (0.0%) |
Employment Occupations by Sex in Fort Jesup
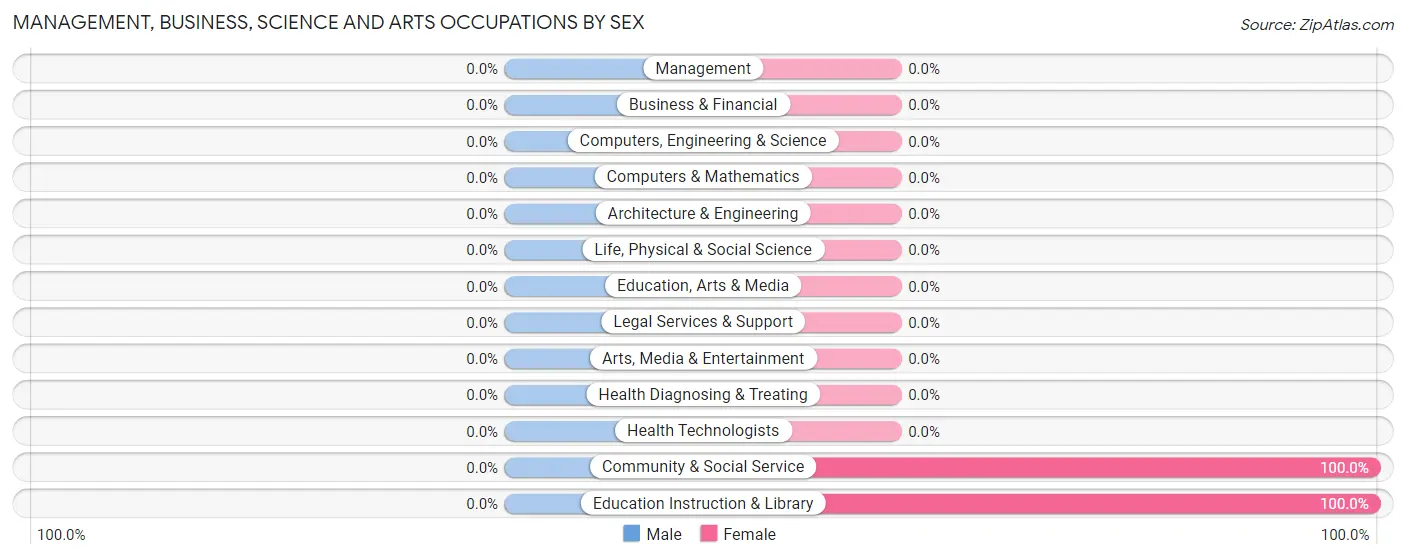
Management, Business, Science and Arts Occupations
The most common Management, Business, Science and Arts occupations in Fort Jesup are Community & Social Service (26 | 20.3%), and Education Instruction & Library (26 | 20.3%).
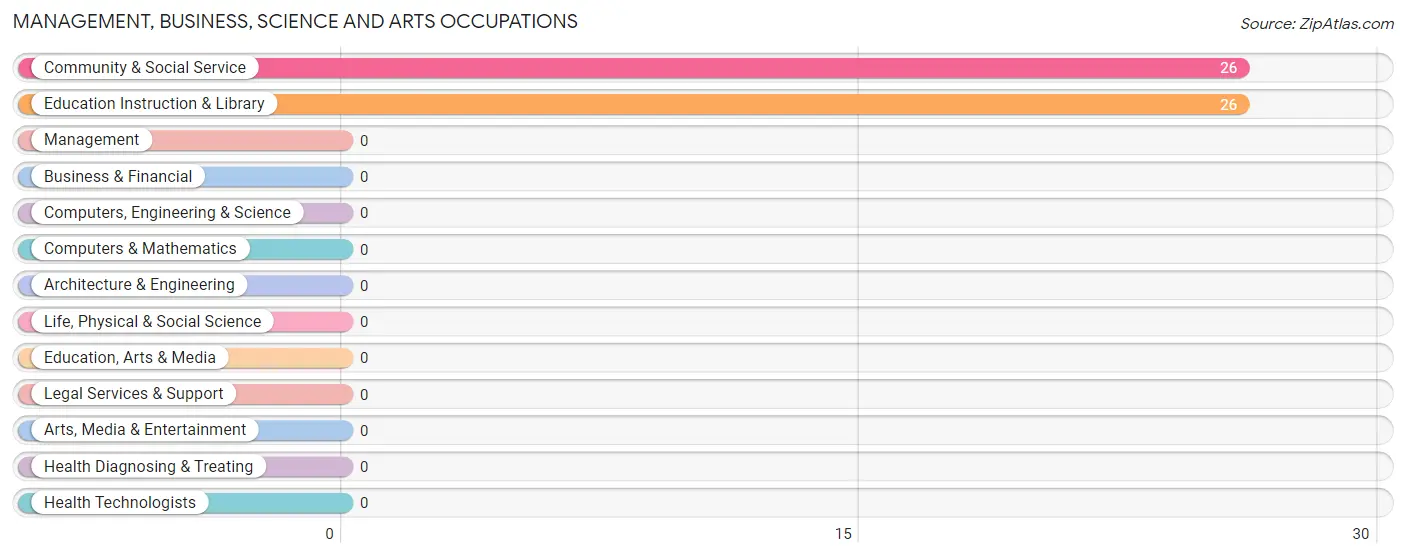
Management, Business, Science and Arts Occupations by Sex
| Occupation | Male | Female |
| Management | 0 (0.0%) | 0 (0.0%) |
| Business & Financial | 0 (0.0%) | 0 (0.0%) |
| Computers, Engineering & Science | 0 (0.0%) | 0 (0.0%) |
| Computers & Mathematics | 0 (0.0%) | 0 (0.0%) |
| Architecture & Engineering | 0 (0.0%) | 0 (0.0%) |
| Life, Physical & Social Science | 0 (0.0%) | 0 (0.0%) |
| Community & Social Service | 0 (0.0%) | 26 (100.0%) |
| Education, Arts & Media | 0 (0.0%) | 0 (0.0%) |
| Legal Services & Support | 0 (0.0%) | 0 (0.0%) |
| Education Instruction & Library | 0 (0.0%) | 26 (100.0%) |
| Arts, Media & Entertainment | 0 (0.0%) | 0 (0.0%) |
| Health Diagnosing & Treating | 0 (0.0%) | 0 (0.0%) |
| Health Technologists | 0 (0.0%) | 0 (0.0%) |
| Total (Category) | 0 (0.0%) | 26 (100.0%) |
| Total (Overall) | 75 (58.6%) | 53 (41.4%) |
Services Occupations
Services Occupations by Sex
| Occupation | Male | Female |
| Healthcare Support | 0 (0.0%) | 0 (0.0%) |
| Security & Protection | 0 (0.0%) | 0 (0.0%) |
| Firefighting & Prevention | 0 (0.0%) | 0 (0.0%) |
| Law Enforcement | 0 (0.0%) | 0 (0.0%) |
| Food Preparation & Serving | 0 (0.0%) | 0 (0.0%) |
| Cleaning & Maintenance | 0 (0.0%) | 0 (0.0%) |
| Personal Care & Service | 0 (0.0%) | 0 (0.0%) |
| Total (Category) | 0 (0.0%) | 0 (0.0%) |
| Total (Overall) | 75 (58.6%) | 53 (41.4%) |
Sales and Office Occupations
The most common Sales and Office occupations in Fort Jesup are , and Office & Administration (11 | 8.6%).
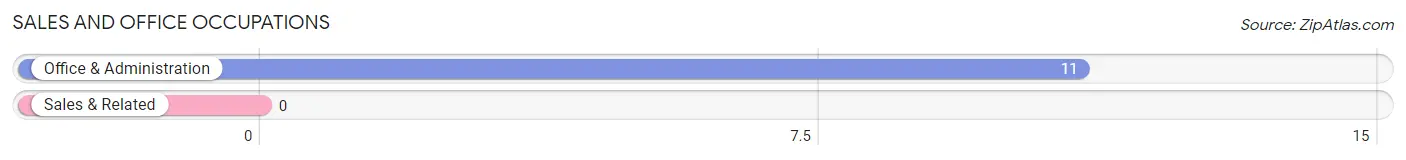
Sales and Office Occupations by Sex
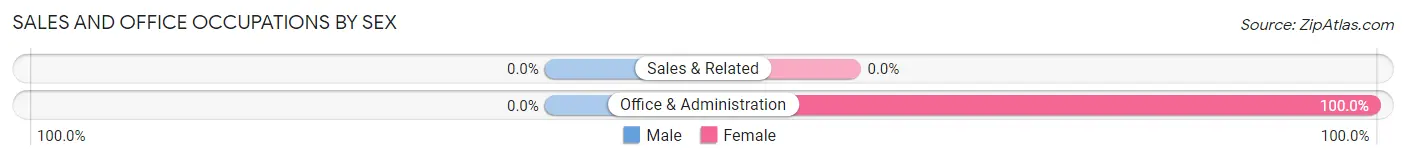
| Occupation | Male | Female |
| Sales & Related | 0 (0.0%) | 0 (0.0%) |
| Office & Administration | 0 (0.0%) | 11 (100.0%) |
| Total (Category) | 0 (0.0%) | 11 (100.0%) |
| Total (Overall) | 75 (58.6%) | 53 (41.4%) |
Natural Resources, Construction and Maintenance Occupations
The most common Natural Resources, Construction and Maintenance occupations in Fort Jesup are , and Construction & Extraction (46 | 35.9%).
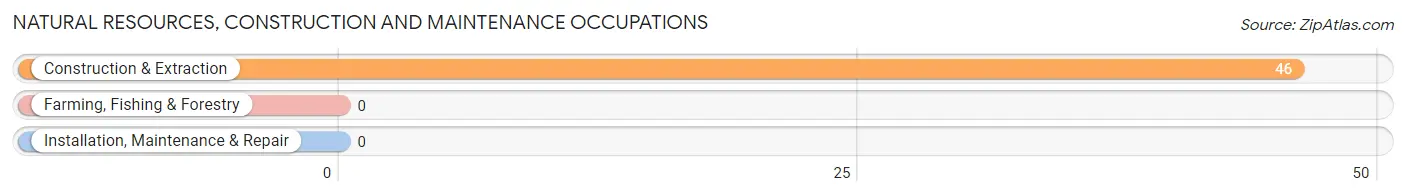
Natural Resources, Construction and Maintenance Occupations by Sex
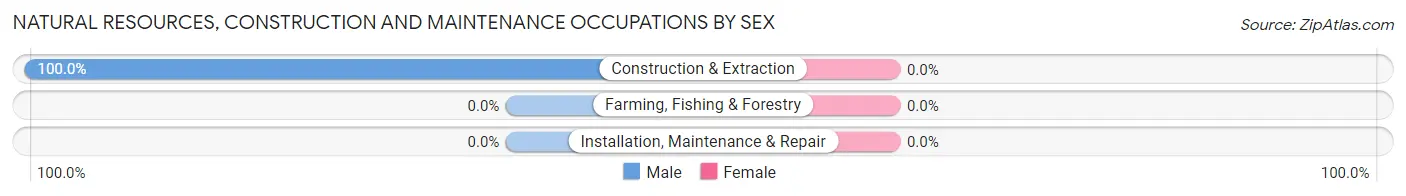
| Occupation | Male | Female |
| Farming, Fishing & Forestry | 0 (0.0%) | 0 (0.0%) |
| Construction & Extraction | 46 (100.0%) | 0 (0.0%) |
| Installation, Maintenance & Repair | 0 (0.0%) | 0 (0.0%) |
| Total (Category) | 46 (100.0%) | 0 (0.0%) |
| Total (Overall) | 75 (58.6%) | 53 (41.4%) |
Production, Transportation and Moving Occupations
The most common Production, Transportation and Moving occupations in Fort Jesup are Production (33 | 25.8%), and Transportation (12 | 9.4%).
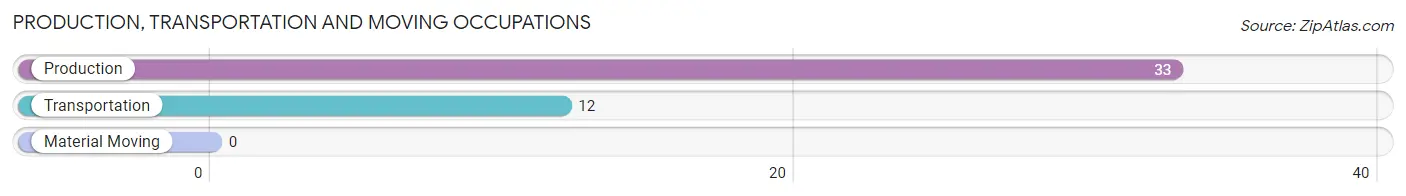
Production, Transportation and Moving Occupations by Sex
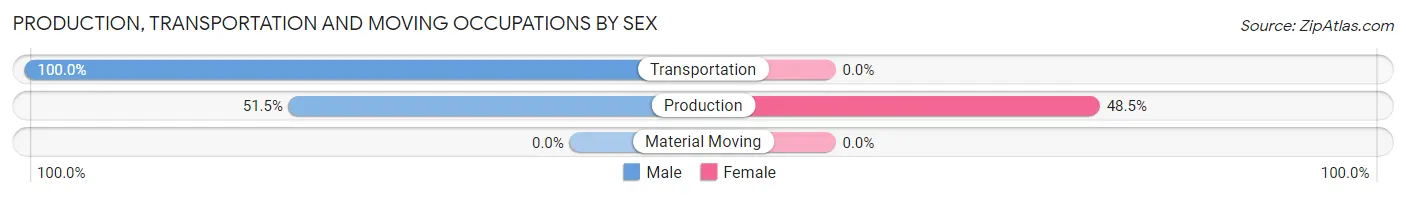
| Occupation | Male | Female |
| Production | 17 (51.5%) | 16 (48.5%) |
| Transportation | 12 (100.0%) | 0 (0.0%) |
| Material Moving | 0 (0.0%) | 0 (0.0%) |
| Total (Category) | 29 (64.4%) | 16 (35.6%) |
| Total (Overall) | 75 (58.6%) | 53 (41.4%) |
Employment Industries by Sex in Fort Jesup
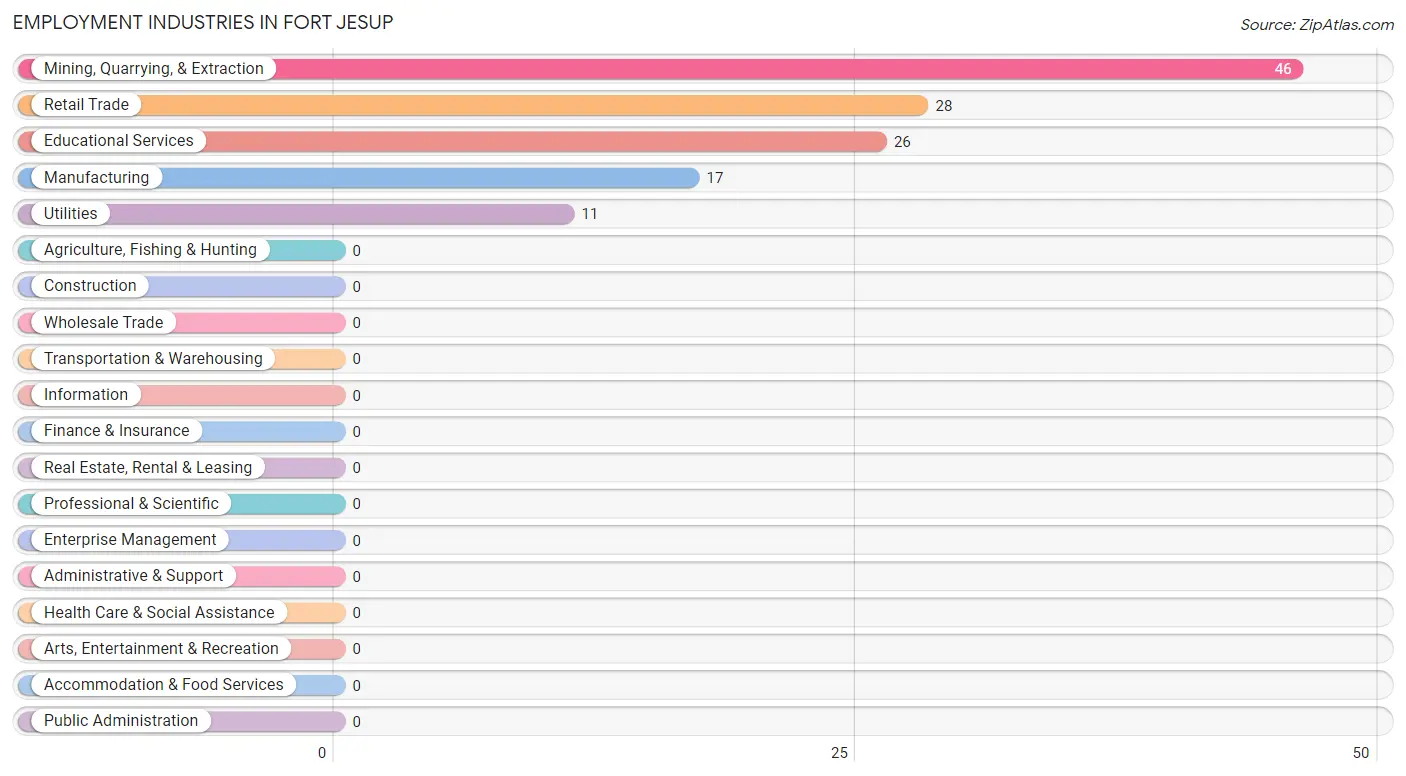
Employment Industries in Fort Jesup
The major employment industries in Fort Jesup include Mining, Quarrying, & Extraction (46 | 35.9%), Retail Trade (28 | 21.9%), Educational Services (26 | 20.3%), Manufacturing (17 | 13.3%), and Utilities (11 | 8.6%).
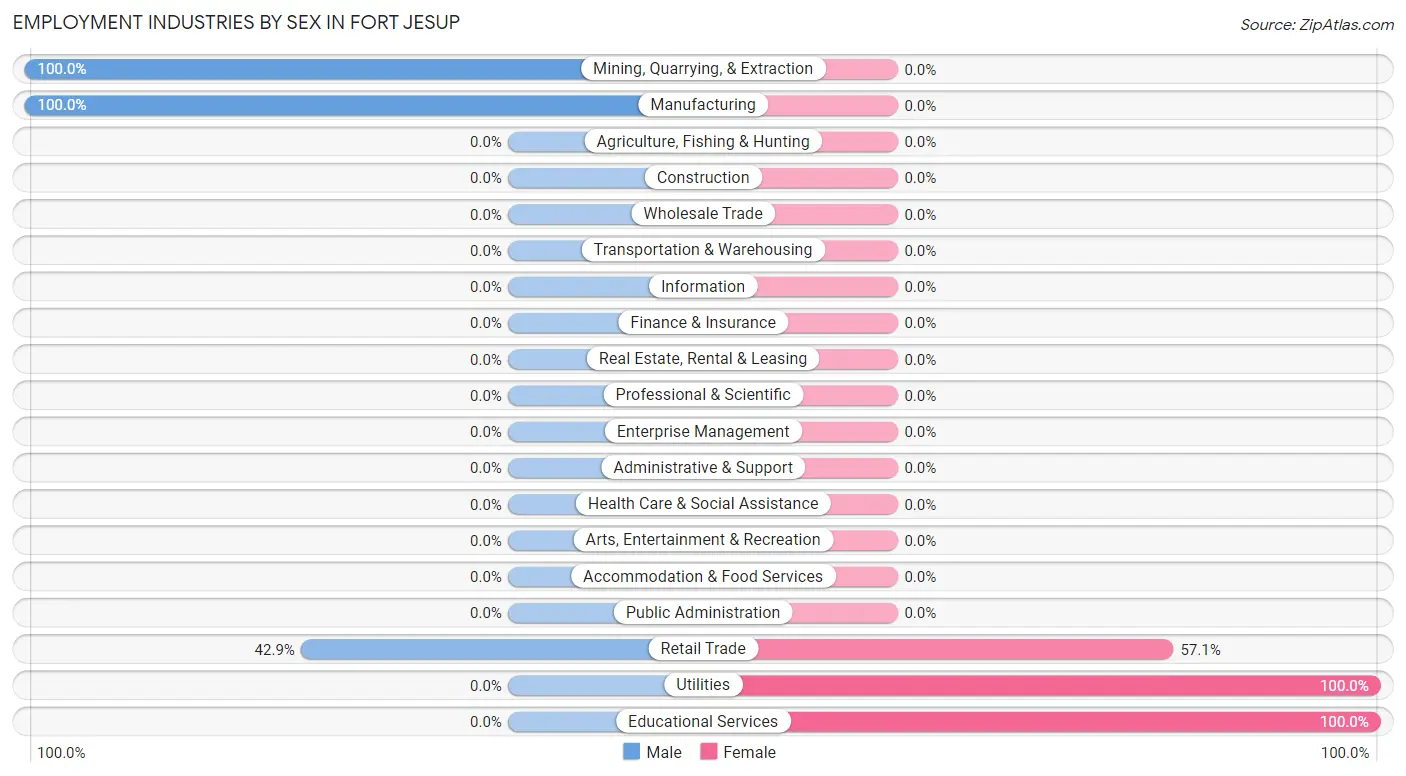
Employment Industries by Sex in Fort Jesup
The Fort Jesup industries that see more men than women are Mining, Quarrying, & Extraction (100.0%), Manufacturing (100.0%), and Retail Trade (42.9%), whereas the industries that tend to have a higher number of women are Utilities (100.0%), Educational Services (100.0%), and Retail Trade (57.1%).
| Industry | Male | Female |
| Agriculture, Fishing & Hunting | 0 (0.0%) | 0 (0.0%) |
| Mining, Quarrying, & Extraction | 46 (100.0%) | 0 (0.0%) |
| Construction | 0 (0.0%) | 0 (0.0%) |
| Manufacturing | 17 (100.0%) | 0 (0.0%) |
| Wholesale Trade | 0 (0.0%) | 0 (0.0%) |
| Retail Trade | 12 (42.9%) | 16 (57.1%) |
| Transportation & Warehousing | 0 (0.0%) | 0 (0.0%) |
| Utilities | 0 (0.0%) | 11 (100.0%) |
| Information | 0 (0.0%) | 0 (0.0%) |
| Finance & Insurance | 0 (0.0%) | 0 (0.0%) |
| Real Estate, Rental & Leasing | 0 (0.0%) | 0 (0.0%) |
| Professional & Scientific | 0 (0.0%) | 0 (0.0%) |
| Enterprise Management | 0 (0.0%) | 0 (0.0%) |
| Administrative & Support | 0 (0.0%) | 0 (0.0%) |
| Educational Services | 0 (0.0%) | 26 (100.0%) |
| Health Care & Social Assistance | 0 (0.0%) | 0 (0.0%) |
| Arts, Entertainment & Recreation | 0 (0.0%) | 0 (0.0%) |
| Accommodation & Food Services | 0 (0.0%) | 0 (0.0%) |
| Public Administration | 0 (0.0%) | 0 (0.0%) |
| Total | 75 (58.6%) | 53 (41.4%) |
Education in Fort Jesup
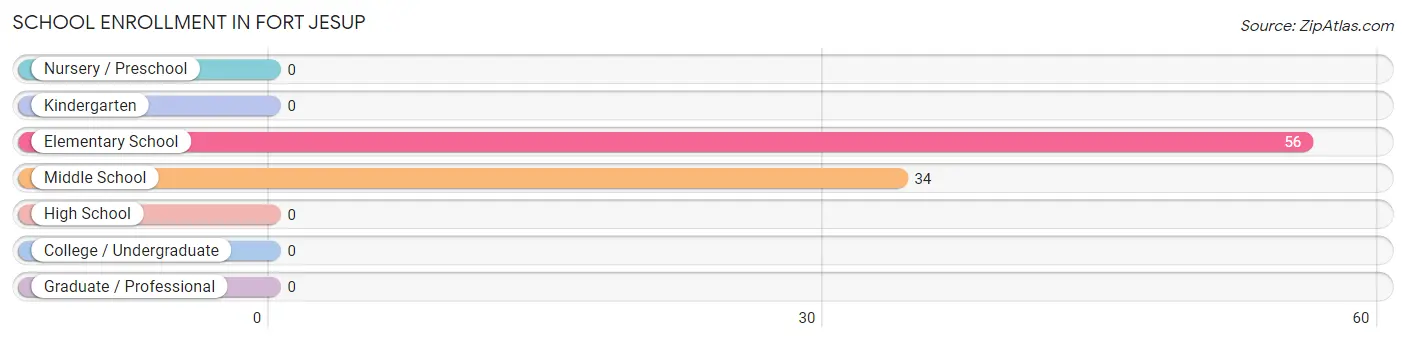
School Enrollment in Fort Jesup
The most common levels of schooling among the 90 students in Fort Jesup are elementary school (56 | 62.2%), and middle school (34 | 37.8%).
| School Level | # Students | % Students |
| Nursery / Preschool | 0 | 0.0% |
| Kindergarten | 0 | 0.0% |
| Elementary School | 56 | 62.2% |
| Middle School | 34 | 37.8% |
| High School | 0 | 0.0% |
| College / Undergraduate | 0 | 0.0% |
| Graduate / Professional | 0 | 0.0% |
| Total | 90 | 100.0% |
School Enrollment by Age by Funding Source in Fort Jesup
Out of a total of 90 students who are enrolled in schools in Fort Jesup, 34 (37.8%) attend a private institution, while the remaining 56 (62.2%) are enrolled in public schools. The age group of 10 to 14 year olds has the highest likelihood of being enrolled in private schools, with 34 (100.0% in the age bracket) enrolled. Conversely, the age group of 5 to 9 year old has the lowest likelihood of being enrolled in a private school, with 56 (100.0% in the age bracket) attending a public institution.
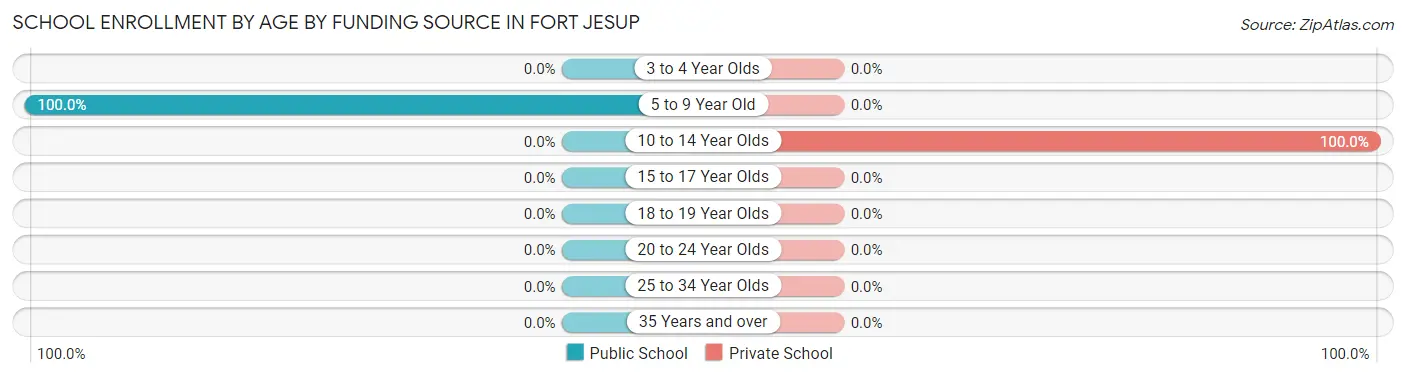
| Age Bracket | Public School | Private School |
| 3 to 4 Year Olds | 0 (0.0%) | 0 (0.0%) |
| 5 to 9 Year Old | 56 (100.0%) | 0 (0.0%) |
| 10 to 14 Year Olds | 0 (0.0%) | 34 (100.0%) |
| 15 to 17 Year Olds | 0 (0.0%) | 0 (0.0%) |
| 18 to 19 Year Olds | 0 (0.0%) | 0 (0.0%) |
| 20 to 24 Year Olds | 0 (0.0%) | 0 (0.0%) |
| 25 to 34 Year Olds | 0 (0.0%) | 0 (0.0%) |
| 35 Years and over | 0 (0.0%) | 0 (0.0%) |
| Total | 56 (62.2%) | 34 (37.8%) |
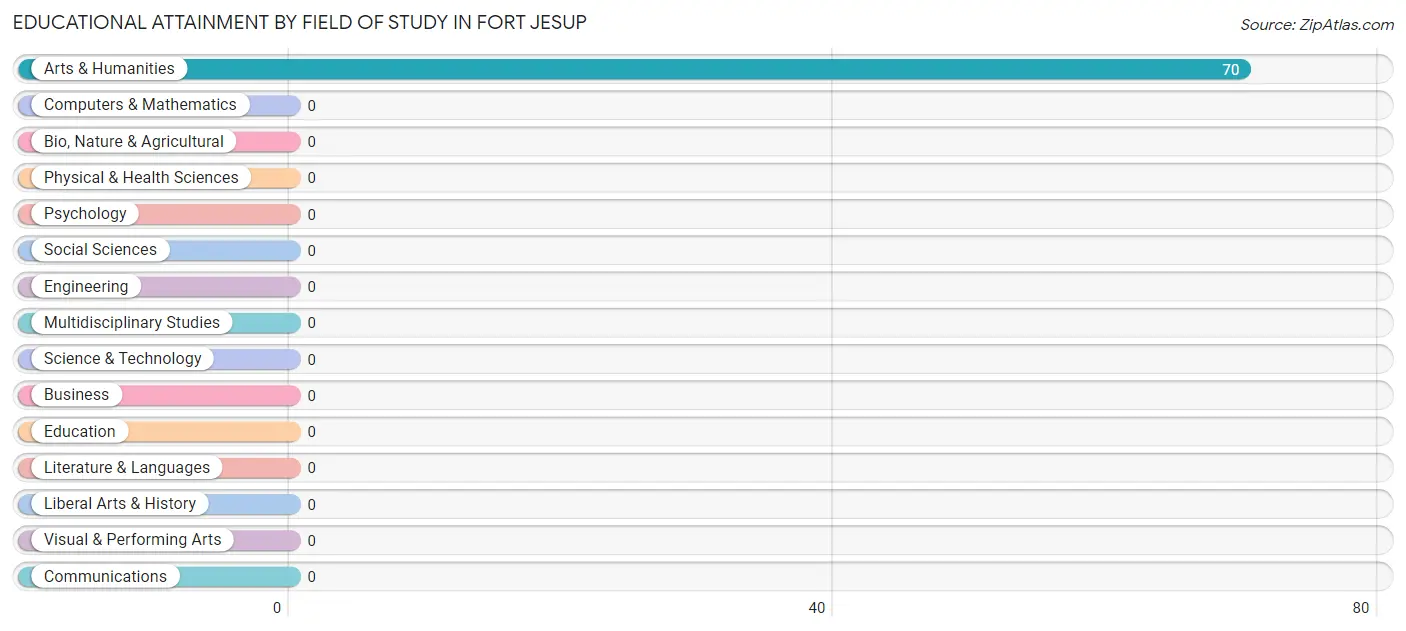
Educational Attainment by Field of Study in Fort Jesup
, and arts & humanities (70 | 100.0%) are the most common fields of study among 70 individuals in Fort Jesup who have obtained a bachelor's degree or higher.
| Field of Study | # Graduates | % Graduates |
| Computers & Mathematics | 0 | 0.0% |
| Bio, Nature & Agricultural | 0 | 0.0% |
| Physical & Health Sciences | 0 | 0.0% |
| Psychology | 0 | 0.0% |
| Social Sciences | 0 | 0.0% |
| Engineering | 0 | 0.0% |
| Multidisciplinary Studies | 0 | 0.0% |
| Science & Technology | 0 | 0.0% |
| Business | 0 | 0.0% |
| Education | 0 | 0.0% |
| Literature & Languages | 0 | 0.0% |
| Liberal Arts & History | 0 | 0.0% |
| Visual & Performing Arts | 0 | 0.0% |
| Communications | 0 | 0.0% |
| Arts & Humanities | 70 | 100.0% |
| Total | 70 | 100.0% |
Transportation & Commute in Fort Jesup
Vehicle Availability by Sex in Fort Jesup
The most prevalent vehicle ownership categories in Fort Jesup are males with 2 vehicles (75, accounting for 100.0%) and females with 2 vehicles (53, making up 141.5%).
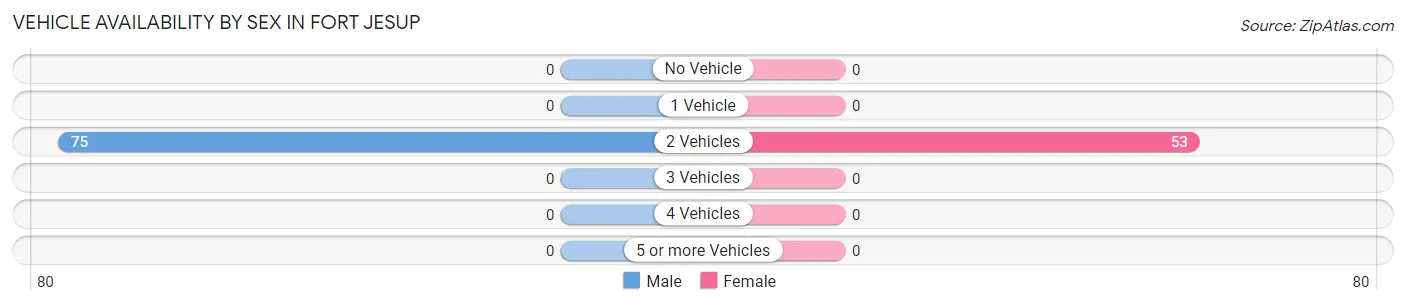
| Vehicles Available | Male | Female |
| No Vehicle | 0 (0.0%) | 0 (0.0%) |
| 1 Vehicle | 0 (0.0%) | 0 (0.0%) |
| 2 Vehicles | 75 (100.0%) | 53 (100.0%) |
| 3 Vehicles | 0 (0.0%) | 0 (0.0%) |
| 4 Vehicles | 0 (0.0%) | 0 (0.0%) |
| 5 or more Vehicles | 0 (0.0%) | 0 (0.0%) |
| Total | 75 (100.0%) | 53 (100.0%) |
Commute Time in Fort Jesup
The most frequently occuring commute durations in Fort Jesup are 15 to 19 minutes (56 commuters, 43.8%), 90 or more minutes (46 commuters, 35.9%), and 10 to 14 minutes (26 commuters, 20.3%).
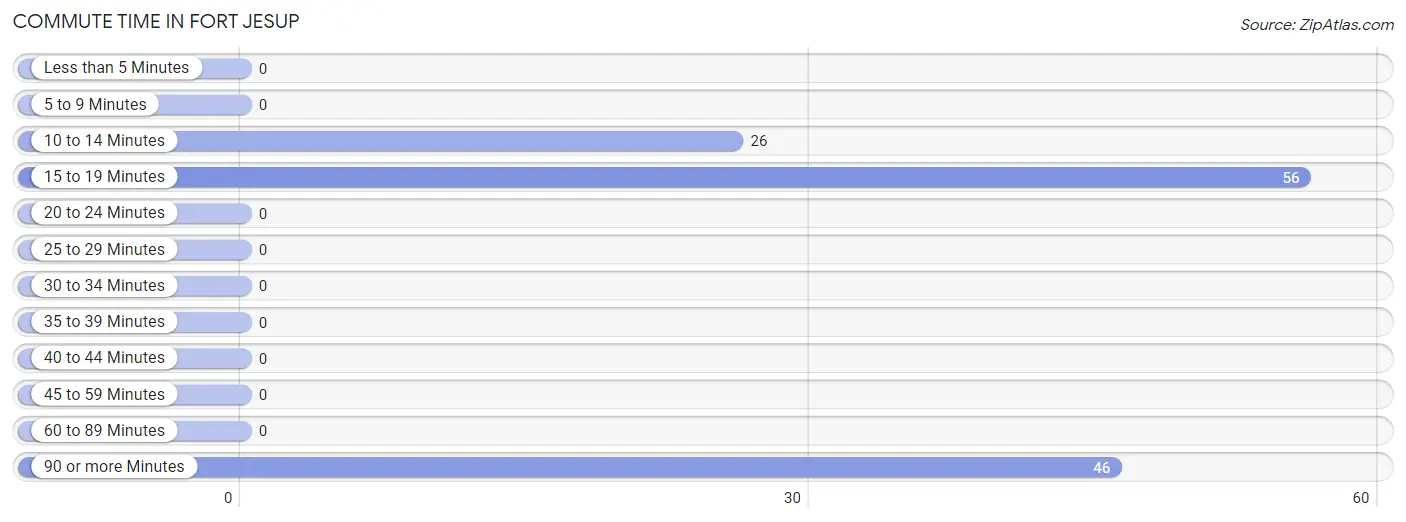
| Commute Time | # Commuters | % Commuters |
| Less than 5 Minutes | 0 | 0.0% |
| 5 to 9 Minutes | 0 | 0.0% |
| 10 to 14 Minutes | 26 | 20.3% |
| 15 to 19 Minutes | 56 | 43.8% |
| 20 to 24 Minutes | 0 | 0.0% |
| 25 to 29 Minutes | 0 | 0.0% |
| 30 to 34 Minutes | 0 | 0.0% |
| 35 to 39 Minutes | 0 | 0.0% |
| 40 to 44 Minutes | 0 | 0.0% |
| 45 to 59 Minutes | 0 | 0.0% |
| 60 to 89 Minutes | 0 | 0.0% |
| 90 or more Minutes | 46 | 35.9% |
Commute Time by Sex in Fort Jesup
The most common commute times in Fort Jesup are 90 or more minutes (46 commuters, 61.3%) for males and 15 to 19 minutes (27 commuters, 50.9%) for females.
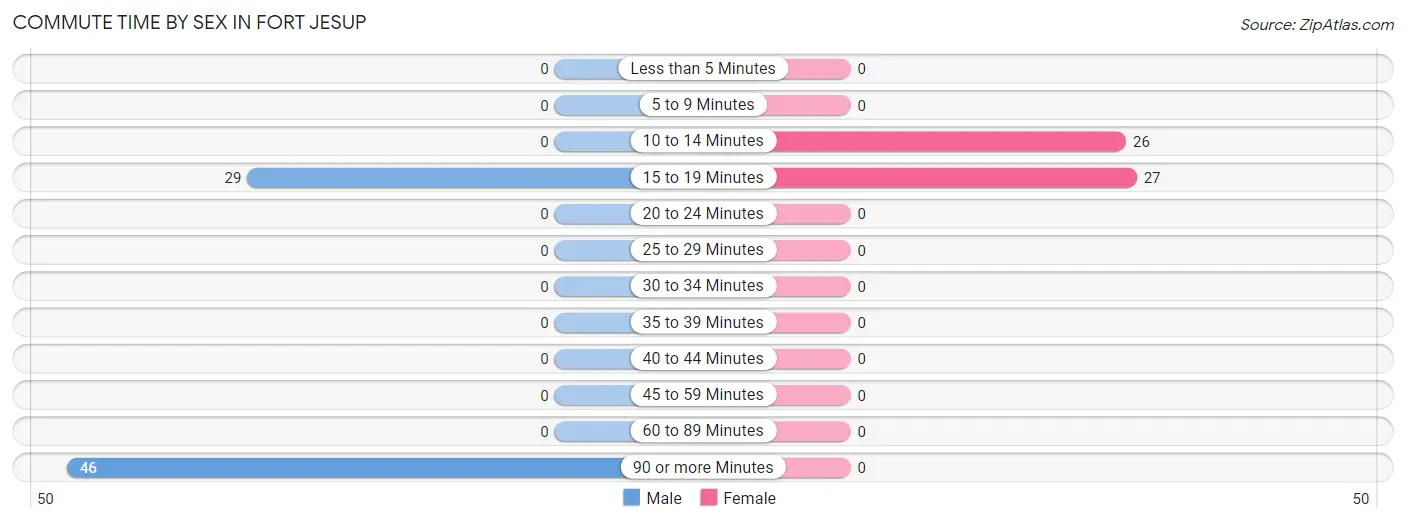
| Commute Time | Male | Female |
| Less than 5 Minutes | 0 (0.0%) | 0 (0.0%) |
| 5 to 9 Minutes | 0 (0.0%) | 0 (0.0%) |
| 10 to 14 Minutes | 0 (0.0%) | 26 (49.1%) |
| 15 to 19 Minutes | 29 (38.7%) | 27 (50.9%) |
| 20 to 24 Minutes | 0 (0.0%) | 0 (0.0%) |
| 25 to 29 Minutes | 0 (0.0%) | 0 (0.0%) |
| 30 to 34 Minutes | 0 (0.0%) | 0 (0.0%) |
| 35 to 39 Minutes | 0 (0.0%) | 0 (0.0%) |
| 40 to 44 Minutes | 0 (0.0%) | 0 (0.0%) |
| 45 to 59 Minutes | 0 (0.0%) | 0 (0.0%) |
| 60 to 89 Minutes | 0 (0.0%) | 0 (0.0%) |
| 90 or more Minutes | 46 (61.3%) | 0 (0.0%) |
Time of Departure to Work by Sex in Fort Jesup
The most frequent times of departure to work in Fort Jesup are 7:00 AM to 7:29 AM (46, 61.3%) for males and 7:00 AM to 7:29 AM (37, 69.8%) for females.
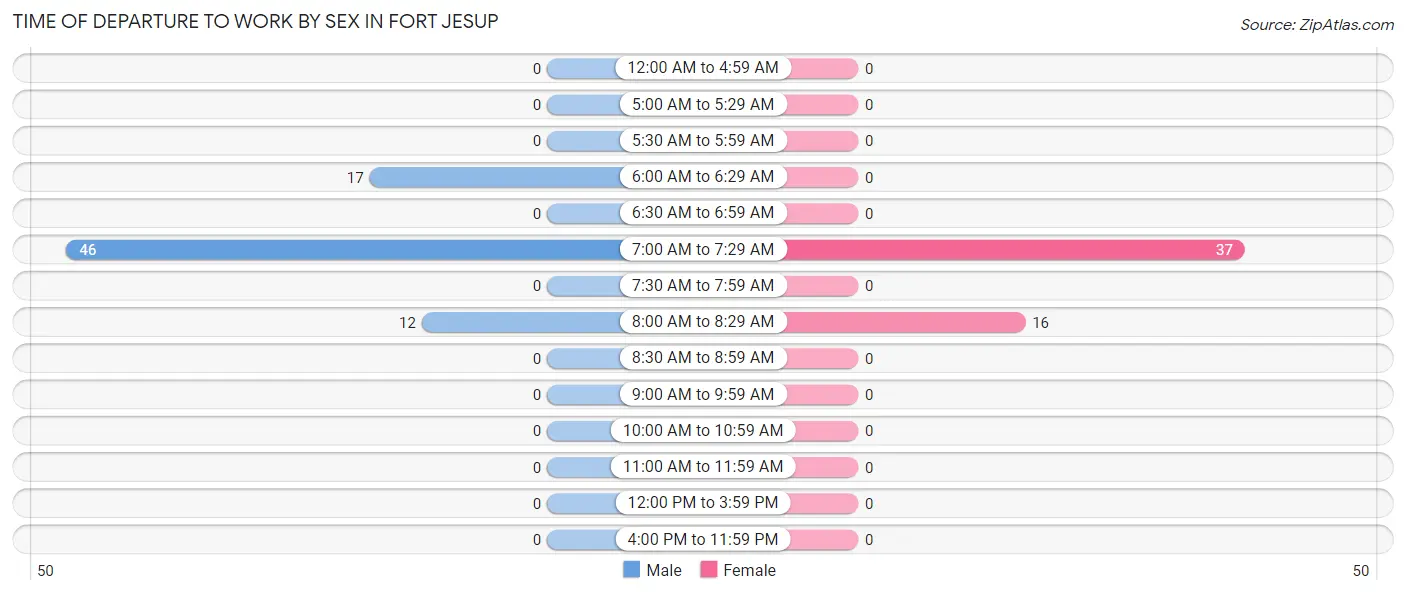
| Time of Departure | Male | Female |
| 12:00 AM to 4:59 AM | 0 (0.0%) | 0 (0.0%) |
| 5:00 AM to 5:29 AM | 0 (0.0%) | 0 (0.0%) |
| 5:30 AM to 5:59 AM | 0 (0.0%) | 0 (0.0%) |
| 6:00 AM to 6:29 AM | 17 (22.7%) | 0 (0.0%) |
| 6:30 AM to 6:59 AM | 0 (0.0%) | 0 (0.0%) |
| 7:00 AM to 7:29 AM | 46 (61.3%) | 37 (69.8%) |
| 7:30 AM to 7:59 AM | 0 (0.0%) | 0 (0.0%) |
| 8:00 AM to 8:29 AM | 12 (16.0%) | 16 (30.2%) |
| 8:30 AM to 8:59 AM | 0 (0.0%) | 0 (0.0%) |
| 9:00 AM to 9:59 AM | 0 (0.0%) | 0 (0.0%) |
| 10:00 AM to 10:59 AM | 0 (0.0%) | 0 (0.0%) |
| 11:00 AM to 11:59 AM | 0 (0.0%) | 0 (0.0%) |
| 12:00 PM to 3:59 PM | 0 (0.0%) | 0 (0.0%) |
| 4:00 PM to 11:59 PM | 0 (0.0%) | 0 (0.0%) |
| Total | 75 (100.0%) | 53 (100.0%) |
Housing Occupancy in Fort Jesup
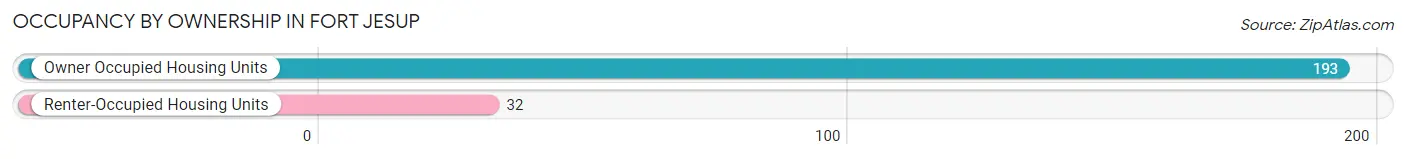
Occupancy by Ownership in Fort Jesup
Of the total 225 dwellings in Fort Jesup, owner-occupied units account for 193 (85.8%), while renter-occupied units make up 32 (14.2%).
| Occupancy | # Housing Units | % Housing Units |
| Owner Occupied Housing Units | 193 | 85.8% |
| Renter-Occupied Housing Units | 32 | 14.2% |
| Total Occupied Housing Units | 225 | 100.0% |
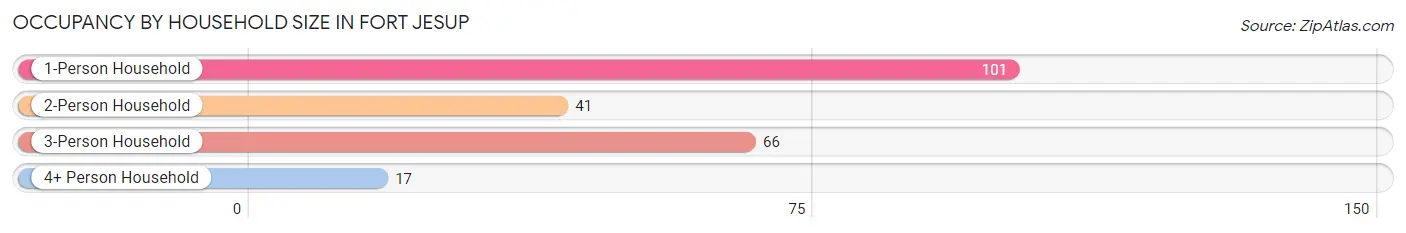
Occupancy by Household Size in Fort Jesup
| Household Size | # Housing Units | % Housing Units |
| 1-Person Household | 101 | 44.9% |
| 2-Person Household | 41 | 18.2% |
| 3-Person Household | 66 | 29.3% |
| 4+ Person Household | 17 | 7.6% |
| Total Housing Units | 225 | 100.0% |
Occupancy by Ownership by Household Size in Fort Jesup
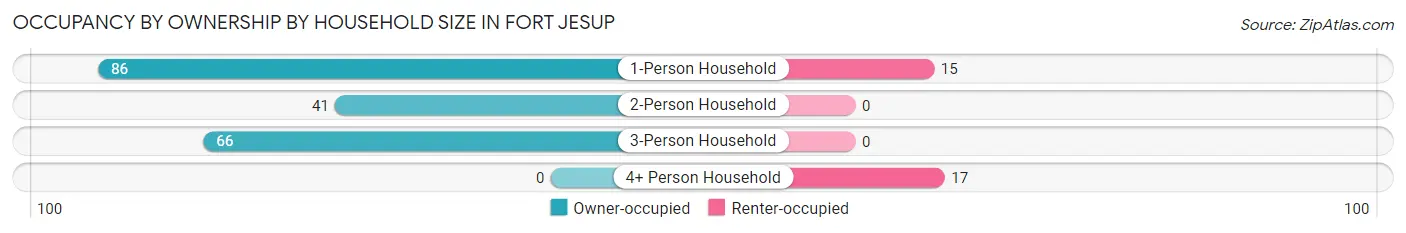
| Household Size | Owner-occupied | Renter-occupied |
| 1-Person Household | 86 (85.2%) | 15 (14.8%) |
| 2-Person Household | 41 (100.0%) | 0 (0.0%) |
| 3-Person Household | 66 (100.0%) | 0 (0.0%) |
| 4+ Person Household | 0 (0.0%) | 17 (100.0%) |
| Total Housing Units | 193 (85.8%) | 32 (14.2%) |
Occupancy by Educational Attainment in Fort Jesup
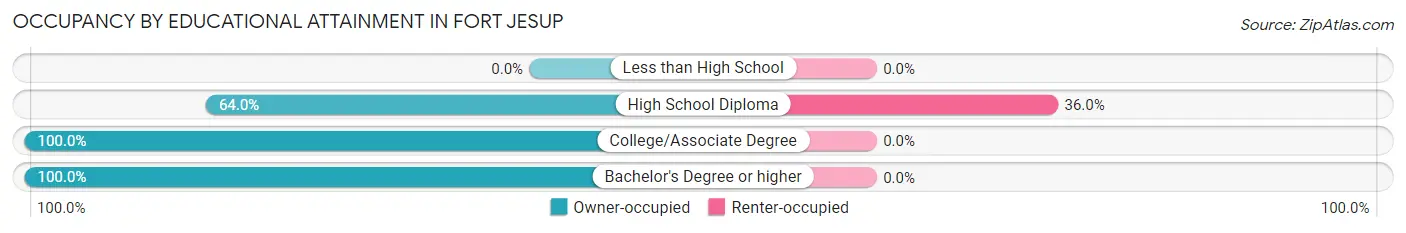
| Household Size | Owner-occupied | Renter-occupied |
| Less than High School | 0 (0.0%) | 0 (0.0%) |
| High School Diploma | 57 (64.0%) | 32 (36.0%) |
| College/Associate Degree | 66 (100.0%) | 0 (0.0%) |
| Bachelor's Degree or higher | 70 (100.0%) | 0 (0.0%) |
Occupancy by Age of Householder in Fort Jesup
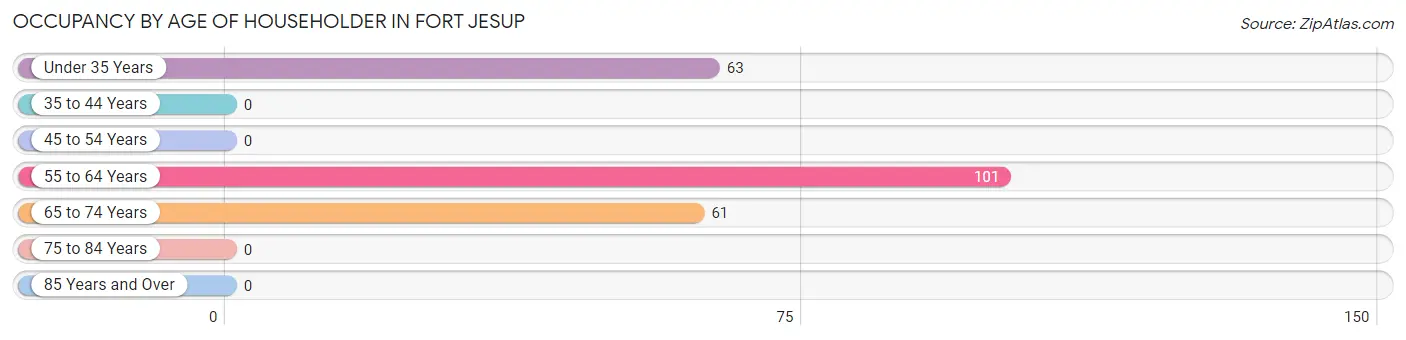
| Age Bracket | # Households | % Households |
| Under 35 Years | 63 | 28.0% |
| 35 to 44 Years | 0 | 0.0% |
| 45 to 54 Years | 0 | 0.0% |
| 55 to 64 Years | 101 | 44.9% |
| 65 to 74 Years | 61 | 27.1% |
| 75 to 84 Years | 0 | 0.0% |
| 85 Years and Over | 0 | 0.0% |
| Total | 225 | 100.0% |
Housing Finances in Fort Jesup
Median Income by Occupancy in Fort Jesup
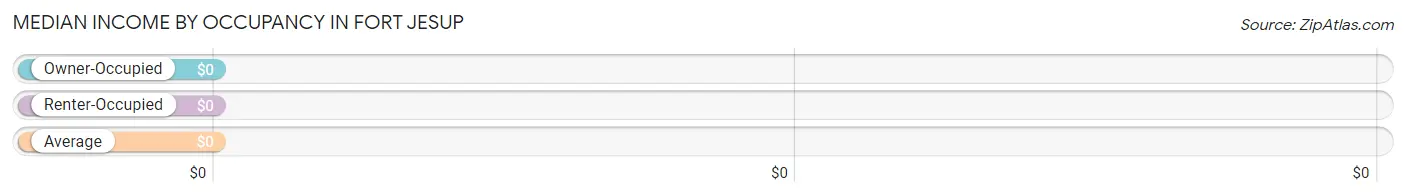
| Occupancy Type | # Households | Median Income |
| Owner-Occupied | 193 (85.8%) | $0 |
| Renter-Occupied | 32 (14.2%) | $0 |
| Average | 225 (100.0%) | $0 |
Occupancy by Householder Income Bracket in Fort Jesup
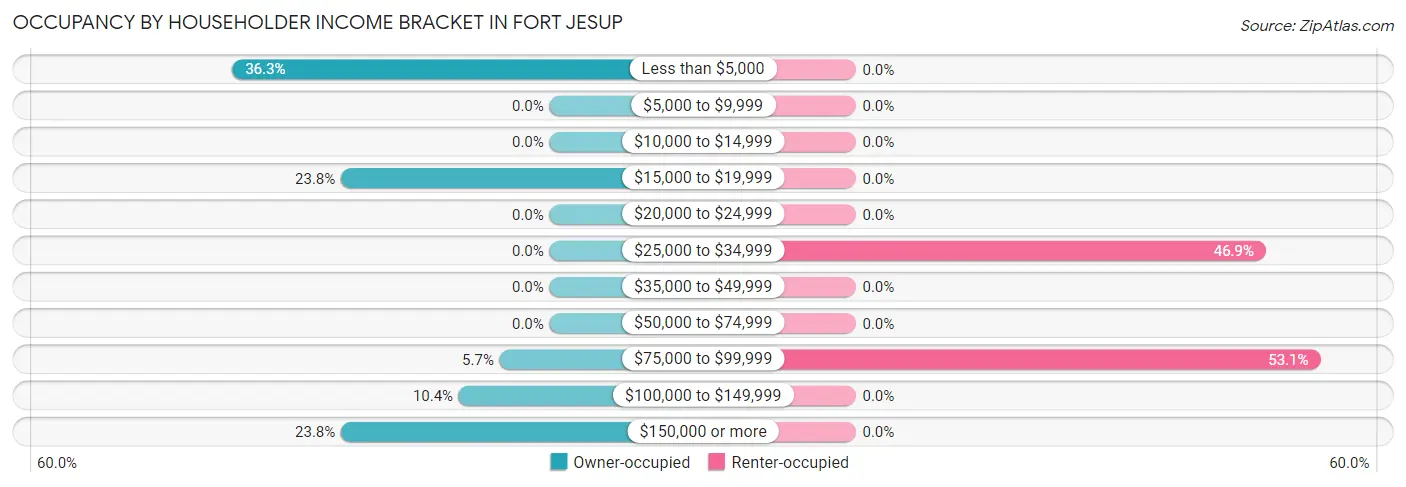
| Income Bracket | Owner-occupied | Renter-occupied |
| Less than $5,000 | 70 (36.3%) | 0 (0.0%) |
| $5,000 to $9,999 | 0 (0.0%) | 0 (0.0%) |
| $10,000 to $14,999 | 0 (0.0%) | 0 (0.0%) |
| $15,000 to $19,999 | 46 (23.8%) | 0 (0.0%) |
| $20,000 to $24,999 | 0 (0.0%) | 0 (0.0%) |
| $25,000 to $34,999 | 0 (0.0%) | 15 (46.9%) |
| $35,000 to $49,999 | 0 (0.0%) | 0 (0.0%) |
| $50,000 to $74,999 | 0 (0.0%) | 0 (0.0%) |
| $75,000 to $99,999 | 11 (5.7%) | 17 (53.1%) |
| $100,000 to $149,999 | 20 (10.4%) | 0 (0.0%) |
| $150,000 or more | 46 (23.8%) | 0 (0.0%) |
| Total | 193 (100.0%) | 32 (100.0%) |
Monthly Housing Cost Tiers in Fort Jesup
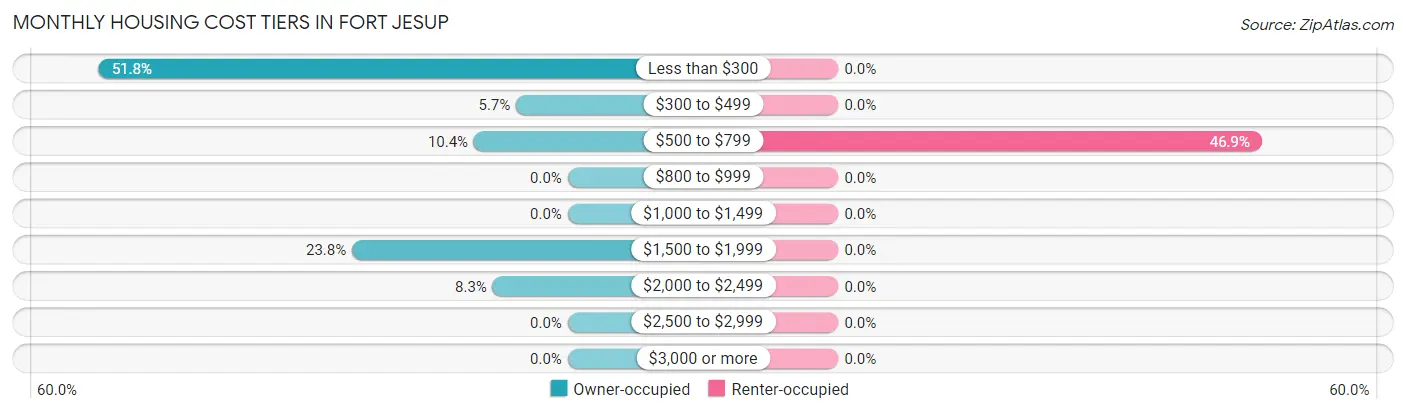
| Monthly Cost | Owner-occupied | Renter-occupied |
| Less than $300 | 100 (51.8%) | 0 (0.0%) |
| $300 to $499 | 11 (5.7%) | 0 (0.0%) |
| $500 to $799 | 20 (10.4%) | 15 (46.9%) |
| $800 to $999 | 0 (0.0%) | 0 (0.0%) |
| $1,000 to $1,499 | 0 (0.0%) | 0 (0.0%) |
| $1,500 to $1,999 | 46 (23.8%) | 0 (0.0%) |
| $2,000 to $2,499 | 16 (8.3%) | 0 (0.0%) |
| $2,500 to $2,999 | 0 (0.0%) | 0 (0.0%) |
| $3,000 or more | 0 (0.0%) | 0 (0.0%) |
| Total | 193 (100.0%) | 32 (100.0%) |
Physical Housing Characteristics in Fort Jesup
Housing Structures in Fort Jesup
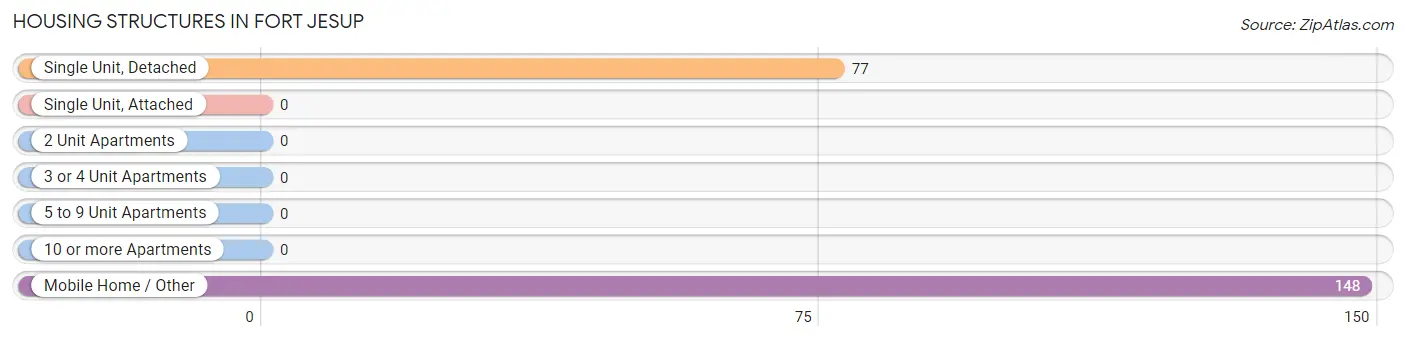
| Structure Type | # Housing Units | % Housing Units |
| Single Unit, Detached | 77 | 34.2% |
| Single Unit, Attached | 0 | 0.0% |
| 2 Unit Apartments | 0 | 0.0% |
| 3 or 4 Unit Apartments | 0 | 0.0% |
| 5 to 9 Unit Apartments | 0 | 0.0% |
| 10 or more Apartments | 0 | 0.0% |
| Mobile Home / Other | 148 | 65.8% |
| Total | 225 | 100.0% |
Housing Structures by Occupancy in Fort Jesup
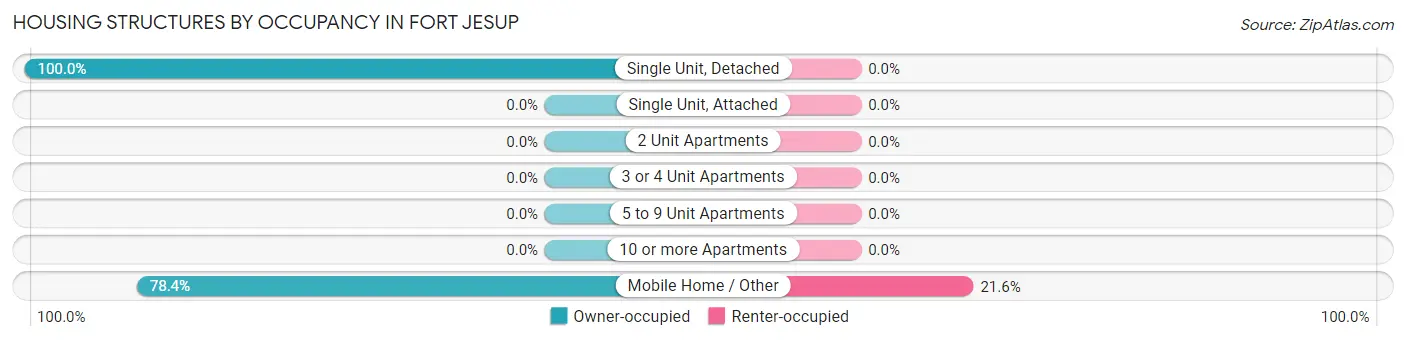
| Structure Type | Owner-occupied | Renter-occupied |
| Single Unit, Detached | 77 (100.0%) | 0 (0.0%) |
| Single Unit, Attached | 0 (0.0%) | 0 (0.0%) |
| 2 Unit Apartments | 0 (0.0%) | 0 (0.0%) |
| 3 or 4 Unit Apartments | 0 (0.0%) | 0 (0.0%) |
| 5 to 9 Unit Apartments | 0 (0.0%) | 0 (0.0%) |
| 10 or more Apartments | 0 (0.0%) | 0 (0.0%) |
| Mobile Home / Other | 116 (78.4%) | 32 (21.6%) |
| Total | 193 (85.8%) | 32 (14.2%) |
Housing Structures by Number of Rooms in Fort Jesup
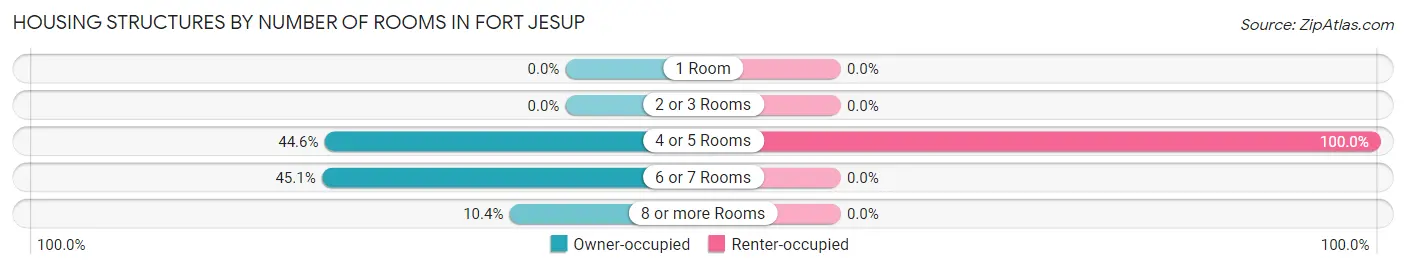
| Number of Rooms | Owner-occupied | Renter-occupied |
| 1 Room | 0 (0.0%) | 0 (0.0%) |
| 2 or 3 Rooms | 0 (0.0%) | 0 (0.0%) |
| 4 or 5 Rooms | 86 (44.6%) | 32 (100.0%) |
| 6 or 7 Rooms | 87 (45.1%) | 0 (0.0%) |
| 8 or more Rooms | 20 (10.4%) | 0 (0.0%) |
| Total | 193 (100.0%) | 32 (100.0%) |
Housing Structure by Heating Type in Fort Jesup
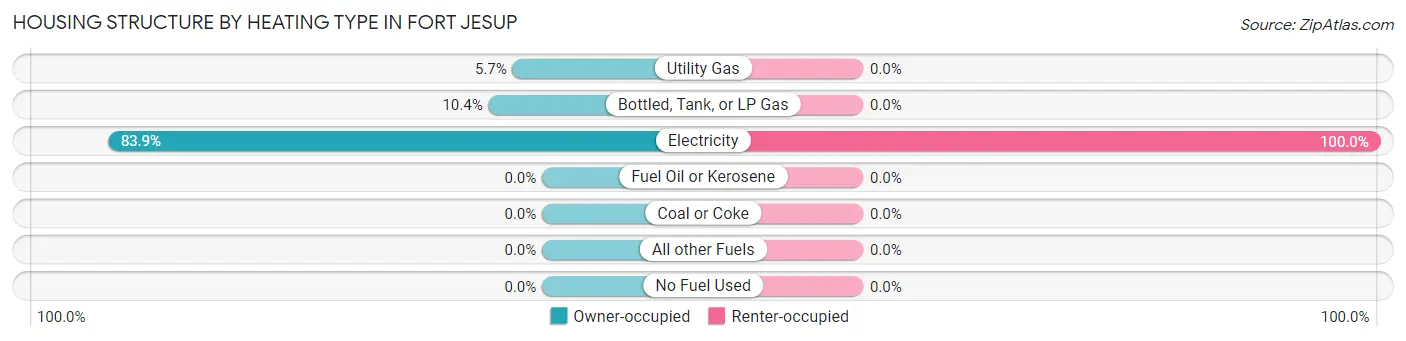
| Heating Type | Owner-occupied | Renter-occupied |
| Utility Gas | 11 (5.7%) | 0 (0.0%) |
| Bottled, Tank, or LP Gas | 20 (10.4%) | 0 (0.0%) |
| Electricity | 162 (83.9%) | 32 (100.0%) |
| Fuel Oil or Kerosene | 0 (0.0%) | 0 (0.0%) |
| Coal or Coke | 0 (0.0%) | 0 (0.0%) |
| All other Fuels | 0 (0.0%) | 0 (0.0%) |
| No Fuel Used | 0 (0.0%) | 0 (0.0%) |
| Total | 193 (100.0%) | 32 (100.0%) |
Household Vehicle Usage in Fort Jesup
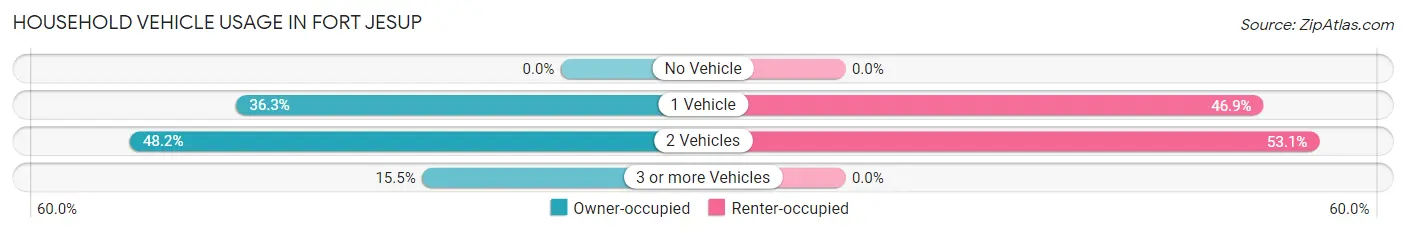
| Vehicles per Household | Owner-occupied | Renter-occupied |
| No Vehicle | 0 (0.0%) | 0 (0.0%) |
| 1 Vehicle | 70 (36.3%) | 15 (46.9%) |
| 2 Vehicles | 93 (48.2%) | 17 (53.1%) |
| 3 or more Vehicles | 30 (15.5%) | 0 (0.0%) |
| Total | 193 (100.0%) | 32 (100.0%) |
Real Estate & Mortgages in Fort Jesup
Real Estate and Mortgage Overview in Fort Jesup
| Characteristic | Without Mortgage | With Mortgage |
| Housing Units | 147 | 46 |
| Median Property Value | - | - |
| Median Household Income | - | - |
| Monthly Housing Costs | - | - |
| Real Estate Taxes | - | - |
Property Value by Mortgage Status in Fort Jesup
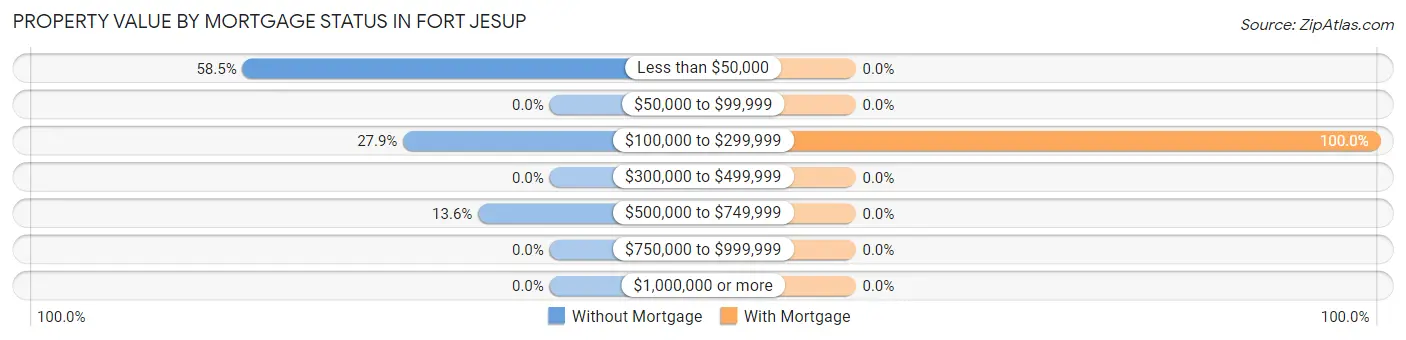
| Property Value | Without Mortgage | With Mortgage |
| Less than $50,000 | 86 (58.5%) | 0 (0.0%) |
| $50,000 to $99,999 | 0 (0.0%) | 0 (0.0%) |
| $100,000 to $299,999 | 41 (27.9%) | 46 (100.0%) |
| $300,000 to $499,999 | 0 (0.0%) | 0 (0.0%) |
| $500,000 to $749,999 | 20 (13.6%) | 0 (0.0%) |
| $750,000 to $999,999 | 0 (0.0%) | 0 (0.0%) |
| $1,000,000 or more | 0 (0.0%) | 0 (0.0%) |
| Total | 147 (100.0%) | 46 (100.0%) |
Household Income by Mortgage Status in Fort Jesup

| Household Income | Without Mortgage | With Mortgage |
| Less than $10,000 | 70 (47.6%) | 0 (0.0%) |
| $10,000 to $24,999 | 46 (31.3%) | 0 (0.0%) |
| $25,000 to $34,999 | 0 (0.0%) | 0 (0.0%) |
| $35,000 to $49,999 | 0 (0.0%) | 0 (0.0%) |
| $50,000 to $74,999 | 0 (0.0%) | 0 (0.0%) |
| $75,000 to $99,999 | 11 (7.5%) | 0 (0.0%) |
| $100,000 to $149,999 | 20 (13.6%) | 0 (0.0%) |
| $150,000 or more | 0 (0.0%) | 0 (0.0%) |
| Total | 147 (100.0%) | 46 (100.0%) |
Property Value to Household Income Ratio in Fort Jesup
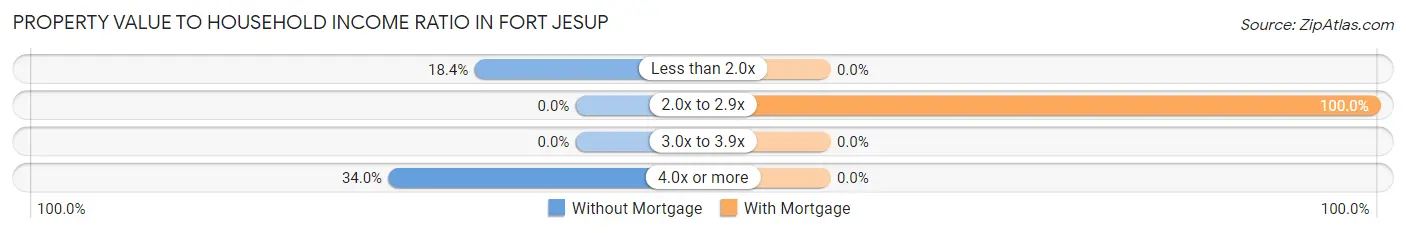
| Value-to-Income Ratio | Without Mortgage | With Mortgage |
| Less than 2.0x | 27 (18.4%) | 0 (0.0%) |
| 2.0x to 2.9x | 0 (0.0%) | 46 (100.0%) |
| 3.0x to 3.9x | 0 (0.0%) | 0 (0.0%) |
| 4.0x or more | 50 (34.0%) | 0 (0.0%) |
| Total | 147 (100.0%) | 46 (100.0%) |
Real Estate Taxes by Mortgage Status in Fort Jesup
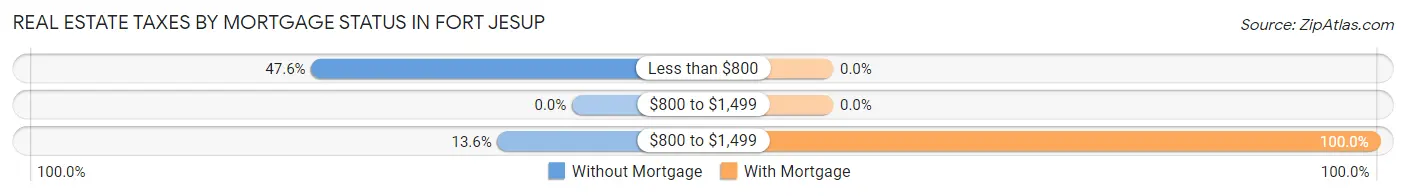
| Property Taxes | Without Mortgage | With Mortgage |
| Less than $800 | 70 (47.6%) | 0 (0.0%) |
| $800 to $1,499 | 0 (0.0%) | 0 (0.0%) |
| $800 to $1,499 | 20 (13.6%) | 46 (100.0%) |
| Total | 147 (100.0%) | 46 (100.0%) |
Health & Disability in Fort Jesup
Health Insurance Coverage by Age in Fort Jesup
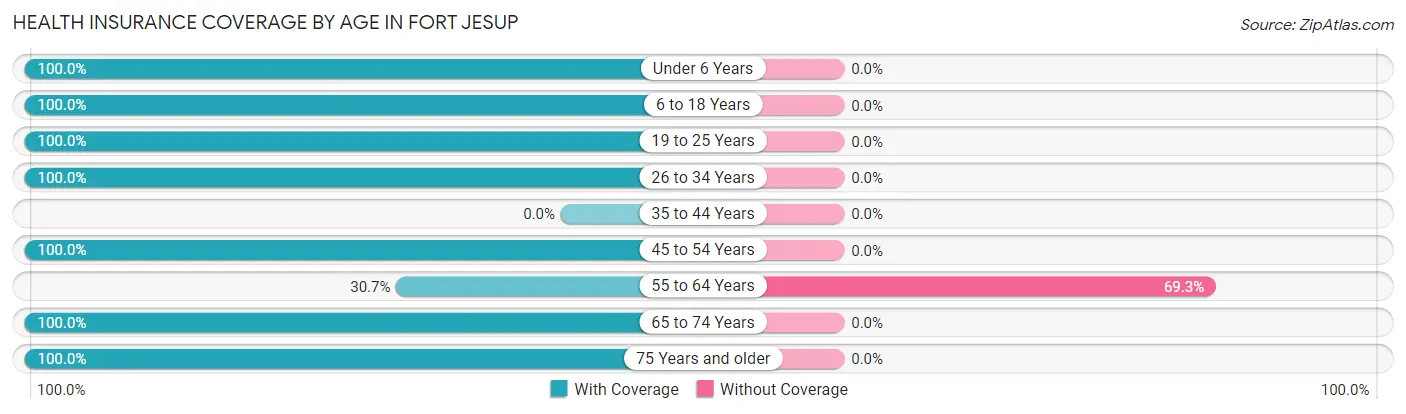
| Age Bracket | With Coverage | Without Coverage |
| Under 6 Years | 39 (100.0%) | 0 (0.0%) |
| 6 to 18 Years | 90 (100.0%) | 0 (0.0%) |
| 19 to 25 Years | 72 (100.0%) | 0 (0.0%) |
| 26 to 34 Years | 46 (100.0%) | 0 (0.0%) |
| 35 to 44 Years | 0 (0.0%) | 0 (0.0%) |
| 45 to 54 Years | 27 (100.0%) | 0 (0.0%) |
| 55 to 64 Years | 31 (30.7%) | 70 (69.3%) |
| 65 to 74 Years | 96 (100.0%) | 0 (0.0%) |
| 75 Years and older | 12 (100.0%) | 0 (0.0%) |
| Total | 413 (85.5%) | 70 (14.5%) |
Health Insurance Coverage by Citizenship Status in Fort Jesup
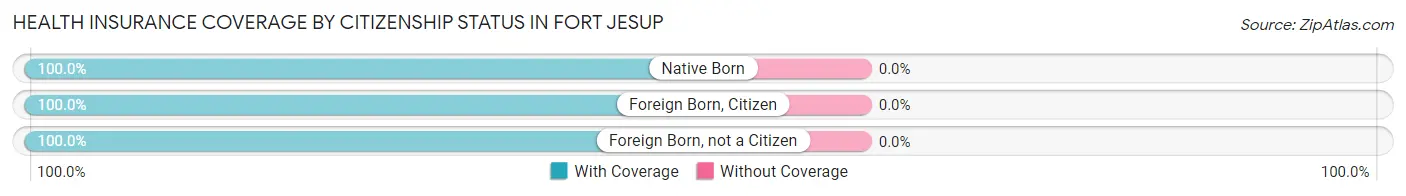
| Citizenship Status | With Coverage | Without Coverage |
| Native Born | 39 (100.0%) | 0 (0.0%) |
| Foreign Born, Citizen | 90 (100.0%) | 0 (0.0%) |
| Foreign Born, not a Citizen | 72 (100.0%) | 0 (0.0%) |
Health Insurance Coverage by Household Income in Fort Jesup
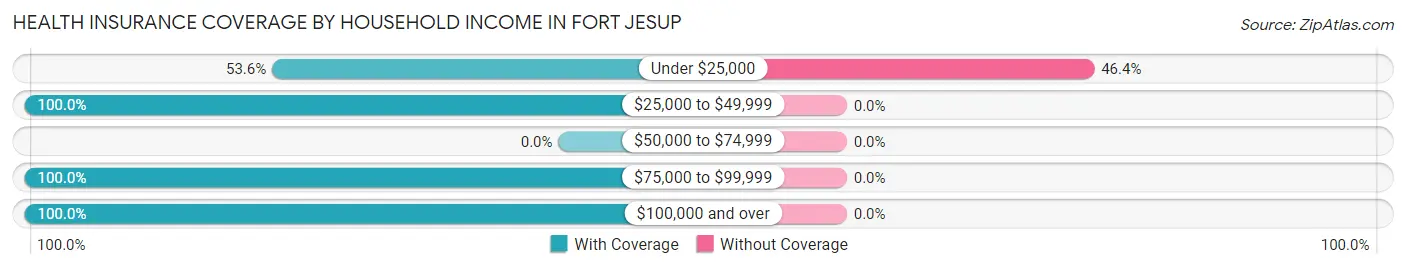
| Household Income | With Coverage | Without Coverage |
| Under $25,000 | 81 (53.6%) | 70 (46.4%) |
| $25,000 to $49,999 | 15 (100.0%) | 0 (0.0%) |
| $50,000 to $74,999 | 0 (0.0%) | 0 (0.0%) |
| $75,000 to $99,999 | 125 (100.0%) | 0 (0.0%) |
| $100,000 and over | 192 (100.0%) | 0 (0.0%) |
Public vs Private Health Insurance Coverage by Age in Fort Jesup
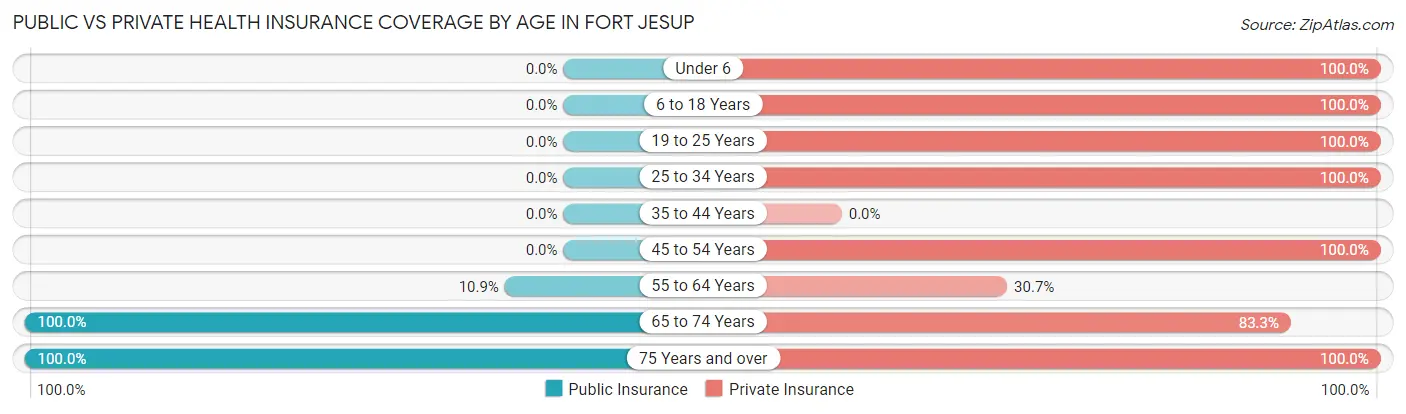
| Age Bracket | Public Insurance | Private Insurance |
| Under 6 | 0 (0.0%) | 39 (100.0%) |
| 6 to 18 Years | 0 (0.0%) | 90 (100.0%) |
| 19 to 25 Years | 0 (0.0%) | 72 (100.0%) |
| 25 to 34 Years | 0 (0.0%) | 46 (100.0%) |
| 35 to 44 Years | 0 (0.0%) | 0 (0.0%) |
| 45 to 54 Years | 0 (0.0%) | 27 (100.0%) |
| 55 to 64 Years | 11 (10.9%) | 31 (30.7%) |
| 65 to 74 Years | 96 (100.0%) | 80 (83.3%) |
| 75 Years and over | 12 (100.0%) | 12 (100.0%) |
| Total | 119 (24.6%) | 397 (82.2%) |
Disability Status by Sex by Age in Fort Jesup
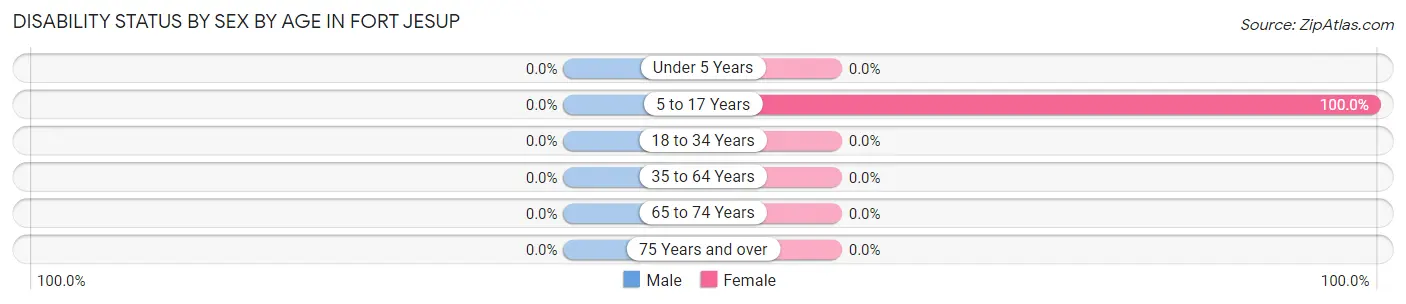
| Age Bracket | Male | Female |
| Under 5 Years | 0 (0.0%) | 0 (0.0%) |
| 5 to 17 Years | 0 (0.0%) | 34 (100.0%) |
| 18 to 34 Years | 0 (0.0%) | 0 (0.0%) |
| 35 to 64 Years | 0 (0.0%) | 0 (0.0%) |
| 65 to 74 Years | 0 (0.0%) | 0 (0.0%) |
| 75 Years and over | 0 (0.0%) | 0 (0.0%) |
Disability Class by Sex by Age in Fort Jesup
Disability Class: Hearing Difficulty
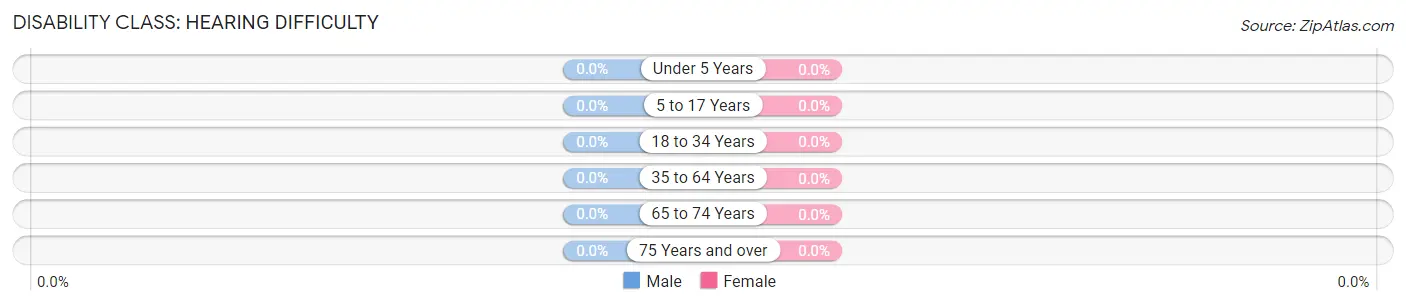
| Age Bracket | Male | Female |
| Under 5 Years | 0 (0.0%) | 0 (0.0%) |
| 5 to 17 Years | 0 (0.0%) | 0 (0.0%) |
| 18 to 34 Years | 0 (0.0%) | 0 (0.0%) |
| 35 to 64 Years | 0 (0.0%) | 0 (0.0%) |
| 65 to 74 Years | 0 (0.0%) | 0 (0.0%) |
| 75 Years and over | 0 (0.0%) | 0 (0.0%) |
Disability Class: Vision Difficulty
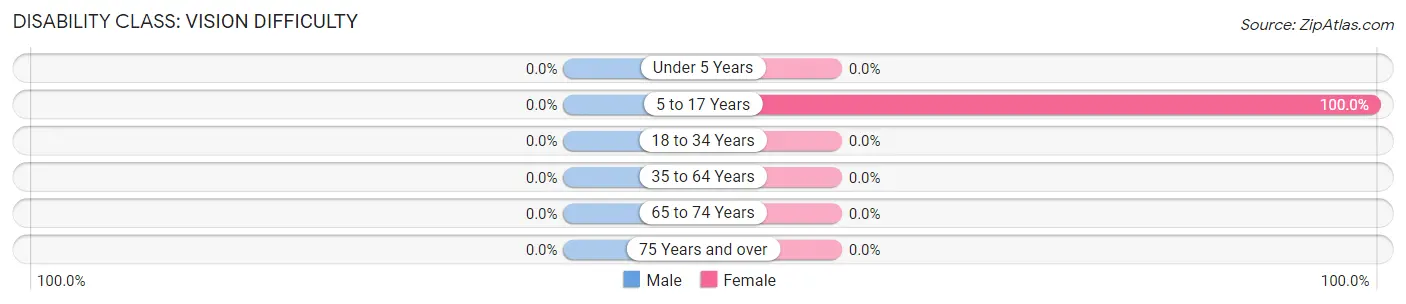
| Age Bracket | Male | Female |
| Under 5 Years | 0 (0.0%) | 0 (0.0%) |
| 5 to 17 Years | 0 (0.0%) | 34 (100.0%) |
| 18 to 34 Years | 0 (0.0%) | 0 (0.0%) |
| 35 to 64 Years | 0 (0.0%) | 0 (0.0%) |
| 65 to 74 Years | 0 (0.0%) | 0 (0.0%) |
| 75 Years and over | 0 (0.0%) | 0 (0.0%) |
Disability Class: Cognitive Difficulty
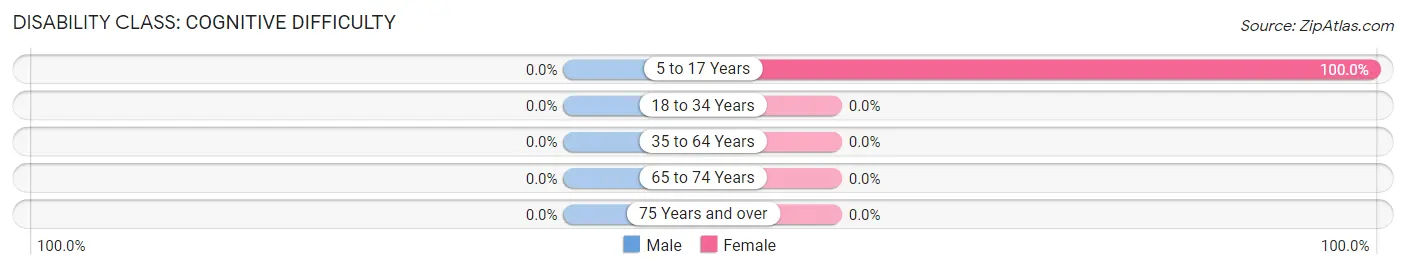
| Age Bracket | Male | Female |
| 5 to 17 Years | 0 (0.0%) | 34 (100.0%) |
| 18 to 34 Years | 0 (0.0%) | 0 (0.0%) |
| 35 to 64 Years | 0 (0.0%) | 0 (0.0%) |
| 65 to 74 Years | 0 (0.0%) | 0 (0.0%) |
| 75 Years and over | 0 (0.0%) | 0 (0.0%) |
Disability Class: Ambulatory Difficulty
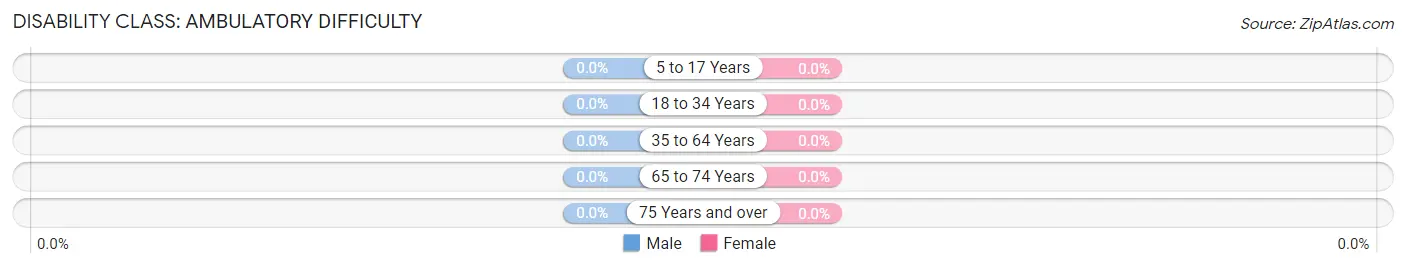
| Age Bracket | Male | Female |
| 5 to 17 Years | 0 (0.0%) | 0 (0.0%) |
| 18 to 34 Years | 0 (0.0%) | 0 (0.0%) |
| 35 to 64 Years | 0 (0.0%) | 0 (0.0%) |
| 65 to 74 Years | 0 (0.0%) | 0 (0.0%) |
| 75 Years and over | 0 (0.0%) | 0 (0.0%) |
Disability Class: Self-Care Difficulty
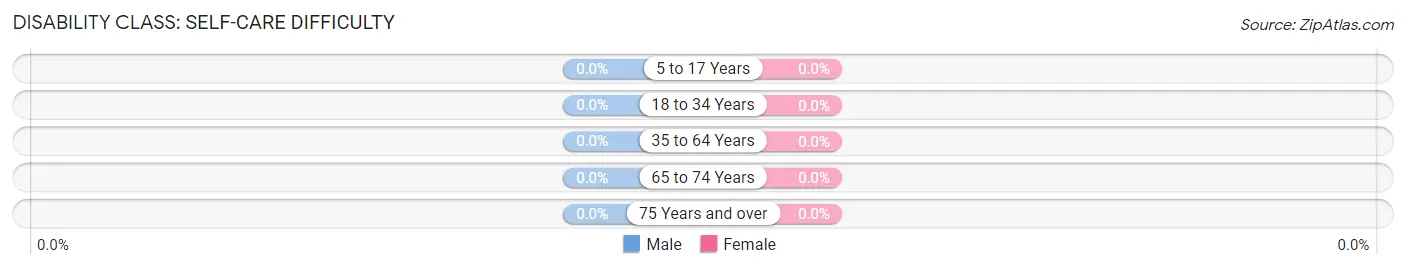
| Age Bracket | Male | Female |
| 5 to 17 Years | 0 (0.0%) | 0 (0.0%) |
| 18 to 34 Years | 0 (0.0%) | 0 (0.0%) |
| 35 to 64 Years | 0 (0.0%) | 0 (0.0%) |
| 65 to 74 Years | 0 (0.0%) | 0 (0.0%) |
| 75 Years and over | 0 (0.0%) | 0 (0.0%) |
Technology Access in Fort Jesup
Computing Device Access in Fort Jesup
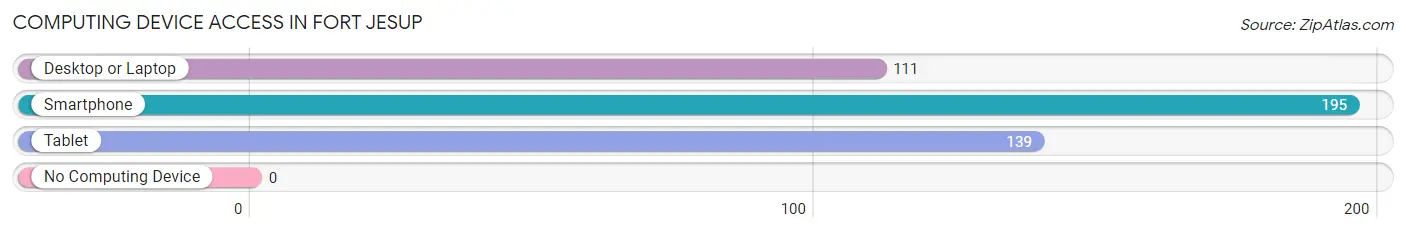
| Device Type | # Households | % Households |
| Desktop or Laptop | 111 | 49.3% |
| Smartphone | 195 | 86.7% |
| Tablet | 139 | 61.8% |
| No Computing Device | 0 | 0.0% |
| Total | 225 | 100.0% |
Internet Access in Fort Jesup
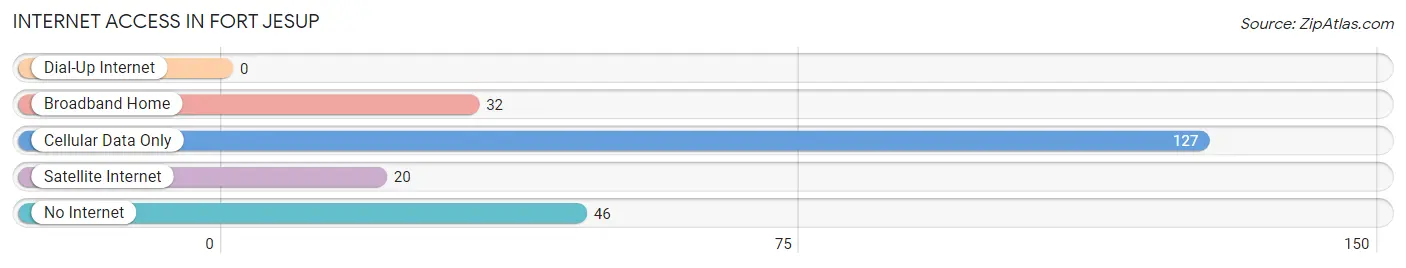
| Internet Type | # Households | % Households |
| Dial-Up Internet | 0 | 0.0% |
| Broadband Home | 32 | 14.2% |
| Cellular Data Only | 127 | 56.4% |
| Satellite Internet | 20 | 8.9% |
| No Internet | 46 | 20.4% |
| Total | 225 | 100.0% |
Fort Jesup Summary
History
Fort Jesup is a small unincorporated community located in Sabine Parish, Louisiana. It is situated on the Sabine River, which forms the border between Louisiana and Texas. The town was founded in 1822 and named after General Zachary Taylor, who was stationed at the fort from 1822 to 1845. The fort was built to protect the United States from the Spanish and Native American forces in the area.
The fort was an important military post during the Mexican-American War, and was the site of several battles. During the Civil War, the fort was occupied by Confederate forces and was the site of a major battle in 1863. After the war, the fort was abandoned and the town of Fort Jesup was established.
Geography
Fort Jesup is located in the northwest corner of Sabine Parish, Louisiana. It is situated on the Sabine River, which forms the border between Louisiana and Texas. The town is located about 25 miles south of Natchitoches, Louisiana and about 50 miles north of Beaumont, Texas.
The town is surrounded by pine forests and is home to several small lakes. The climate is humid subtropical, with hot summers and mild winters.
Economy
The economy of Fort Jesup is largely based on agriculture and timber production. The town is home to several small farms and ranches, as well as a few timber companies. The town also has a few small businesses, including a grocery store, a hardware store, and a few restaurants.
Demographics
As of the 2010 census, the population of Fort Jesup was 1,093. The racial makeup of the town was 94.3% White, 2.2% African American, 0.7% Native American, 0.3% Asian, and 2.5% from other races. The median household income was $31,250, and the median family income was $37,500.
Conclusion
Fort Jesup is a small unincorporated community located in Sabine Parish, Louisiana. It was founded in 1822 and named after General Zachary Taylor, who was stationed at the fort from 1822 to 1845. The town is situated on the Sabine River, which forms the border between Louisiana and Texas. The economy of Fort Jesup is largely based on agriculture and timber production, and the town is home to several small farms and ranches. As of the 2010 census, the population of Fort Jesup was 1,093.
Common Questions
What is Per Capita Income in Fort Jesup?
Per Capita income in Fort Jesup is $25,166.
What is the Median Family Income in Fort Jesup?
Median Family Income in Fort Jesup is $113,000.
What is Income or Wage Gap in Fort Jesup?
Income or Wage Gap in Fort Jesup is 71.0%.
Women in Fort Jesup earn 29.0 cents for every dollar earned by a man.
What is Inequality or Gini Index in Fort Jesup?
Inequality or Gini Index in Fort Jesup is 0.57.
What is the Total Population of Fort Jesup?
Total Population of Fort Jesup is 483.
What is the Total Male Population of Fort Jesup?
Total Male Population of Fort Jesup is 235.
What is the Total Female Population of Fort Jesup?
Total Female Population of Fort Jesup is 248.
What is the Ratio of Males per 100 Females in Fort Jesup?
There are 94.76 Males per 100 Females in Fort Jesup.
What is the Ratio of Females per 100 Males in Fort Jesup?
There are 105.53 Females per 100 Males in Fort Jesup.
What is the Median Population Age in Fort Jesup?
Median Population Age in Fort Jesup is 27.8 Years.
What is the Average Family Size in Fort Jesup
Average Family Size in Fort Jesup is 3.1 People.
What is the Average Household Size in Fort Jesup
Average Household Size in Fort Jesup is 2.1 People.
How Large is the Labor Force in Fort Jesup?
There are 128 People in the Labor Forcein in Fort Jesup.
What is the Percentage of People in the Labor Force in Fort Jesup?
36.2% of People are in the Labor Force in Fort Jesup.