Ada, KS Map & Demographics
Ada Map
Ada Overview
$19,141
PER CAPITA INCOME
$33,750
AVG HOUSEHOLD INCOME
0.17
INEQUALITY / GINI INDEX
34
TOTAL POPULATION
18
MALE POPULATION
16
FEMALE POPULATION
112.50
MALES / 100 FEMALES
88.89
FEMALES / 100 MALES
59.4
MEDIAN AGE
1.6
AVG FAMILY SIZE
1.7
AVG HOUSEHOLD SIZE
9
LABOR FORCE [ PEOPLE ]
26.5%
PERCENT IN LABOR FORCE
Ada Area Codes
Income in Ada
Income Overview in Ada
| Characteristic | Number | Measure |
| Per Capita Income | 34 | $19,141 |
| Median Family Income | 10 | $0 |
| Mean Family Income | 10 | $0 |
| Median Household Income | 20 | $33,750 |
| Mean Household Income | 20 | $41,860 |
| Income Deficit | 10 | $0 |
| Wage / Income Gap (%) | 34 | 0.00% |
| Wage / Income Gap ($) | 34 | 100.00¢ per $1 |
| Gini / Inequality Index | 34 | 0.17 |
Earnings by Sex in Ada
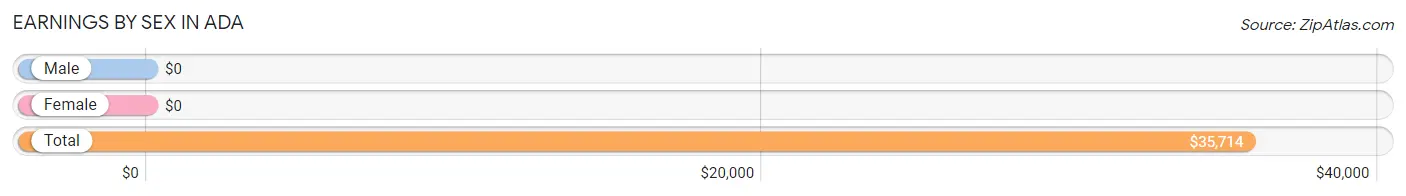
| Sex | Number | Average Earnings |
| Male | 8 (66.7%) | $0 |
| Female | 4 (33.3%) | $0 |
| Total | 12 (100.0%) | $35,714 |
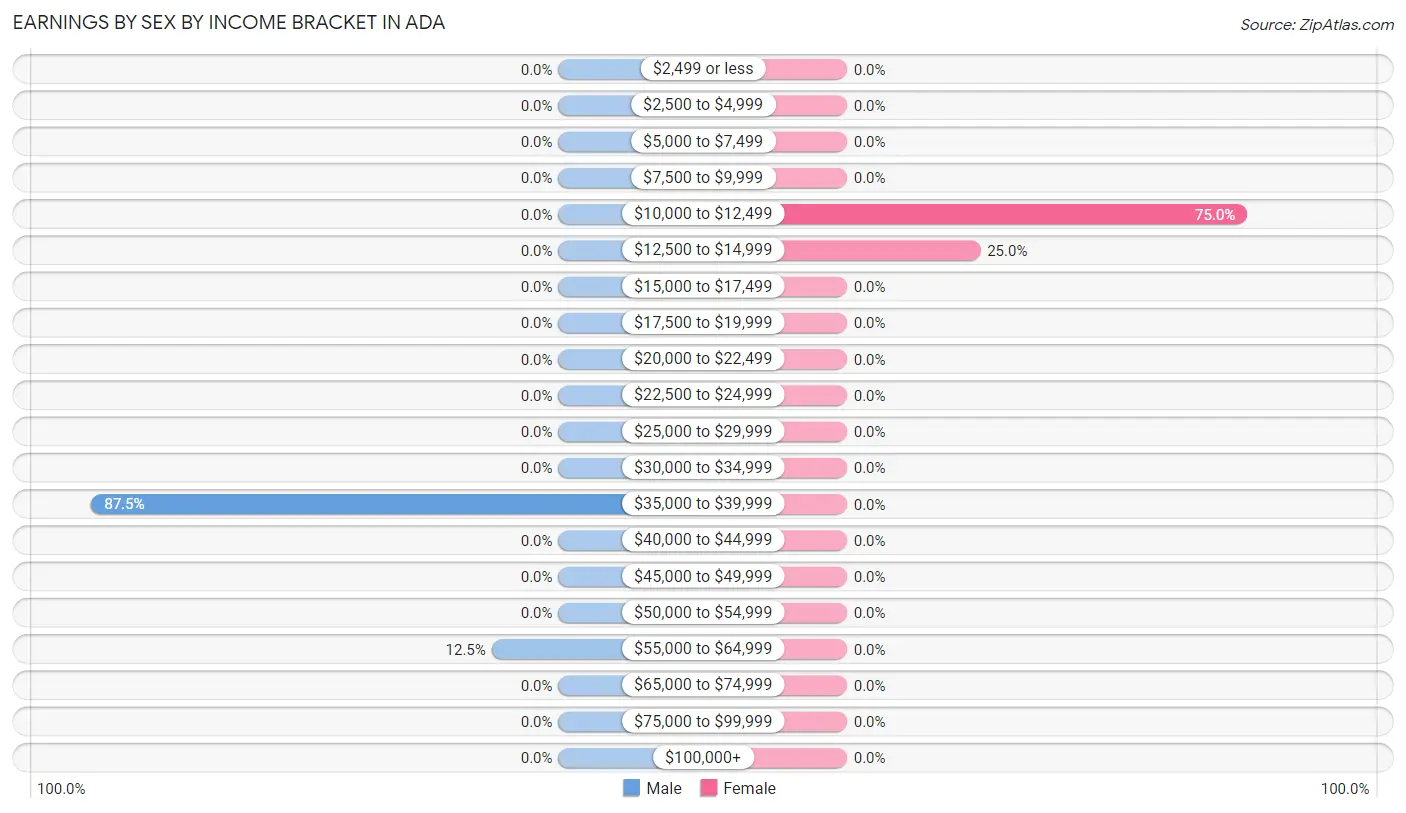
Earnings by Sex by Income Bracket in Ada
The most common earnings brackets in Ada are $35,000 to $39,999 for men (7 | 87.5%) and $10,000 to $12,499 for women (3 | 75.0%).
| Income | Male | Female |
| $2,499 or less | 0 (0.0%) | 0 (0.0%) |
| $2,500 to $4,999 | 0 (0.0%) | 0 (0.0%) |
| $5,000 to $7,499 | 0 (0.0%) | 0 (0.0%) |
| $7,500 to $9,999 | 0 (0.0%) | 0 (0.0%) |
| $10,000 to $12,499 | 0 (0.0%) | 3 (75.0%) |
| $12,500 to $14,999 | 0 (0.0%) | 1 (25.0%) |
| $15,000 to $17,499 | 0 (0.0%) | 0 (0.0%) |
| $17,500 to $19,999 | 0 (0.0%) | 0 (0.0%) |
| $20,000 to $22,499 | 0 (0.0%) | 0 (0.0%) |
| $22,500 to $24,999 | 0 (0.0%) | 0 (0.0%) |
| $25,000 to $29,999 | 0 (0.0%) | 0 (0.0%) |
| $30,000 to $34,999 | 0 (0.0%) | 0 (0.0%) |
| $35,000 to $39,999 | 7 (87.5%) | 0 (0.0%) |
| $40,000 to $44,999 | 0 (0.0%) | 0 (0.0%) |
| $45,000 to $49,999 | 0 (0.0%) | 0 (0.0%) |
| $50,000 to $54,999 | 0 (0.0%) | 0 (0.0%) |
| $55,000 to $64,999 | 1 (12.5%) | 0 (0.0%) |
| $65,000 to $74,999 | 0 (0.0%) | 0 (0.0%) |
| $75,000 to $99,999 | 0 (0.0%) | 0 (0.0%) |
| $100,000+ | 0 (0.0%) | 0 (0.0%) |
| Total | 8 (100.0%) | 4 (100.0%) |
Earnings by Sex by Educational Attainment in Ada
| Educational Attainment | Male Income | Female Income |
| Less than High School | - | - |
| High School Diploma | - | - |
| College or Associate's Degree | - | - |
| Bachelor's Degree | - | - |
| Graduate Degree | - | - |
| Total | - | - |
Family Income in Ada
Family Income Brackets in Ada
According to the Ada family income data, there are 7 families falling into the $35,000 to $49,999 income range, which is the most common income bracket and makes up 70.0% of all families.
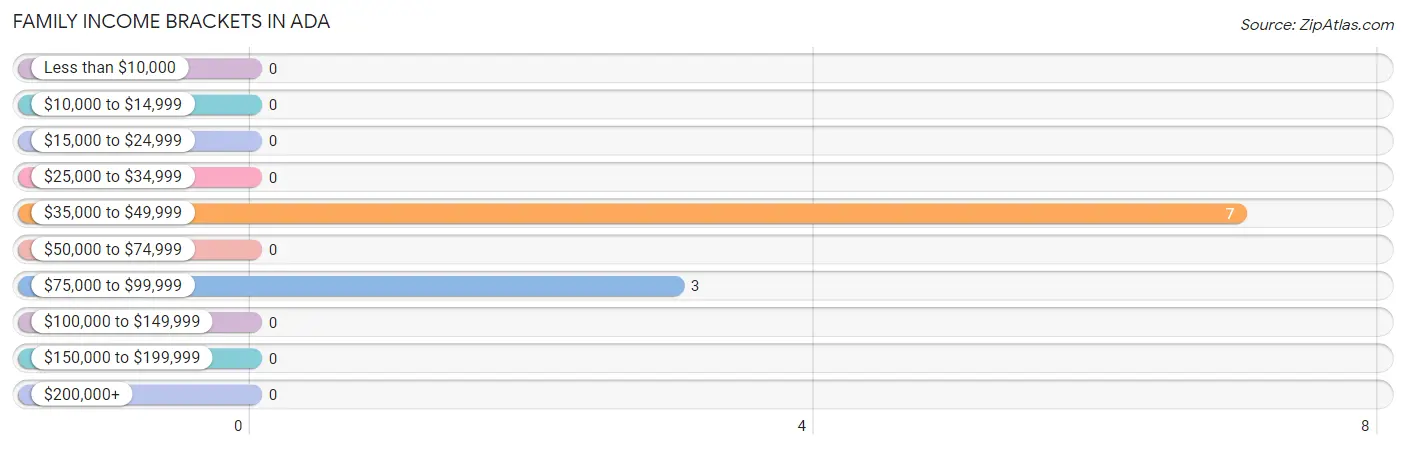
| Income Bracket | # Families | % Families |
| Less than $10,000 | 0 | 0.0% |
| $10,000 to $14,999 | 0 | 0.0% |
| $15,000 to $24,999 | 0 | 0.0% |
| $25,000 to $34,999 | 0 | 0.0% |
| $35,000 to $49,999 | 7 | 70.0% |
| $50,000 to $74,999 | 0 | 0.0% |
| $75,000 to $99,999 | 3 | 30.0% |
| $100,000 to $149,999 | 0 | 0.0% |
| $150,000 to $199,999 | 0 | 0.0% |
| $200,000+ | 0 | 0.0% |
Family Income by Famaliy Size in Ada
| Income Bracket | # Families | Median Income |
| 2-Person Families | 7 (70.0%) | $0 |
| 3-Person Families | 3 (30.0%) | $0 |
| 4-Person Families | 0 (0.0%) | $0 |
| 5-Person Families | 0 (0.0%) | $0 |
| 6-Person Families | 0 (0.0%) | $0 |
| 7+ Person Families | 0 (0.0%) | $0 |
| Total | 10 (100.0%) | $0 |
Family Income by Number of Earners in Ada
| Number of Earners | # Families | Median Income |
| No Earners | 0 (0.0%) | $0 |
| 1 Earner | 7 (70.0%) | $0 |
| 2 Earners | 0 (0.0%) | $0 |
| 3+ Earners | 3 (30.0%) | $0 |
| Total | 10 (100.0%) | $0 |
Household Income in Ada
Household Income Brackets in Ada
With 10 households falling in the category, the $25,000 to $34,999 income range is the most frequent in Ada, accounting for 50.0% of all households.
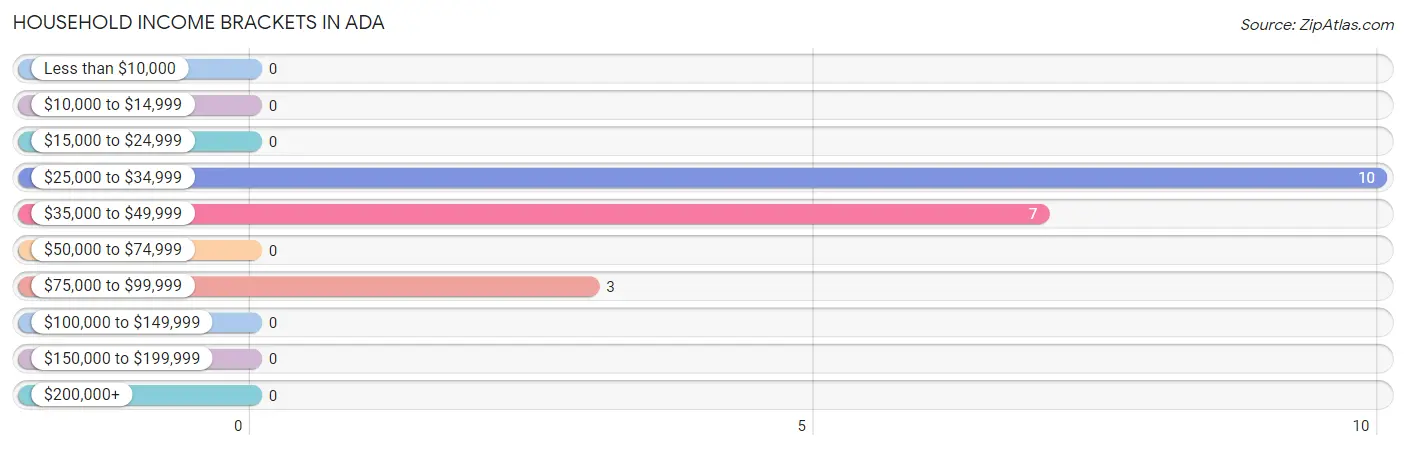
| Income Bracket | # Households | % Households |
| Less than $10,000 | 0 | 0.0% |
| $10,000 to $14,999 | 0 | 0.0% |
| $15,000 to $24,999 | 0 | 0.0% |
| $25,000 to $34,999 | 10 | 50.0% |
| $35,000 to $49,999 | 7 | 35.0% |
| $50,000 to $74,999 | 0 | 0.0% |
| $75,000 to $99,999 | 3 | 15.0% |
| $100,000 to $149,999 | 0 | 0.0% |
| $150,000 to $199,999 | 0 | 0.0% |
| $200,000+ | 0 | 0.0% |
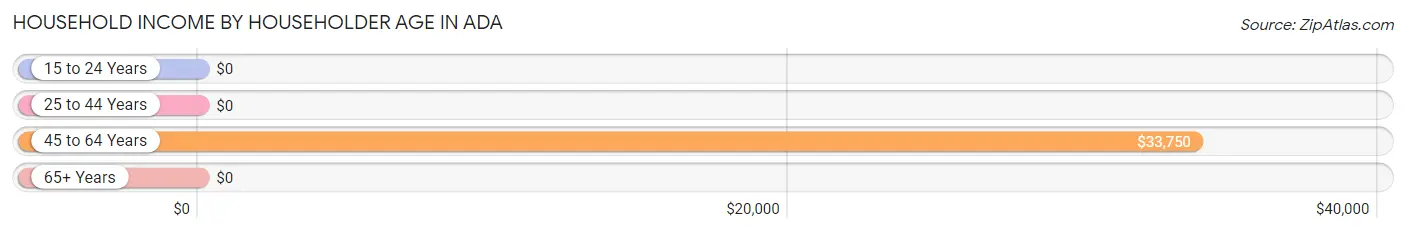
Household Income by Householder Age in Ada
The median household income in Ada is $33,750, with the highest median household income of $33,750 found in the 45 to 64 years age bracket for the primary householder. A total of 20 households (100.0%) fall into this category.
| Income Bracket | # Households | Median Income |
| 15 to 24 Years | 0 (0.0%) | $0 |
| 25 to 44 Years | 0 (0.0%) | $0 |
| 45 to 64 Years | 20 (100.0%) | $33,750 |
| 65+ Years | 0 (0.0%) | $0 |
| Total | 20 (100.0%) | $33,750 |
Poverty in Ada
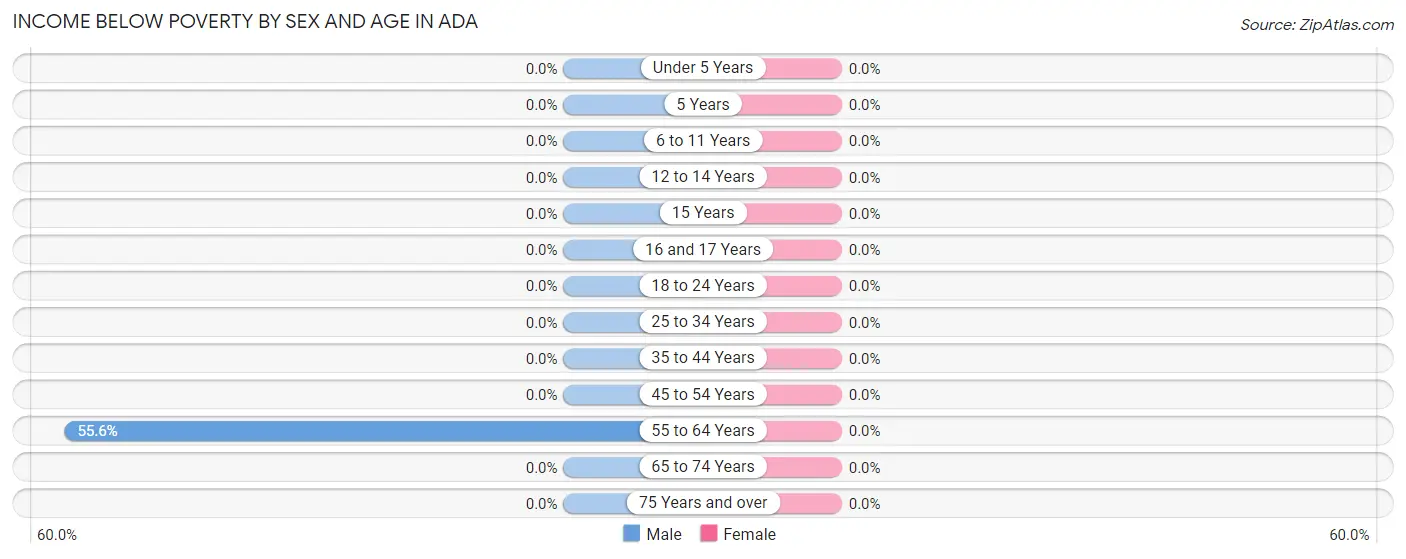
Income Below Poverty by Sex and Age in Ada
| Age Bracket | Male | Female |
| Under 5 Years | 0 (0.0%) | 0 (0.0%) |
| 5 Years | 0 (0.0%) | 0 (0.0%) |
| 6 to 11 Years | 0 (0.0%) | 0 (0.0%) |
| 12 to 14 Years | 0 (0.0%) | 0 (0.0%) |
| 15 Years | 0 (0.0%) | 0 (0.0%) |
| 16 and 17 Years | 0 (0.0%) | 0 (0.0%) |
| 18 to 24 Years | 0 (0.0%) | 0 (0.0%) |
| 25 to 34 Years | 0 (0.0%) | 0 (0.0%) |
| 35 to 44 Years | 0 (0.0%) | 0 (0.0%) |
| 45 to 54 Years | 0 (0.0%) | 0 (0.0%) |
| 55 to 64 Years | 10 (55.6%) | 0 (0.0%) |
| 65 to 74 Years | 0 (0.0%) | 0 (0.0%) |
| 75 Years and over | 0 (0.0%) | 0 (0.0%) |
| Total | 10 (55.6%) | 0 (0.0%) |
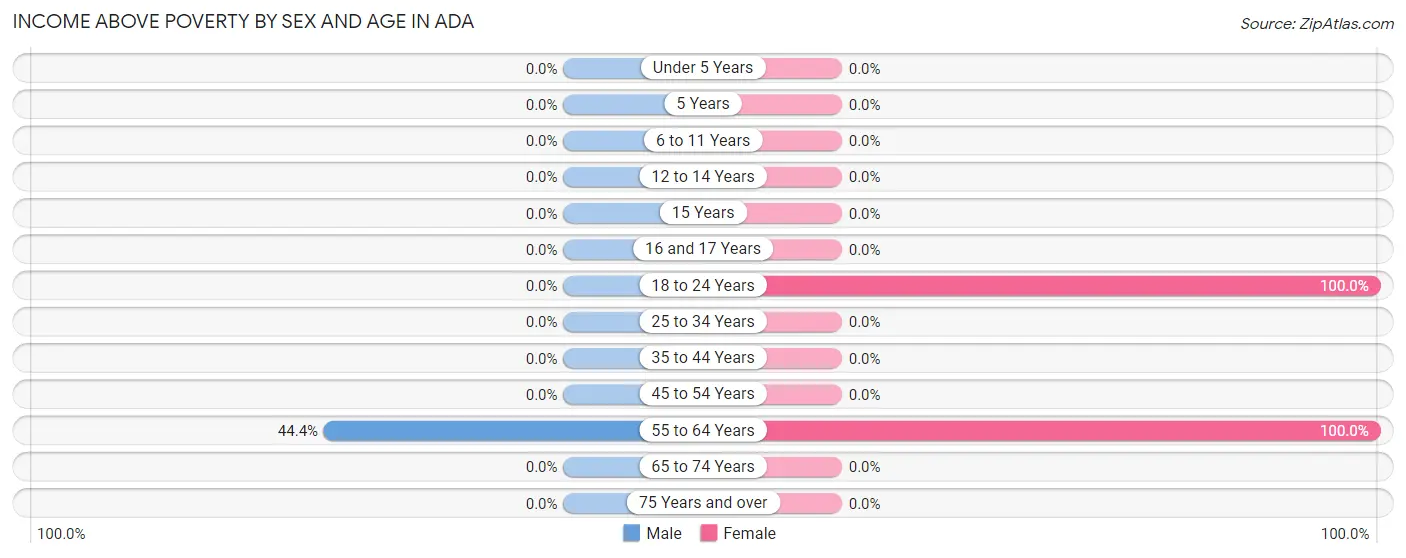
Income Above Poverty by Sex and Age in Ada
According to the poverty statistics in Ada, males aged 55 to 64 years and females aged 18 to 24 years are the age groups that are most secure financially, with 44.4% of males and 100.0% of females in these age groups living above the poverty line.
| Age Bracket | Male | Female |
| Under 5 Years | 0 (0.0%) | 0 (0.0%) |
| 5 Years | 0 (0.0%) | 0 (0.0%) |
| 6 to 11 Years | 0 (0.0%) | 0 (0.0%) |
| 12 to 14 Years | 0 (0.0%) | 0 (0.0%) |
| 15 Years | 0 (0.0%) | 0 (0.0%) |
| 16 and 17 Years | 0 (0.0%) | 0 (0.0%) |
| 18 to 24 Years | 0 (0.0%) | 1 (100.0%) |
| 25 to 34 Years | 0 (0.0%) | 0 (0.0%) |
| 35 to 44 Years | 0 (0.0%) | 0 (0.0%) |
| 45 to 54 Years | 0 (0.0%) | 0 (0.0%) |
| 55 to 64 Years | 8 (44.4%) | 15 (100.0%) |
| 65 to 74 Years | 0 (0.0%) | 0 (0.0%) |
| 75 Years and over | 0 (0.0%) | 0 (0.0%) |
| Total | 8 (44.4%) | 16 (100.0%) |
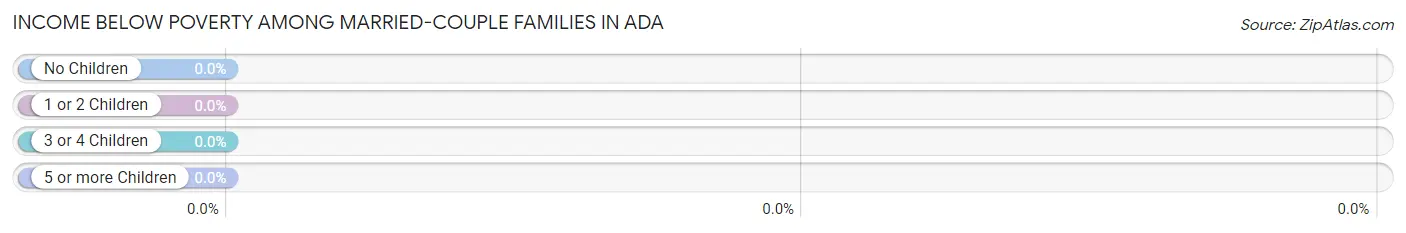
Income Below Poverty Among Married-Couple Families in Ada
| Children | Above Poverty | Below Poverty |
| No Children | 10 (100.0%) | 0 (0.0%) |
| 1 or 2 Children | 0 (0.0%) | 0 (0.0%) |
| 3 or 4 Children | 0 (0.0%) | 0 (0.0%) |
| 5 or more Children | 0 (0.0%) | 0 (0.0%) |
| Total | 10 (100.0%) | 0 (0.0%) |
Income Below Poverty Among Single-Parent Households in Ada
| Children | Single Father | Single Mother |
| No Children | 0 (0.0%) | 0 (0.0%) |
| 1 or 2 Children | 0 (0.0%) | 0 (0.0%) |
| 3 or 4 Children | 0 (0.0%) | 0 (0.0%) |
| 5 or more Children | 0 (0.0%) | 0 (0.0%) |
| Total | 0 (0.0%) | 0 (0.0%) |
Income Below Poverty Among Married-Couple vs Single-Parent Households in Ada
| Children | Married-Couple Families | Single-Parent Households |
| No Children | 0 (0.0%) | 0 (0.0%) |
| 1 or 2 Children | 0 (0.0%) | 0 (0.0%) |
| 3 or 4 Children | 0 (0.0%) | 0 (0.0%) |
| 5 or more Children | 0 (0.0%) | 0 (0.0%) |
| Total | 0 (0.0%) | 0 (0.0%) |
Race in Ada
The most populous races in Ada are White / Caucasian (30 | 88.2%), and Native / Alaskan (4 | 11.8%).
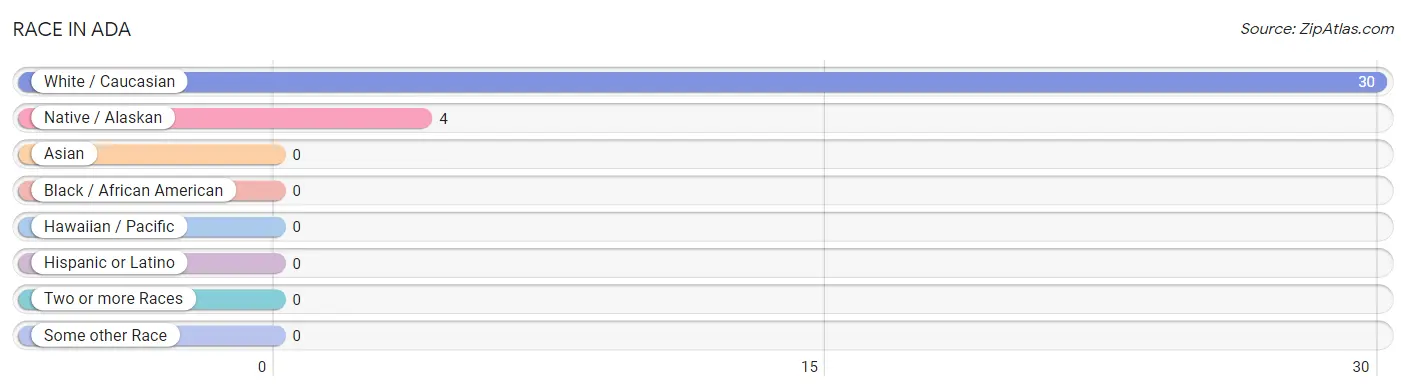
| Race | # Population | % Population |
| Asian | 0 | 0.0% |
| Black / African American | 0 | 0.0% |
| Hawaiian / Pacific | 0 | 0.0% |
| Hispanic or Latino | 0 | 0.0% |
| Native / Alaskan | 4 | 11.8% |
| White / Caucasian | 30 | 88.2% |
| Two or more Races | 0 | 0.0% |
| Some other Race | 0 | 0.0% |
| Total | 34 | 100.0% |
Ancestry in Ada
The most populous ancestries reported in Ada are Irish (15 | 44.1%), German (10 | 29.4%), Italian (10 | 29.4%), Polish (8 | 23.5%), and Swedish (7 | 20.6%), together accounting for 147.1% of all Ada residents.
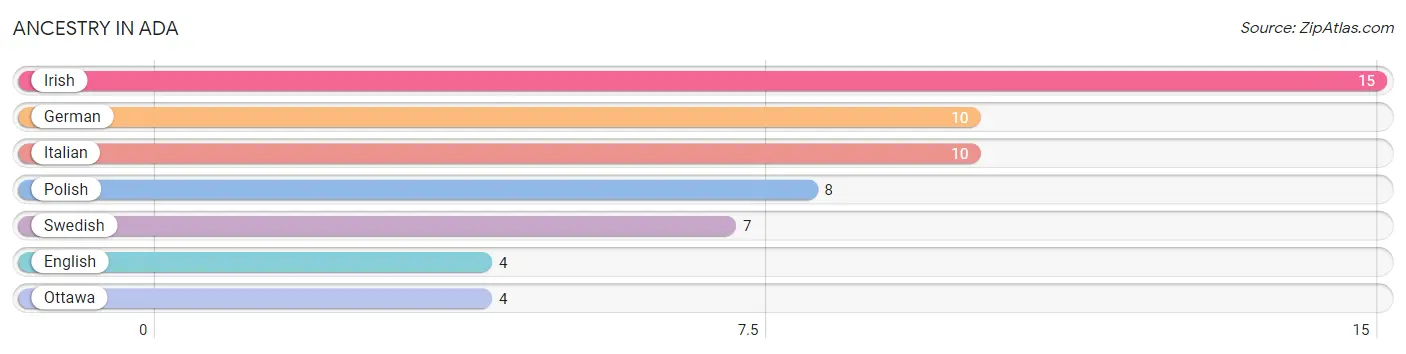
| Ancestry | # Population | % Population |
| English | 4 | 11.8% |
| German | 10 | 29.4% |
| Irish | 15 | 44.1% |
| Italian | 10 | 29.4% |
| Ottawa | 4 | 11.8% |
| Polish | 8 | 23.5% |
| Swedish | 7 | 20.6% | View All 7 Rows |
Immigrants in Ada

| Immigration Origin | # Population | % Population | View All 0 Rows |
Sex and Age in Ada
Sex and Age in Ada
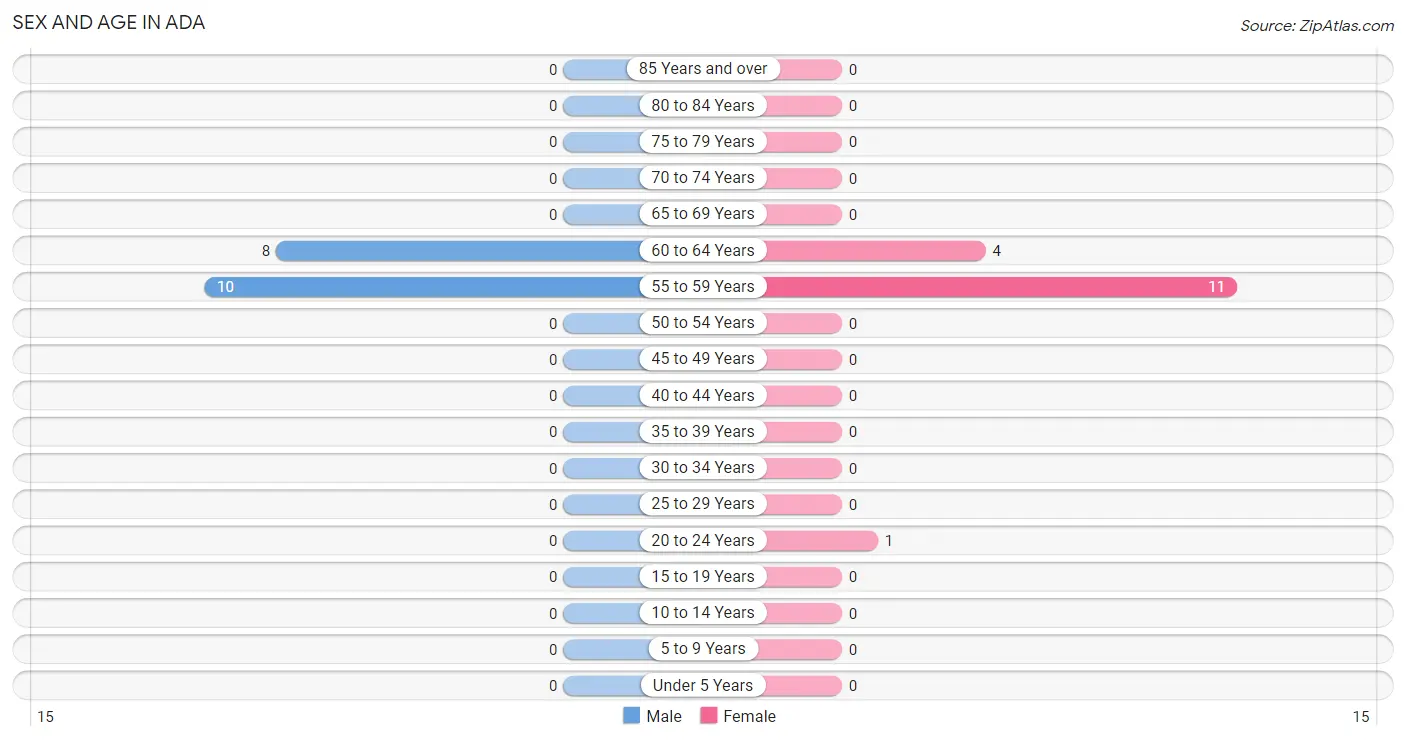
The most populous age groups in Ada are 55 to 59 Years (10 | 55.6%) for men and 55 to 59 Years (11 | 68.8%) for women.
| Age Bracket | Male | Female |
| Under 5 Years | 0 (0.0%) | 0 (0.0%) |
| 5 to 9 Years | 0 (0.0%) | 0 (0.0%) |
| 10 to 14 Years | 0 (0.0%) | 0 (0.0%) |
| 15 to 19 Years | 0 (0.0%) | 0 (0.0%) |
| 20 to 24 Years | 0 (0.0%) | 1 (6.2%) |
| 25 to 29 Years | 0 (0.0%) | 0 (0.0%) |
| 30 to 34 Years | 0 (0.0%) | 0 (0.0%) |
| 35 to 39 Years | 0 (0.0%) | 0 (0.0%) |
| 40 to 44 Years | 0 (0.0%) | 0 (0.0%) |
| 45 to 49 Years | 0 (0.0%) | 0 (0.0%) |
| 50 to 54 Years | 0 (0.0%) | 0 (0.0%) |
| 55 to 59 Years | 10 (55.6%) | 11 (68.8%) |
| 60 to 64 Years | 8 (44.4%) | 4 (25.0%) |
| 65 to 69 Years | 0 (0.0%) | 0 (0.0%) |
| 70 to 74 Years | 0 (0.0%) | 0 (0.0%) |
| 75 to 79 Years | 0 (0.0%) | 0 (0.0%) |
| 80 to 84 Years | 0 (0.0%) | 0 (0.0%) |
| 85 Years and over | 0 (0.0%) | 0 (0.0%) |
| Total | 18 (100.0%) | 16 (100.0%) |
Families and Households in Ada
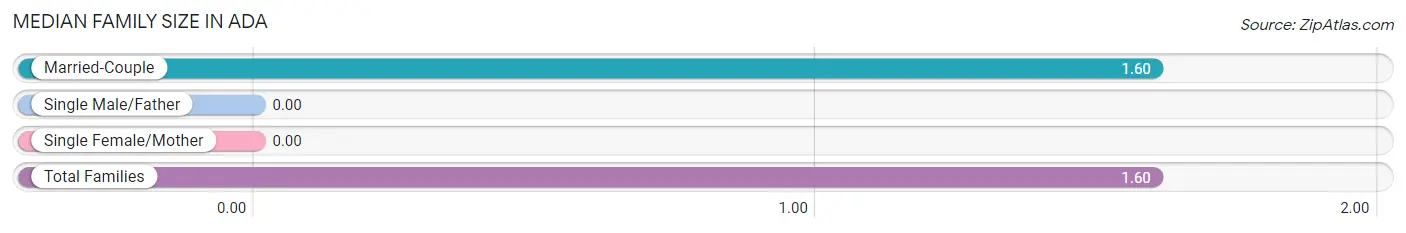
Median Family Size in Ada
| Family Type | # Families | Family Size |
| Married-Couple | 10 (100.0%) | 1.60 |
| Single Male/Father | 0 (0.0%) | - |
| Single Female/Mother | 0 (0.0%) | - |
| Total Families | 10 (100.0%) | 1.60 |
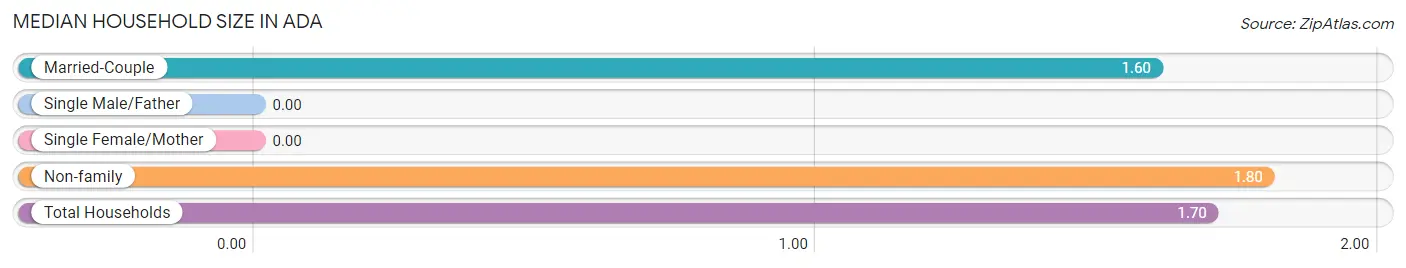
Median Household Size in Ada
| Household Type | # Households | Household Size |
| Married-Couple | 10 (50.0%) | 1.60 |
| Single Male/Father | 0 (0.0%) | - |
| Single Female/Mother | 0 (0.0%) | - |
| Non-family | 10 (50.0%) | 1.80 |
| Total Households | 20 (100.0%) | 1.70 |
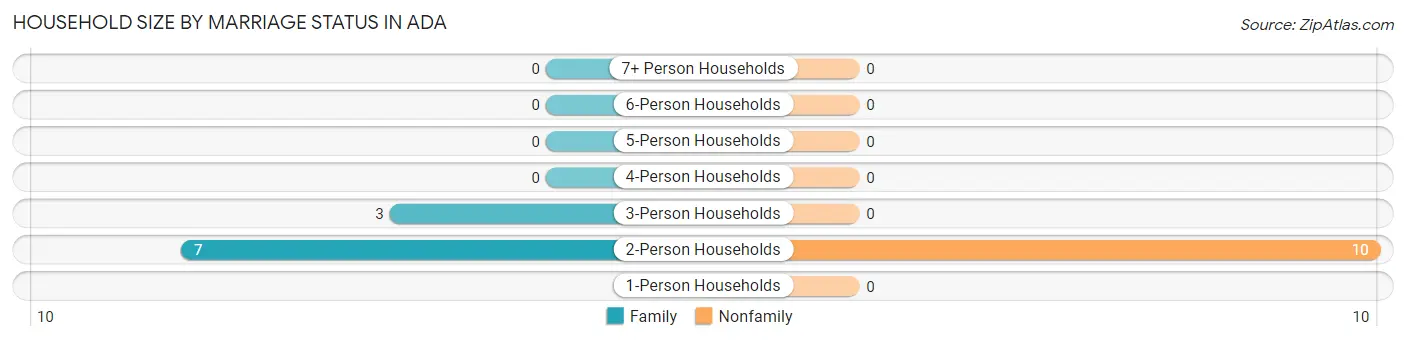
Household Size by Marriage Status in Ada
Out of a total of 20 households in Ada, 10 (50.0%) are family households, while 10 (50.0%) are nonfamily households. The most numerous type of family households are 2-person households, comprising 7, and the most common type of nonfamily households are 2-person households, comprising 10.
| Household Size | Family Households | Nonfamily Households |
| 1-Person Households | - | 0 (0.0%) |
| 2-Person Households | 7 (35.0%) | 10 (50.0%) |
| 3-Person Households | 3 (15.0%) | 0 (0.0%) |
| 4-Person Households | 0 (0.0%) | 0 (0.0%) |
| 5-Person Households | 0 (0.0%) | 0 (0.0%) |
| 6-Person Households | 0 (0.0%) | 0 (0.0%) |
| 7+ Person Households | 0 (0.0%) | 0 (0.0%) |
| Total | 10 (50.0%) | 10 (50.0%) |
Female Fertility in Ada
Fertility by Age in Ada
| Age Bracket | Women with Births | Births / 1,000 Women |
| 15 to 19 years | 0 (0.0%) | 0.0 |
| 20 to 34 years | 0 (0.0%) | 0.0 |
| 35 to 50 years | 0 (0.0%) | 0.0 |
| Total | 0 (0.0%) | 0.0 |
Fertility by Age by Marriage Status in Ada
| Age Bracket | Married | Unmarried |
| 15 to 19 years | 0 (0.0%) | 0 (0.0%) |
| 20 to 34 years | 0 (0.0%) | 0 (0.0%) |
| 35 to 50 years | 0 (0.0%) | 0 (0.0%) |
| Total | 0 (0.0%) | 0 (0.0%) |
Fertility by Education in Ada
| Educational Attainment | Women with Births | Births / 1,000 Women |
| Less than High School | 0 (0.0%) | 0.0 |
| High School Diploma | 0 (0.0%) | 0.0 |
| College or Associate's Degree | 0 (0.0%) | 0.0 |
| Bachelor's Degree | 0 (0.0%) | 0.0 |
| Graduate Degree | 0 (0.0%) | 0.0 |
| Total | 0 (0.0%) | 0.0 |
Fertility by Education by Marriage Status in Ada
| Educational Attainment | Married | Unmarried |
| Less than High School | 0 (0.0%) | 0 (0.0%) |
| High School Diploma | 0 (0.0%) | 0 (0.0%) |
| College or Associate's Degree | 0 (0.0%) | 0 (0.0%) |
| Bachelor's Degree | 0 (0.0%) | 0 (0.0%) |
| Graduate Degree | 0 (0.0%) | 0 (0.0%) |
| Total | 0 (0.0%) | 0 (0.0%) |
Employment Characteristics in Ada
Employment by Class of Employer in Ada
Among the 9 employed individuals in Ada, private company employees (8 | 88.9%), and self-employed (not incorporated) (1 | 11.1%) make up the most common classes of employment.
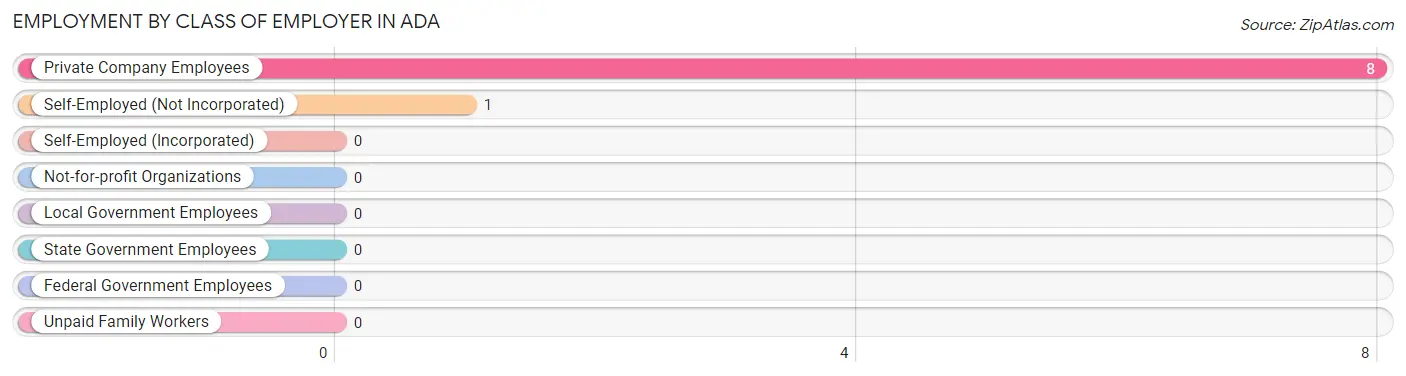
| Employer Class | # Employees | % Employees |
| Private Company Employees | 8 | 88.9% |
| Self-Employed (Incorporated) | 0 | 0.0% |
| Self-Employed (Not Incorporated) | 1 | 11.1% |
| Not-for-profit Organizations | 0 | 0.0% |
| Local Government Employees | 0 | 0.0% |
| State Government Employees | 0 | 0.0% |
| Federal Government Employees | 0 | 0.0% |
| Unpaid Family Workers | 0 | 0.0% |
| Total | 9 | 100.0% |
Employment Status by Age in Ada
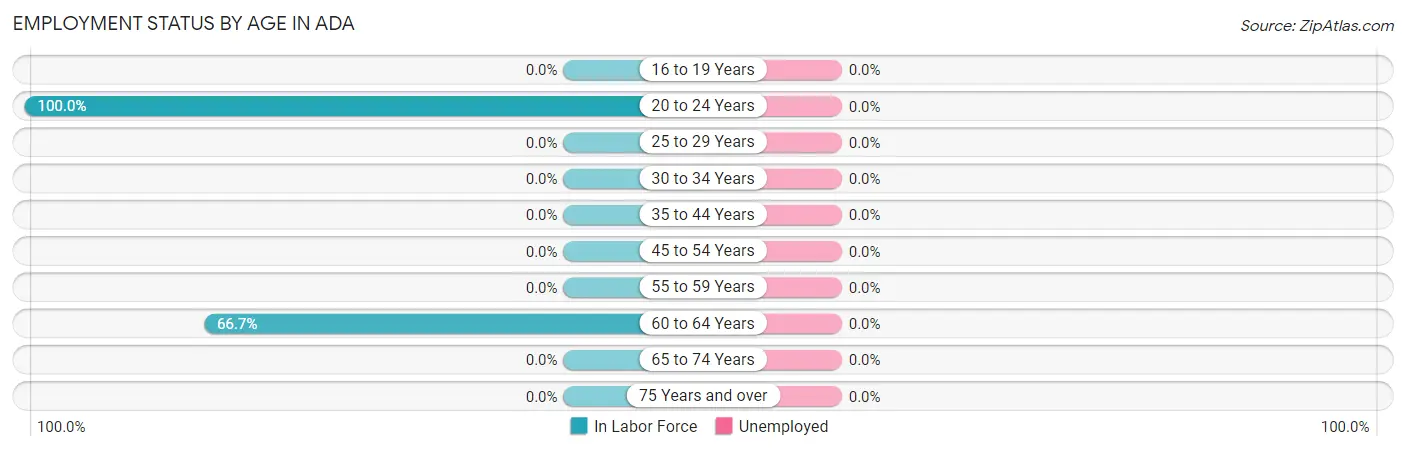
| Age Bracket | In Labor Force | Unemployed |
| 16 to 19 Years | 0 (0.0%) | 0 (0.0%) |
| 20 to 24 Years | 1 (100.0%) | 0 (0.0%) |
| 25 to 29 Years | 0 (0.0%) | 0 (0.0%) |
| 30 to 34 Years | 0 (0.0%) | 0 (0.0%) |
| 35 to 44 Years | 0 (0.0%) | 0 (0.0%) |
| 45 to 54 Years | 0 (0.0%) | 0 (0.0%) |
| 55 to 59 Years | 0 (0.0%) | 0 (0.0%) |
| 60 to 64 Years | 8 (66.7%) | 0 (0.0%) |
| 65 to 74 Years | 0 (0.0%) | 0 (0.0%) |
| 75 Years and over | 0 (0.0%) | 0 (0.0%) |
| Total | 9 (26.5%) | 0 (0.0%) |
Employment Status by Educational Attainment in Ada
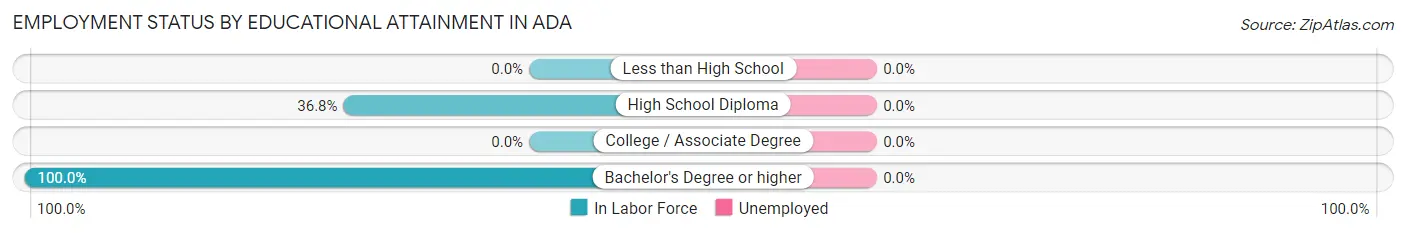
| Educational Attainment | In Labor Force | Unemployed |
| Less than High School | 0 (0.0%) | 0 (0.0%) |
| High School Diploma | 7 (36.8%) | 0 (0.0%) |
| College / Associate Degree | 0 (0.0%) | 0 (0.0%) |
| Bachelor's Degree or higher | 1 (100.0%) | 0 (0.0%) |
| Total | 8 (24.2%) | 0 (0.0%) |
Employment Occupations by Sex in Ada
Management, Business, Science and Arts Occupations
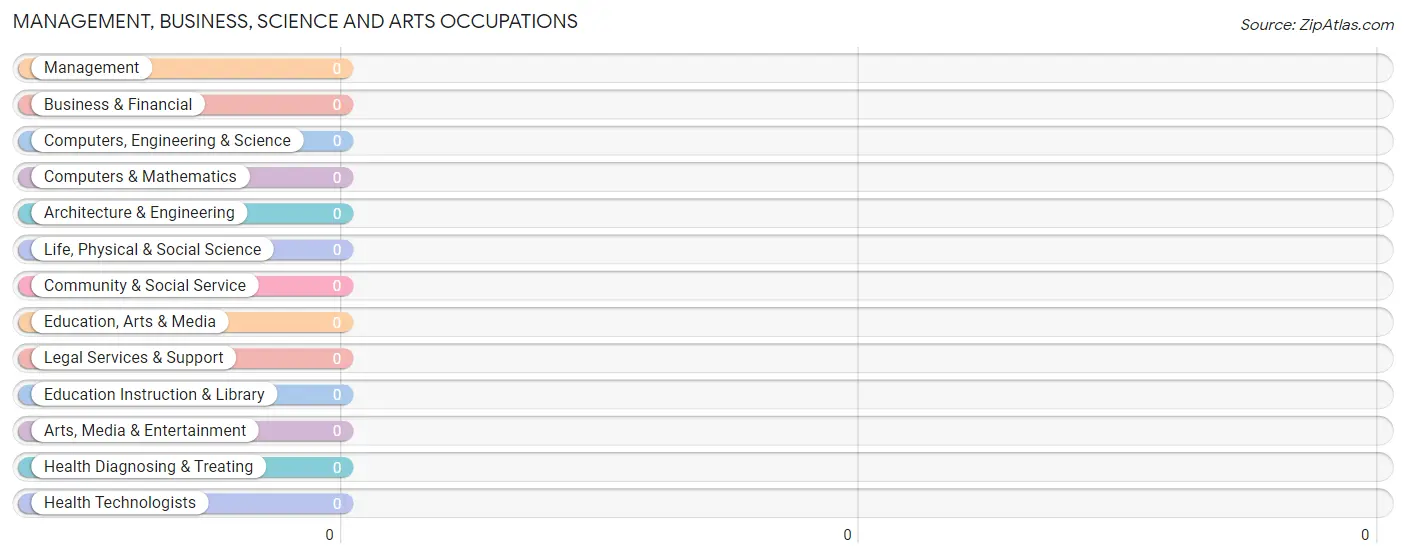
Management, Business, Science and Arts Occupations by Sex
| Occupation | Male | Female |
| Management | 0 (0.0%) | 0 (0.0%) |
| Business & Financial | 0 (0.0%) | 0 (0.0%) |
| Computers, Engineering & Science | 0 (0.0%) | 0 (0.0%) |
| Computers & Mathematics | 0 (0.0%) | 0 (0.0%) |
| Architecture & Engineering | 0 (0.0%) | 0 (0.0%) |
| Life, Physical & Social Science | 0 (0.0%) | 0 (0.0%) |
| Community & Social Service | 0 (0.0%) | 0 (0.0%) |
| Education, Arts & Media | 0 (0.0%) | 0 (0.0%) |
| Legal Services & Support | 0 (0.0%) | 0 (0.0%) |
| Education Instruction & Library | 0 (0.0%) | 0 (0.0%) |
| Arts, Media & Entertainment | 0 (0.0%) | 0 (0.0%) |
| Health Diagnosing & Treating | 0 (0.0%) | 0 (0.0%) |
| Health Technologists | 0 (0.0%) | 0 (0.0%) |
| Total (Category) | 0 (0.0%) | 0 (0.0%) |
| Total (Overall) | 8 (88.9%) | 1 (11.1%) |
Services Occupations
Services Occupations by Sex
| Occupation | Male | Female |
| Healthcare Support | 0 (0.0%) | 0 (0.0%) |
| Security & Protection | 0 (0.0%) | 0 (0.0%) |
| Firefighting & Prevention | 0 (0.0%) | 0 (0.0%) |
| Law Enforcement | 0 (0.0%) | 0 (0.0%) |
| Food Preparation & Serving | 0 (0.0%) | 0 (0.0%) |
| Cleaning & Maintenance | 0 (0.0%) | 0 (0.0%) |
| Personal Care & Service | 0 (0.0%) | 0 (0.0%) |
| Total (Category) | 0 (0.0%) | 0 (0.0%) |
| Total (Overall) | 8 (88.9%) | 1 (11.1%) |
Sales and Office Occupations
The most common Sales and Office occupations in Ada are , and Sales & Related (1 | 11.1%).
Sales and Office Occupations by Sex
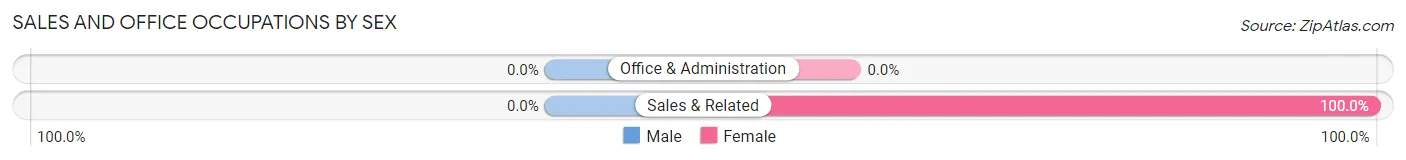
| Occupation | Male | Female |
| Sales & Related | 0 (0.0%) | 1 (100.0%) |
| Office & Administration | 0 (0.0%) | 0 (0.0%) |
| Total (Category) | 0 (0.0%) | 1 (100.0%) |
| Total (Overall) | 8 (88.9%) | 1 (11.1%) |
Natural Resources, Construction and Maintenance Occupations
The most common Natural Resources, Construction and Maintenance occupations in Ada are , and Construction & Extraction (1 | 11.1%).
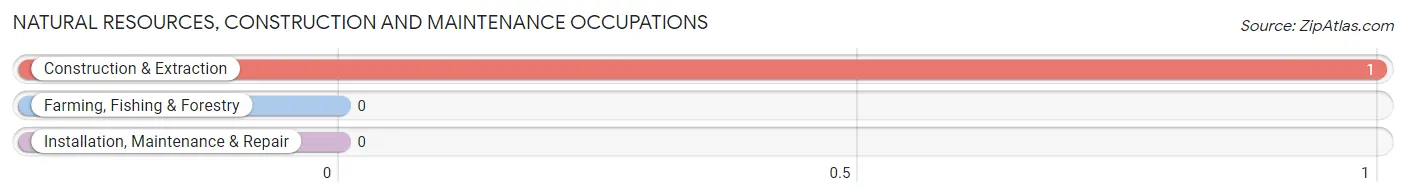
Natural Resources, Construction and Maintenance Occupations by Sex
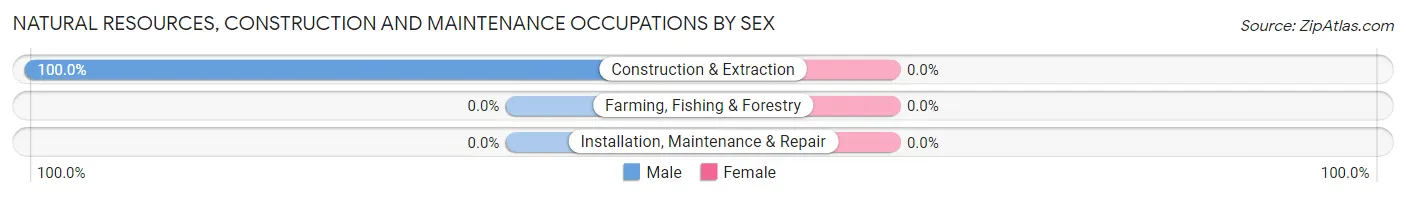
| Occupation | Male | Female |
| Farming, Fishing & Forestry | 0 (0.0%) | 0 (0.0%) |
| Construction & Extraction | 1 (100.0%) | 0 (0.0%) |
| Installation, Maintenance & Repair | 0 (0.0%) | 0 (0.0%) |
| Total (Category) | 1 (100.0%) | 0 (0.0%) |
| Total (Overall) | 8 (88.9%) | 1 (11.1%) |
Production, Transportation and Moving Occupations
The most common Production, Transportation and Moving occupations in Ada are , and Material Moving (7 | 77.8%).
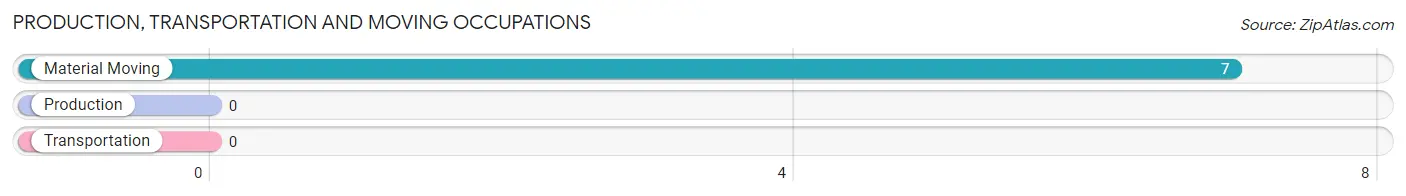
Production, Transportation and Moving Occupations by Sex
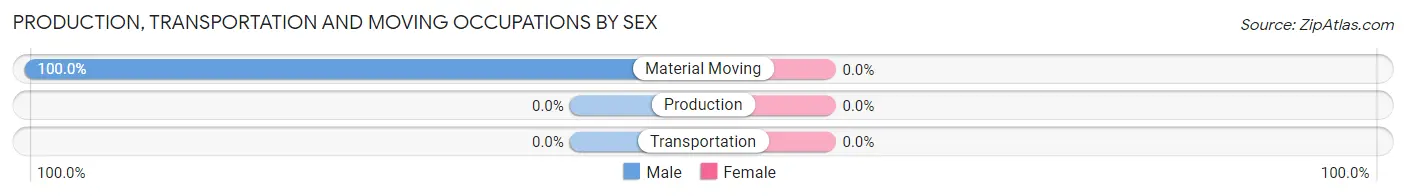
| Occupation | Male | Female |
| Production | 0 (0.0%) | 0 (0.0%) |
| Transportation | 0 (0.0%) | 0 (0.0%) |
| Material Moving | 7 (100.0%) | 0 (0.0%) |
| Total (Category) | 7 (100.0%) | 0 (0.0%) |
| Total (Overall) | 8 (88.9%) | 1 (11.1%) |
Employment Industries by Sex in Ada
Employment Industries in Ada
The major employment industries in Ada include Manufacturing (7 | 77.8%), Construction (1 | 11.1%), and Retail Trade (1 | 11.1%).
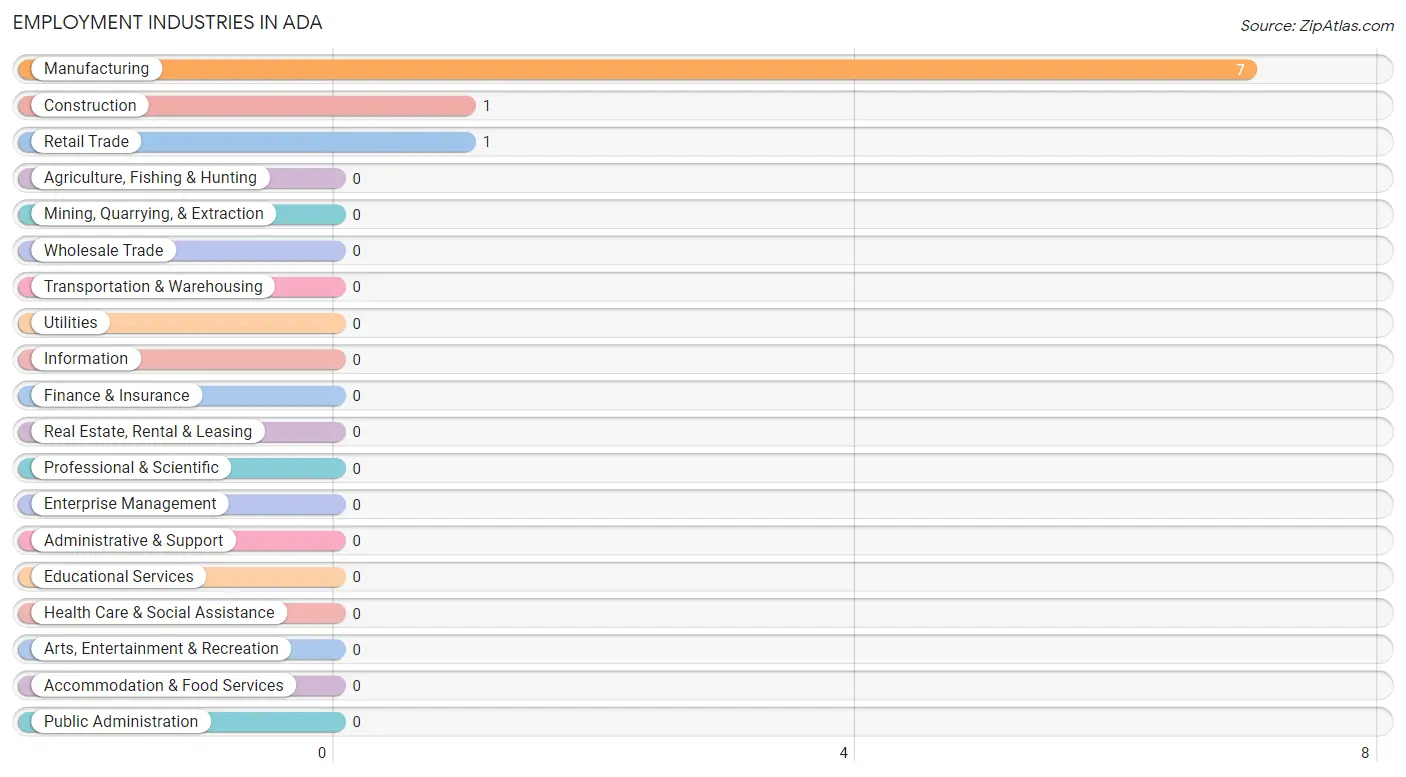
Employment Industries by Sex in Ada
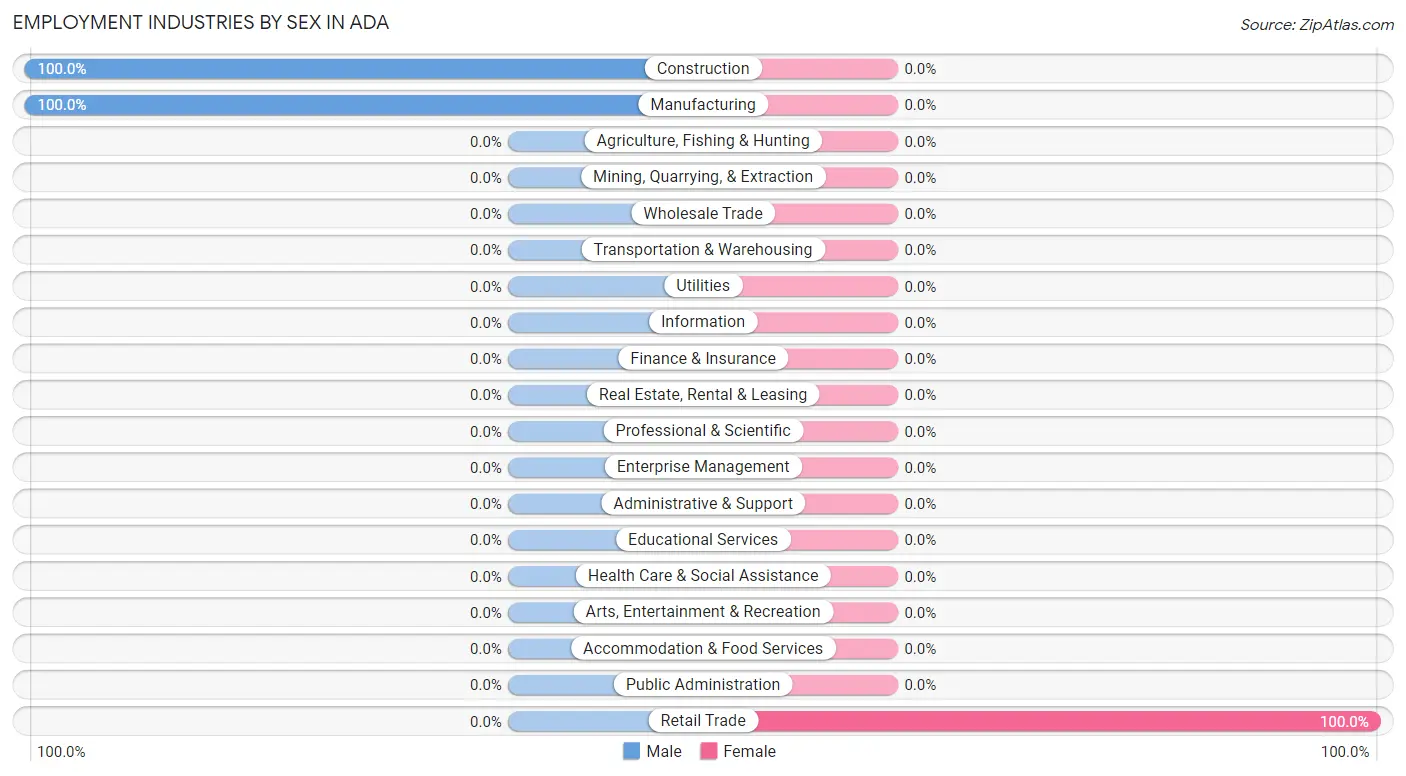
| Industry | Male | Female |
| Agriculture, Fishing & Hunting | 0 (0.0%) | 0 (0.0%) |
| Mining, Quarrying, & Extraction | 0 (0.0%) | 0 (0.0%) |
| Construction | 1 (100.0%) | 0 (0.0%) |
| Manufacturing | 7 (100.0%) | 0 (0.0%) |
| Wholesale Trade | 0 (0.0%) | 0 (0.0%) |
| Retail Trade | 0 (0.0%) | 1 (100.0%) |
| Transportation & Warehousing | 0 (0.0%) | 0 (0.0%) |
| Utilities | 0 (0.0%) | 0 (0.0%) |
| Information | 0 (0.0%) | 0 (0.0%) |
| Finance & Insurance | 0 (0.0%) | 0 (0.0%) |
| Real Estate, Rental & Leasing | 0 (0.0%) | 0 (0.0%) |
| Professional & Scientific | 0 (0.0%) | 0 (0.0%) |
| Enterprise Management | 0 (0.0%) | 0 (0.0%) |
| Administrative & Support | 0 (0.0%) | 0 (0.0%) |
| Educational Services | 0 (0.0%) | 0 (0.0%) |
| Health Care & Social Assistance | 0 (0.0%) | 0 (0.0%) |
| Arts, Entertainment & Recreation | 0 (0.0%) | 0 (0.0%) |
| Accommodation & Food Services | 0 (0.0%) | 0 (0.0%) |
| Public Administration | 0 (0.0%) | 0 (0.0%) |
| Total | 8 (88.9%) | 1 (11.1%) |
Education in Ada
School Enrollment in Ada
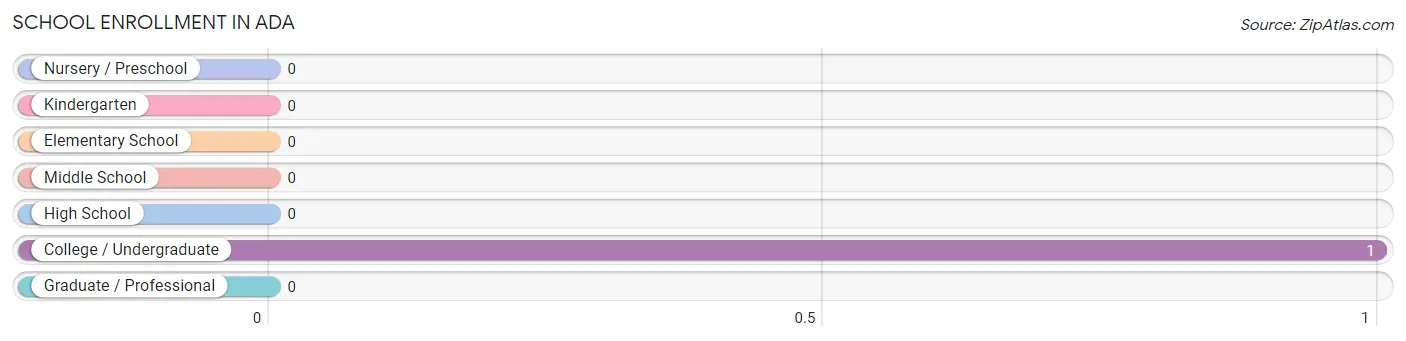
| School Level | # Students | % Students |
| Nursery / Preschool | 0 | 0.0% |
| Kindergarten | 0 | 0.0% |
| Elementary School | 0 | 0.0% |
| Middle School | 0 | 0.0% |
| High School | 0 | 0.0% |
| College / Undergraduate | 1 | 100.0% |
| Graduate / Professional | 0 | 0.0% |
| Total | 1 | 100.0% |
School Enrollment by Age by Funding Source in Ada
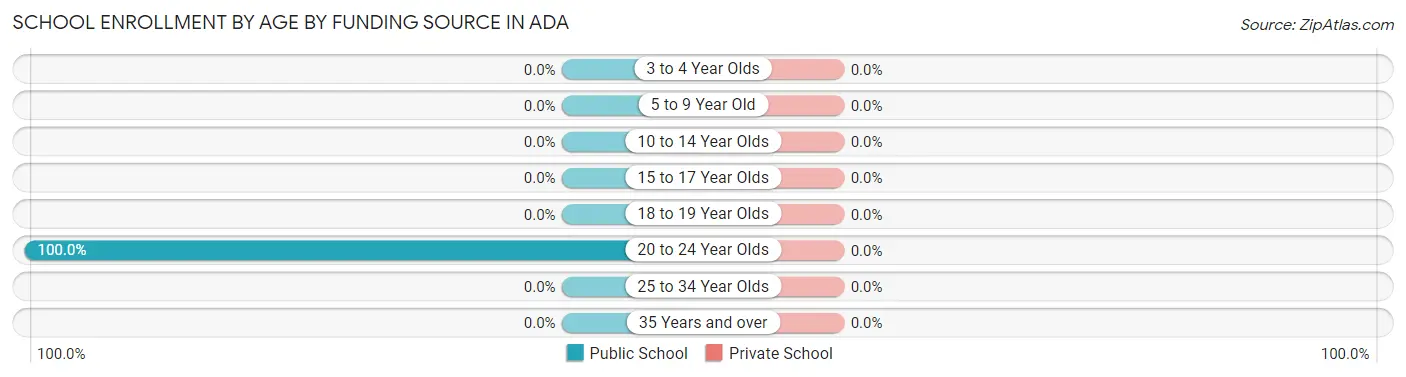
| Age Bracket | Public School | Private School |
| 3 to 4 Year Olds | 0 (0.0%) | 0 (0.0%) |
| 5 to 9 Year Old | 0 (0.0%) | 0 (0.0%) |
| 10 to 14 Year Olds | 0 (0.0%) | 0 (0.0%) |
| 15 to 17 Year Olds | 0 (0.0%) | 0 (0.0%) |
| 18 to 19 Year Olds | 0 (0.0%) | 0 (0.0%) |
| 20 to 24 Year Olds | 1 (100.0%) | 0 (0.0%) |
| 25 to 34 Year Olds | 0 (0.0%) | 0 (0.0%) |
| 35 Years and over | 0 (0.0%) | 0 (0.0%) |
| Total | 1 (100.0%) | 0 (0.0%) |
Educational Attainment by Field of Study in Ada
, and bio, nature & agricultural (1 | 100.0%) are the most common fields of study among 1 individuals in Ada who have obtained a bachelor's degree or higher.
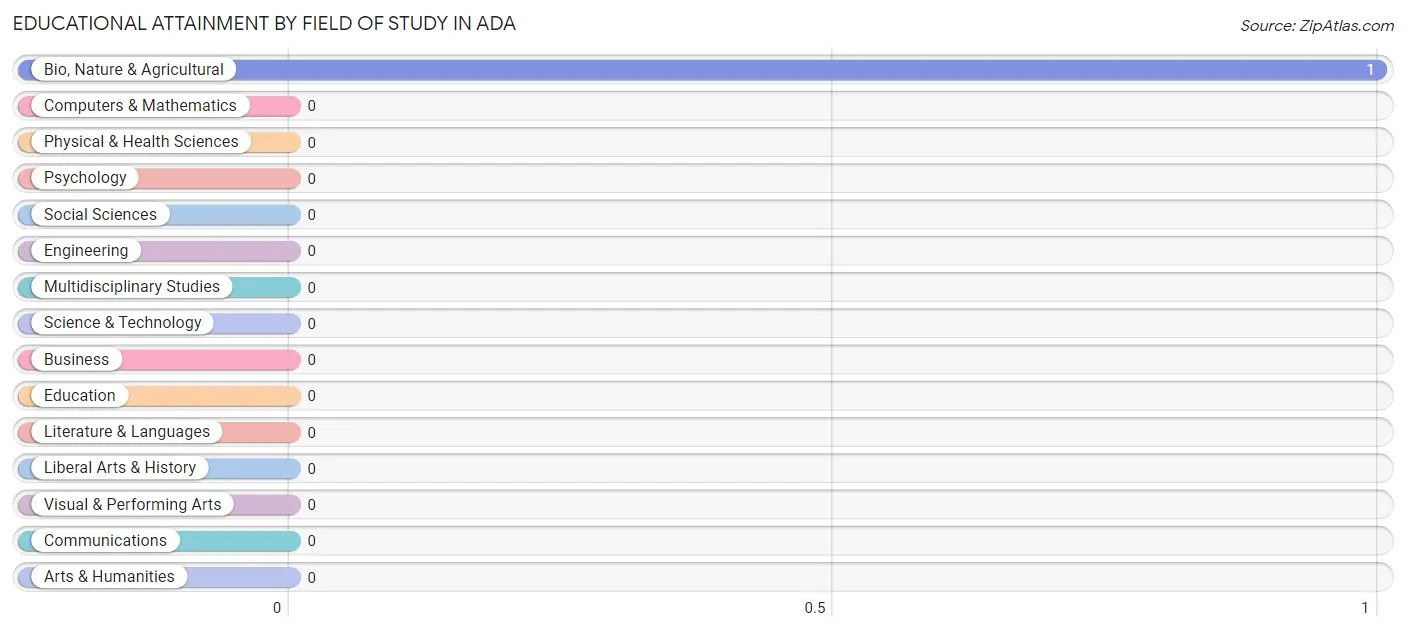
| Field of Study | # Graduates | % Graduates |
| Computers & Mathematics | 0 | 0.0% |
| Bio, Nature & Agricultural | 1 | 100.0% |
| Physical & Health Sciences | 0 | 0.0% |
| Psychology | 0 | 0.0% |
| Social Sciences | 0 | 0.0% |
| Engineering | 0 | 0.0% |
| Multidisciplinary Studies | 0 | 0.0% |
| Science & Technology | 0 | 0.0% |
| Business | 0 | 0.0% |
| Education | 0 | 0.0% |
| Literature & Languages | 0 | 0.0% |
| Liberal Arts & History | 0 | 0.0% |
| Visual & Performing Arts | 0 | 0.0% |
| Communications | 0 | 0.0% |
| Arts & Humanities | 0 | 0.0% |
| Total | 1 | 100.0% |
Transportation & Commute in Ada
Vehicle Availability by Sex in Ada
The most prevalent vehicle ownership categories in Ada are males with 1 vehicle (7, accounting for 87.5%) and females with 1 vehicle (0, making up 700.0%).
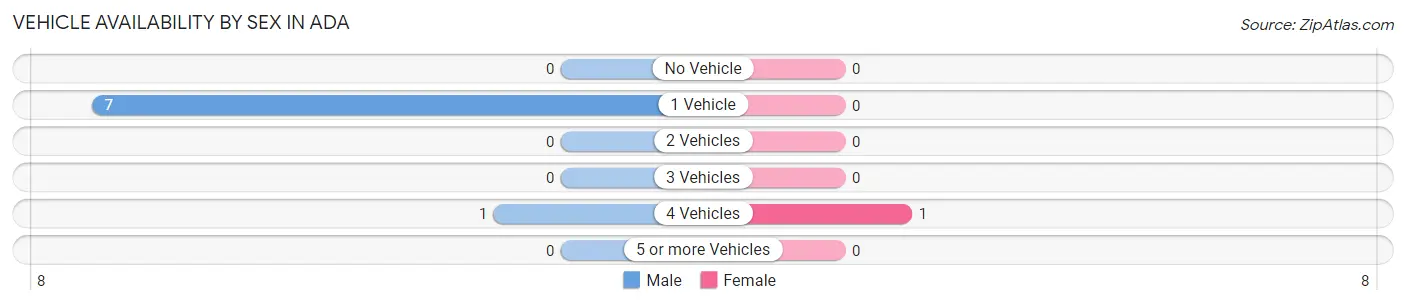
| Vehicles Available | Male | Female |
| No Vehicle | 0 (0.0%) | 0 (0.0%) |
| 1 Vehicle | 7 (87.5%) | 0 (0.0%) |
| 2 Vehicles | 0 (0.0%) | 0 (0.0%) |
| 3 Vehicles | 0 (0.0%) | 0 (0.0%) |
| 4 Vehicles | 1 (12.5%) | 1 (100.0%) |
| 5 or more Vehicles | 0 (0.0%) | 0 (0.0%) |
| Total | 8 (100.0%) | 1 (100.0%) |
Commute Time in Ada
The most frequently occuring commute durations in Ada are 20 to 24 minutes (8 commuters, 88.9%), 10 to 14 minutes (1 commuters, 11.1%), and less than 5 minutes (0 commuters, 0.0%).
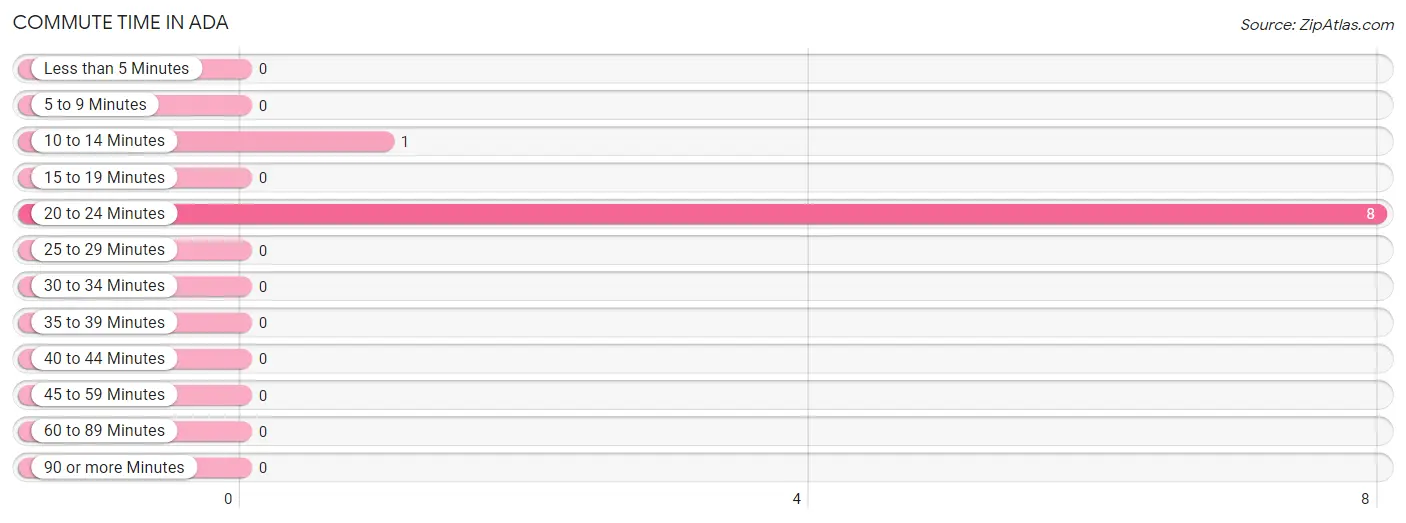
| Commute Time | # Commuters | % Commuters |
| Less than 5 Minutes | 0 | 0.0% |
| 5 to 9 Minutes | 0 | 0.0% |
| 10 to 14 Minutes | 1 | 11.1% |
| 15 to 19 Minutes | 0 | 0.0% |
| 20 to 24 Minutes | 8 | 88.9% |
| 25 to 29 Minutes | 0 | 0.0% |
| 30 to 34 Minutes | 0 | 0.0% |
| 35 to 39 Minutes | 0 | 0.0% |
| 40 to 44 Minutes | 0 | 0.0% |
| 45 to 59 Minutes | 0 | 0.0% |
| 60 to 89 Minutes | 0 | 0.0% |
| 90 or more Minutes | 0 | 0.0% |
Commute Time by Sex in Ada
The most common commute times in Ada are 20 to 24 minutes (8 commuters, 100.0%) for males and 10 to 14 minutes (1 commuters, 100.0%) for females.
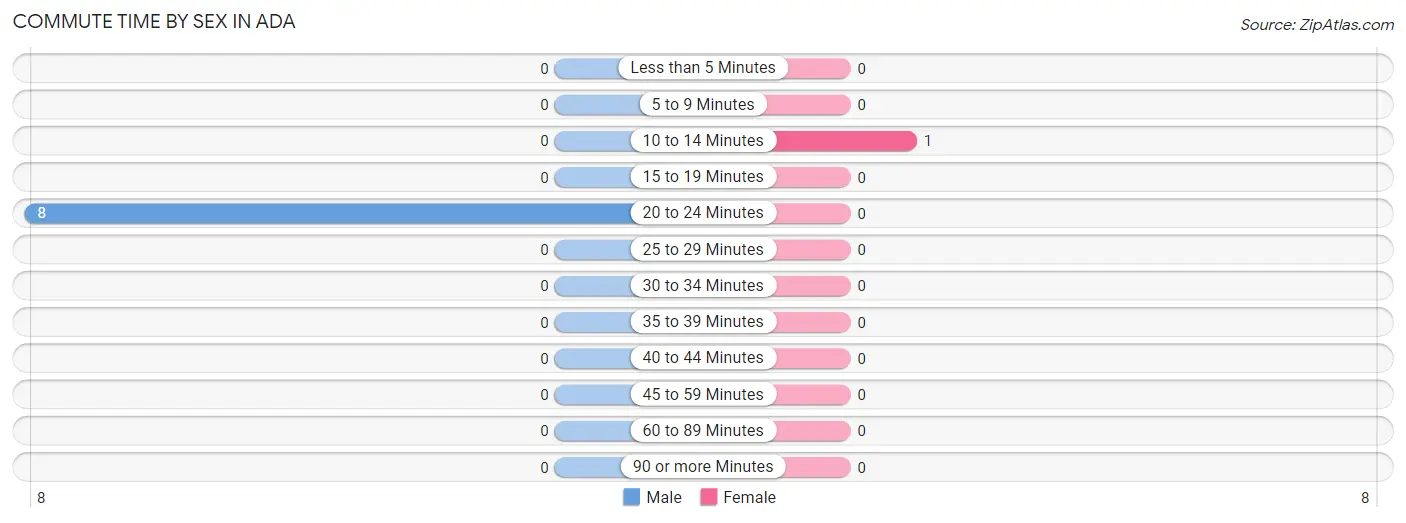
| Commute Time | Male | Female |
| Less than 5 Minutes | 0 (0.0%) | 0 (0.0%) |
| 5 to 9 Minutes | 0 (0.0%) | 0 (0.0%) |
| 10 to 14 Minutes | 0 (0.0%) | 1 (100.0%) |
| 15 to 19 Minutes | 0 (0.0%) | 0 (0.0%) |
| 20 to 24 Minutes | 8 (100.0%) | 0 (0.0%) |
| 25 to 29 Minutes | 0 (0.0%) | 0 (0.0%) |
| 30 to 34 Minutes | 0 (0.0%) | 0 (0.0%) |
| 35 to 39 Minutes | 0 (0.0%) | 0 (0.0%) |
| 40 to 44 Minutes | 0 (0.0%) | 0 (0.0%) |
| 45 to 59 Minutes | 0 (0.0%) | 0 (0.0%) |
| 60 to 89 Minutes | 0 (0.0%) | 0 (0.0%) |
| 90 or more Minutes | 0 (0.0%) | 0 (0.0%) |
Time of Departure to Work by Sex in Ada
The most frequent times of departure to work in Ada are 6:30 AM to 6:59 AM (7, 87.5%) for males and 11:00 AM to 11:59 AM (1, 100.0%) for females.
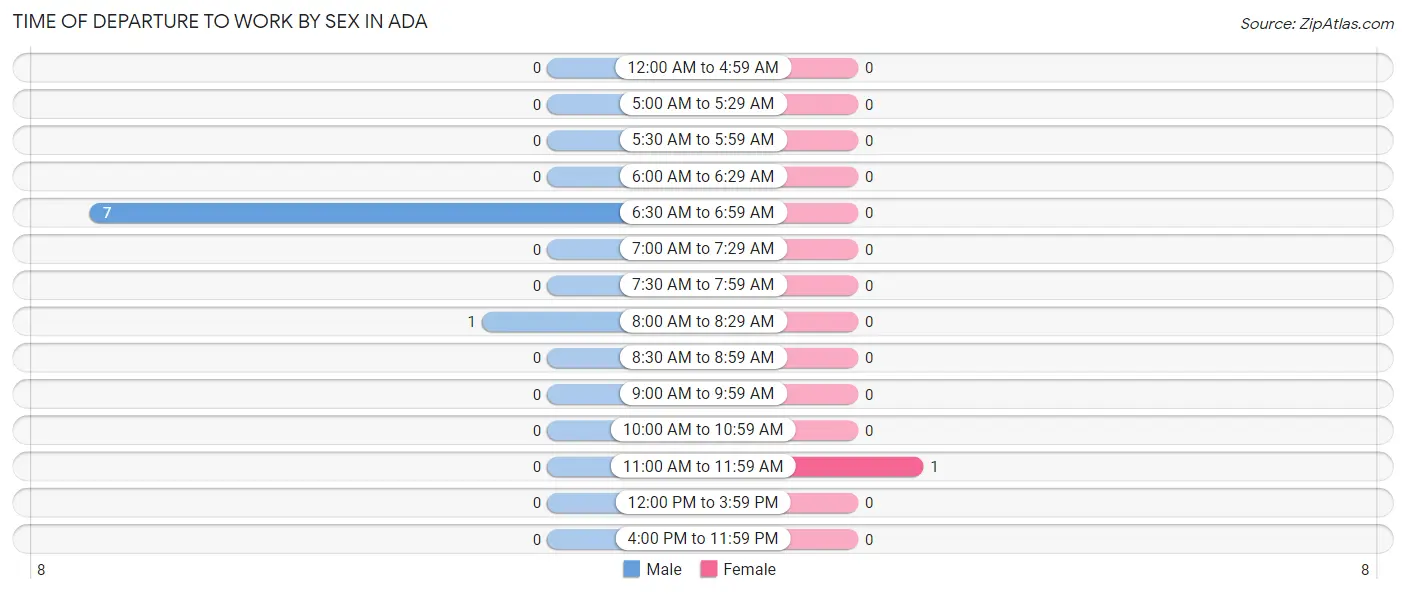
| Time of Departure | Male | Female |
| 12:00 AM to 4:59 AM | 0 (0.0%) | 0 (0.0%) |
| 5:00 AM to 5:29 AM | 0 (0.0%) | 0 (0.0%) |
| 5:30 AM to 5:59 AM | 0 (0.0%) | 0 (0.0%) |
| 6:00 AM to 6:29 AM | 0 (0.0%) | 0 (0.0%) |
| 6:30 AM to 6:59 AM | 7 (87.5%) | 0 (0.0%) |
| 7:00 AM to 7:29 AM | 0 (0.0%) | 0 (0.0%) |
| 7:30 AM to 7:59 AM | 0 (0.0%) | 0 (0.0%) |
| 8:00 AM to 8:29 AM | 1 (12.5%) | 0 (0.0%) |
| 8:30 AM to 8:59 AM | 0 (0.0%) | 0 (0.0%) |
| 9:00 AM to 9:59 AM | 0 (0.0%) | 0 (0.0%) |
| 10:00 AM to 10:59 AM | 0 (0.0%) | 0 (0.0%) |
| 11:00 AM to 11:59 AM | 0 (0.0%) | 1 (100.0%) |
| 12:00 PM to 3:59 PM | 0 (0.0%) | 0 (0.0%) |
| 4:00 PM to 11:59 PM | 0 (0.0%) | 0 (0.0%) |
| Total | 8 (100.0%) | 1 (100.0%) |
Housing Occupancy in Ada
Occupancy by Ownership in Ada
Of the total 20 dwellings in Ada, owner-occupied units account for 20 (100.0%), while renter-occupied units make up 0 (0.0%).
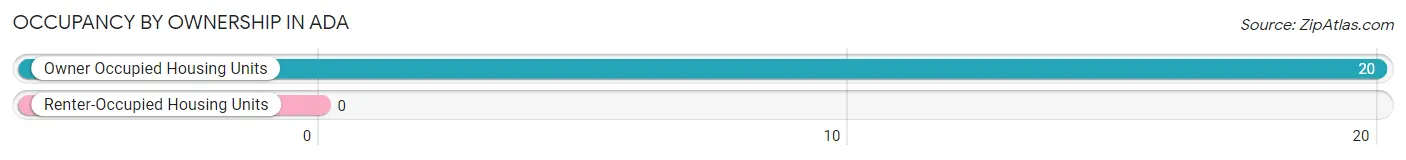
| Occupancy | # Housing Units | % Housing Units |
| Owner Occupied Housing Units | 20 | 100.0% |
| Renter-Occupied Housing Units | 0 | 0.0% |
| Total Occupied Housing Units | 20 | 100.0% |
Occupancy by Household Size in Ada
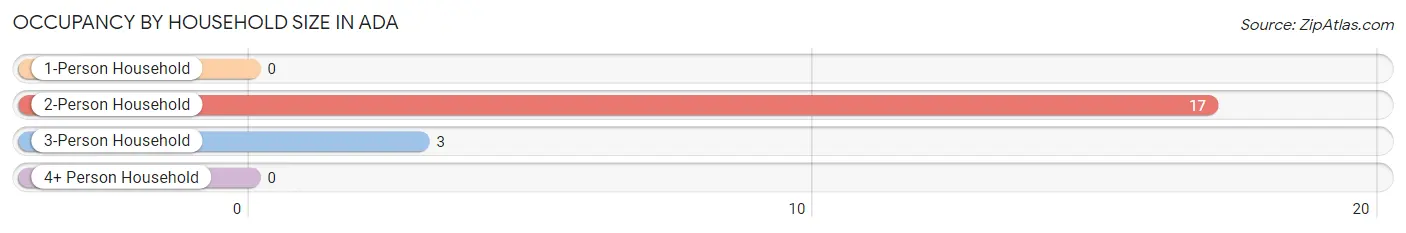
| Household Size | # Housing Units | % Housing Units |
| 1-Person Household | 0 | 0.0% |
| 2-Person Household | 17 | 85.0% |
| 3-Person Household | 3 | 15.0% |
| 4+ Person Household | 0 | 0.0% |
| Total Housing Units | 20 | 100.0% |
Occupancy by Ownership by Household Size in Ada
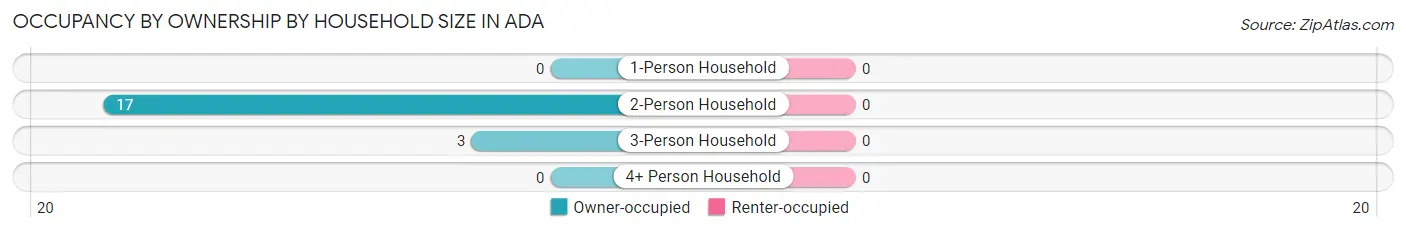
| Household Size | Owner-occupied | Renter-occupied |
| 1-Person Household | 0 (0.0%) | 0 (0.0%) |
| 2-Person Household | 17 (100.0%) | 0 (0.0%) |
| 3-Person Household | 3 (100.0%) | 0 (0.0%) |
| 4+ Person Household | 0 (0.0%) | 0 (0.0%) |
| Total Housing Units | 20 (100.0%) | 0 (0.0%) |
Occupancy by Educational Attainment in Ada
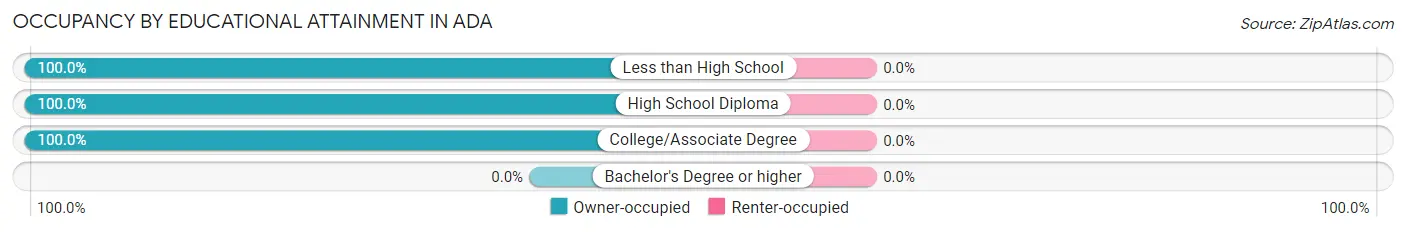
| Household Size | Owner-occupied | Renter-occupied |
| Less than High School | 3 (100.0%) | 0 (0.0%) |
| High School Diploma | 7 (100.0%) | 0 (0.0%) |
| College/Associate Degree | 10 (100.0%) | 0 (0.0%) |
| Bachelor's Degree or higher | 0 (0.0%) | 0 (0.0%) |
Occupancy by Age of Householder in Ada
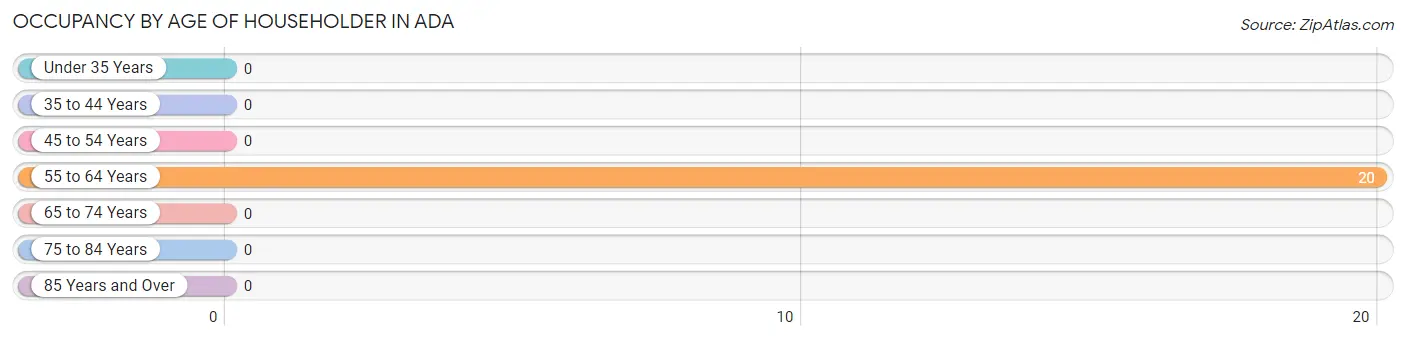
| Age Bracket | # Households | % Households |
| Under 35 Years | 0 | 0.0% |
| 35 to 44 Years | 0 | 0.0% |
| 45 to 54 Years | 0 | 0.0% |
| 55 to 64 Years | 20 | 100.0% |
| 65 to 74 Years | 0 | 0.0% |
| 75 to 84 Years | 0 | 0.0% |
| 85 Years and Over | 0 | 0.0% |
| Total | 20 | 100.0% |
Housing Finances in Ada
Median Income by Occupancy in Ada
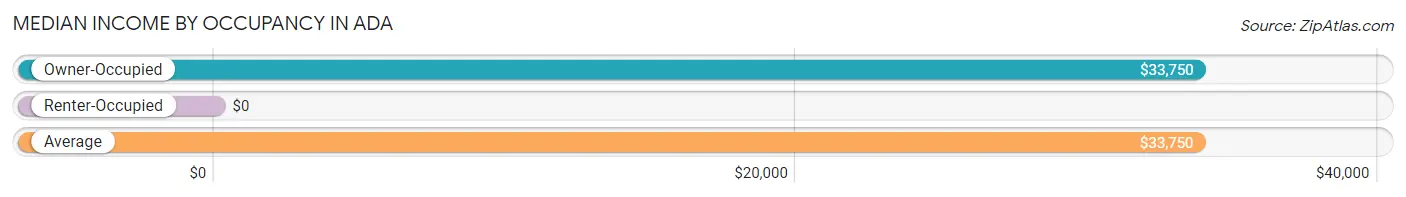
| Occupancy Type | # Households | Median Income |
| Owner-Occupied | 20 (100.0%) | $33,750 |
| Renter-Occupied | 0 (0.0%) | $0 |
| Average | 20 (100.0%) | $33,750 |
Occupancy by Householder Income Bracket in Ada
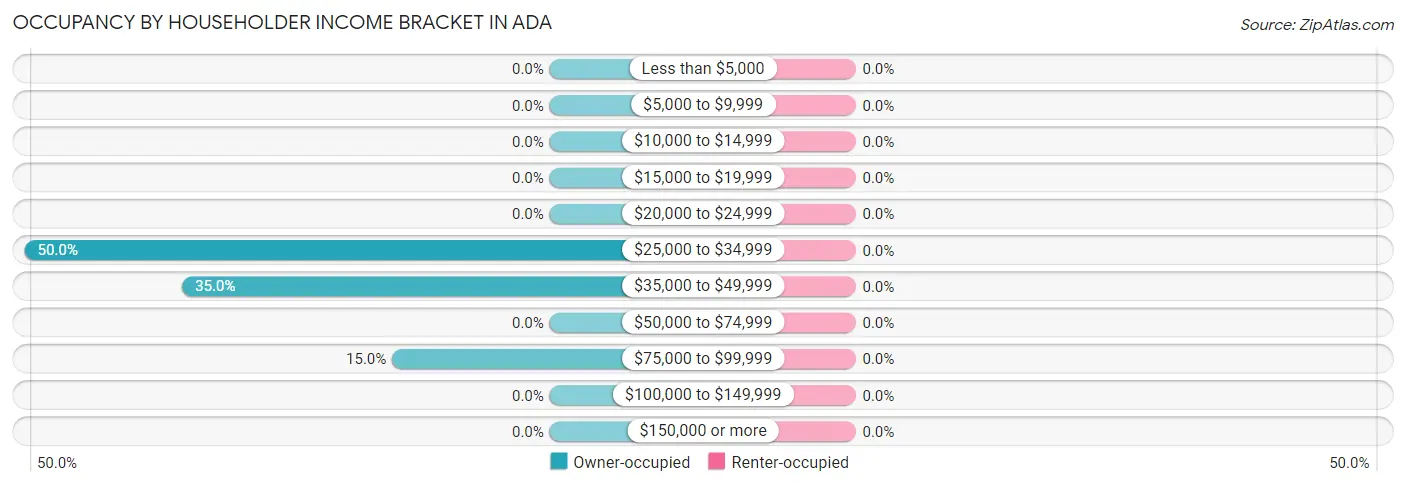
| Income Bracket | Owner-occupied | Renter-occupied |
| Less than $5,000 | 0 (0.0%) | 0 (0.0%) |
| $5,000 to $9,999 | 0 (0.0%) | 0 (0.0%) |
| $10,000 to $14,999 | 0 (0.0%) | 0 (0.0%) |
| $15,000 to $19,999 | 0 (0.0%) | 0 (0.0%) |
| $20,000 to $24,999 | 0 (0.0%) | 0 (0.0%) |
| $25,000 to $34,999 | 10 (50.0%) | 0 (0.0%) |
| $35,000 to $49,999 | 7 (35.0%) | 0 (0.0%) |
| $50,000 to $74,999 | 0 (0.0%) | 0 (0.0%) |
| $75,000 to $99,999 | 3 (15.0%) | 0 (0.0%) |
| $100,000 to $149,999 | 0 (0.0%) | 0 (0.0%) |
| $150,000 or more | 0 (0.0%) | 0 (0.0%) |
| Total | 20 (100.0%) | 0 (0.0%) |
Monthly Housing Cost Tiers in Ada
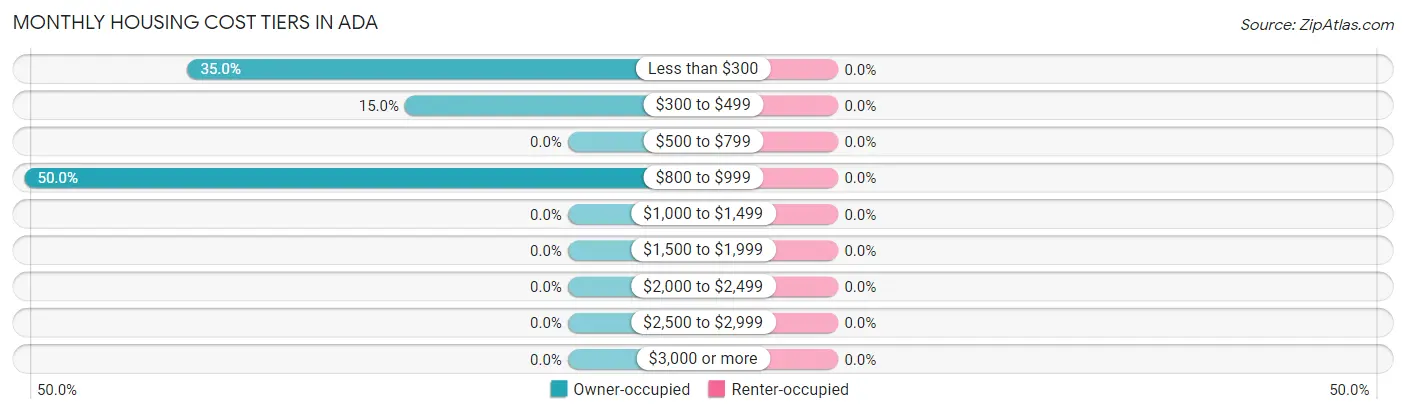
| Monthly Cost | Owner-occupied | Renter-occupied |
| Less than $300 | 7 (35.0%) | 0 (0.0%) |
| $300 to $499 | 3 (15.0%) | 0 (0.0%) |
| $500 to $799 | 0 (0.0%) | 0 (0.0%) |
| $800 to $999 | 10 (50.0%) | 0 (0.0%) |
| $1,000 to $1,499 | 0 (0.0%) | 0 (0.0%) |
| $1,500 to $1,999 | 0 (0.0%) | 0 (0.0%) |
| $2,000 to $2,499 | 0 (0.0%) | 0 (0.0%) |
| $2,500 to $2,999 | 0 (0.0%) | 0 (0.0%) |
| $3,000 or more | 0 (0.0%) | 0 (0.0%) |
| Total | 20 (100.0%) | 0 (0.0%) |
Physical Housing Characteristics in Ada
Housing Structures in Ada
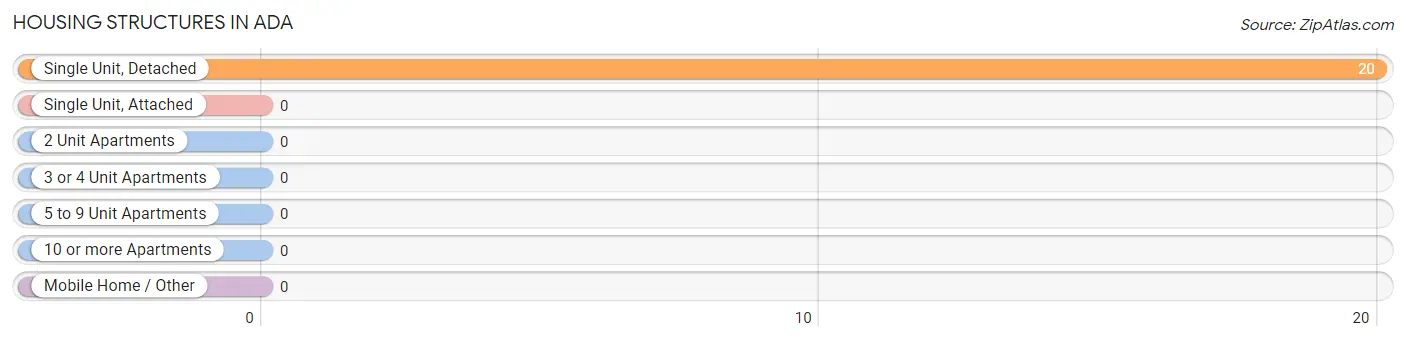
| Structure Type | # Housing Units | % Housing Units |
| Single Unit, Detached | 20 | 100.0% |
| Single Unit, Attached | 0 | 0.0% |
| 2 Unit Apartments | 0 | 0.0% |
| 3 or 4 Unit Apartments | 0 | 0.0% |
| 5 to 9 Unit Apartments | 0 | 0.0% |
| 10 or more Apartments | 0 | 0.0% |
| Mobile Home / Other | 0 | 0.0% |
| Total | 20 | 100.0% |
Housing Structures by Occupancy in Ada
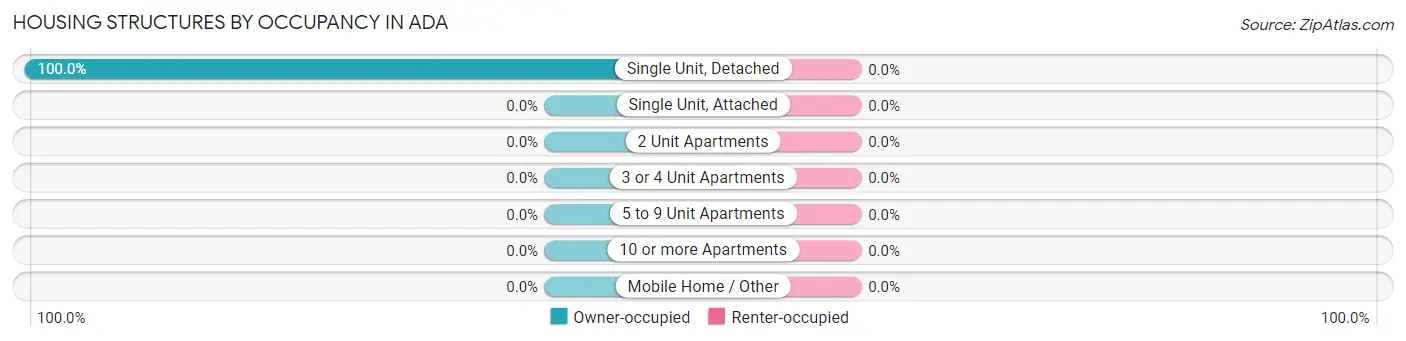
| Structure Type | Owner-occupied | Renter-occupied |
| Single Unit, Detached | 20 (100.0%) | 0 (0.0%) |
| Single Unit, Attached | 0 (0.0%) | 0 (0.0%) |
| 2 Unit Apartments | 0 (0.0%) | 0 (0.0%) |
| 3 or 4 Unit Apartments | 0 (0.0%) | 0 (0.0%) |
| 5 to 9 Unit Apartments | 0 (0.0%) | 0 (0.0%) |
| 10 or more Apartments | 0 (0.0%) | 0 (0.0%) |
| Mobile Home / Other | 0 (0.0%) | 0 (0.0%) |
| Total | 20 (100.0%) | 0 (0.0%) |
Housing Structures by Number of Rooms in Ada
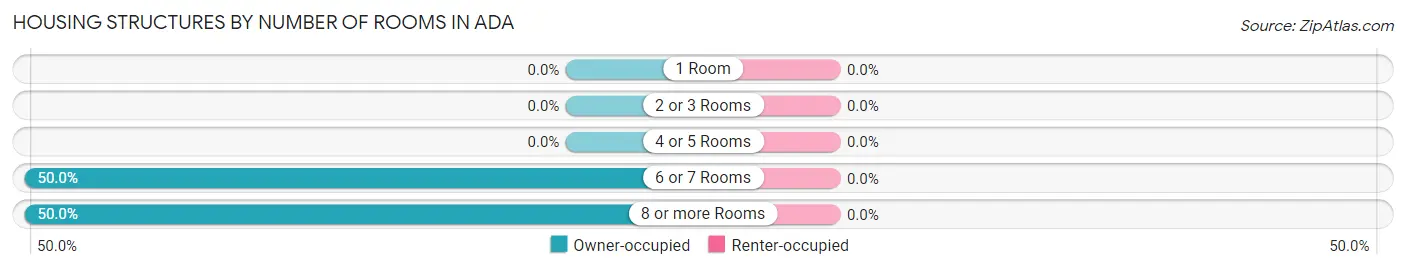
| Number of Rooms | Owner-occupied | Renter-occupied |
| 1 Room | 0 (0.0%) | 0 (0.0%) |
| 2 or 3 Rooms | 0 (0.0%) | 0 (0.0%) |
| 4 or 5 Rooms | 0 (0.0%) | 0 (0.0%) |
| 6 or 7 Rooms | 10 (50.0%) | 0 (0.0%) |
| 8 or more Rooms | 10 (50.0%) | 0 (0.0%) |
| Total | 20 (100.0%) | 0 (0.0%) |
Housing Structure by Heating Type in Ada
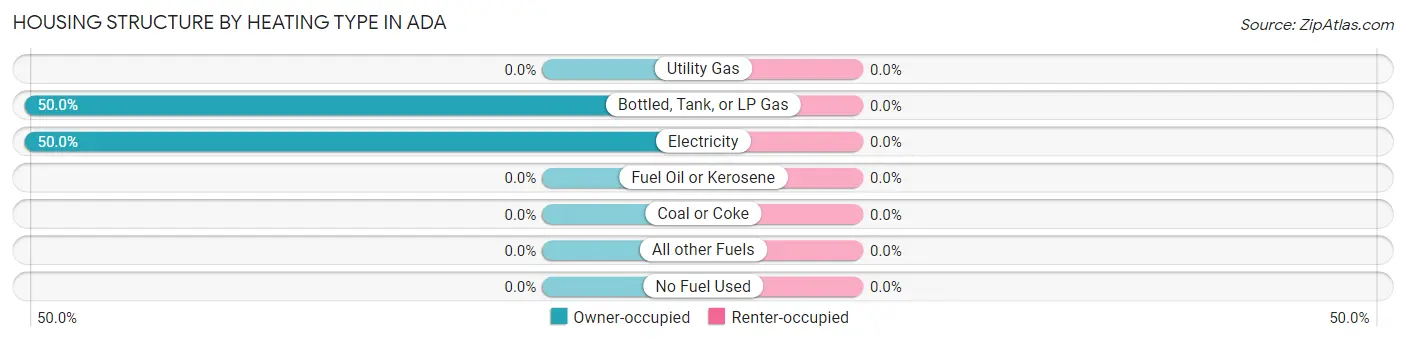
| Heating Type | Owner-occupied | Renter-occupied |
| Utility Gas | 0 (0.0%) | 0 (0.0%) |
| Bottled, Tank, or LP Gas | 10 (50.0%) | 0 (0.0%) |
| Electricity | 10 (50.0%) | 0 (0.0%) |
| Fuel Oil or Kerosene | 0 (0.0%) | 0 (0.0%) |
| Coal or Coke | 0 (0.0%) | 0 (0.0%) |
| All other Fuels | 0 (0.0%) | 0 (0.0%) |
| No Fuel Used | 0 (0.0%) | 0 (0.0%) |
| Total | 20 (100.0%) | 0 (0.0%) |
Household Vehicle Usage in Ada
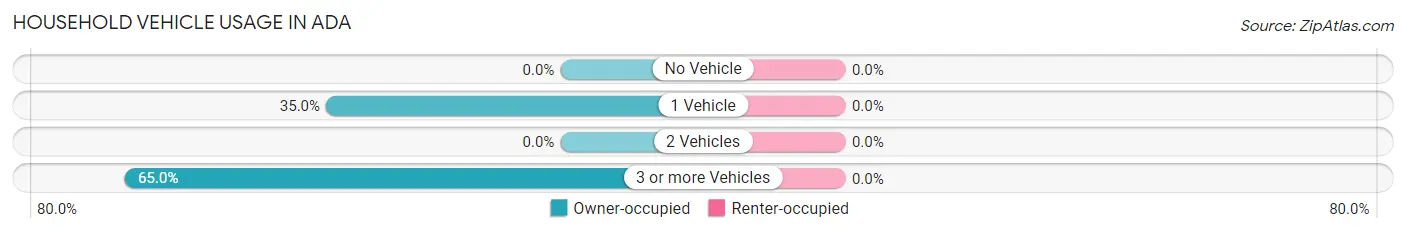
| Vehicles per Household | Owner-occupied | Renter-occupied |
| No Vehicle | 0 (0.0%) | 0 (0.0%) |
| 1 Vehicle | 7 (35.0%) | 0 (0.0%) |
| 2 Vehicles | 0 (0.0%) | 0 (0.0%) |
| 3 or more Vehicles | 13 (65.0%) | 0 (0.0%) |
| Total | 20 (100.0%) | 0 (0.0%) |
Real Estate & Mortgages in Ada
Real Estate and Mortgage Overview in Ada
| Characteristic | Without Mortgage | With Mortgage |
| Housing Units | 10 | 10 |
| Median Property Value | - | - |
| Median Household Income | - | - |
| Monthly Housing Costs | - | - |
| Real Estate Taxes | - | - |
Property Value by Mortgage Status in Ada
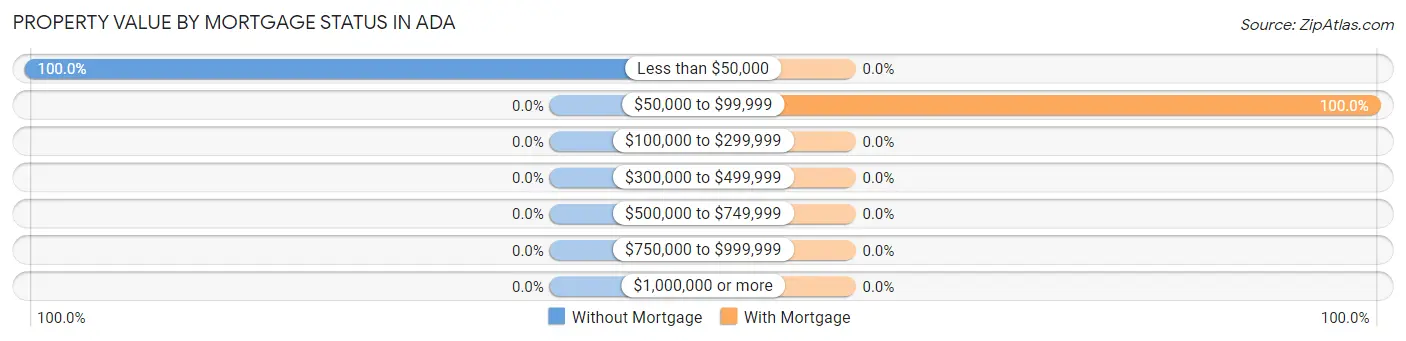
| Property Value | Without Mortgage | With Mortgage |
| Less than $50,000 | 10 (100.0%) | 0 (0.0%) |
| $50,000 to $99,999 | 0 (0.0%) | 10 (100.0%) |
| $100,000 to $299,999 | 0 (0.0%) | 0 (0.0%) |
| $300,000 to $499,999 | 0 (0.0%) | 0 (0.0%) |
| $500,000 to $749,999 | 0 (0.0%) | 0 (0.0%) |
| $750,000 to $999,999 | 0 (0.0%) | 0 (0.0%) |
| $1,000,000 or more | 0 (0.0%) | 0 (0.0%) |
| Total | 10 (100.0%) | 10 (100.0%) |
Household Income by Mortgage Status in Ada
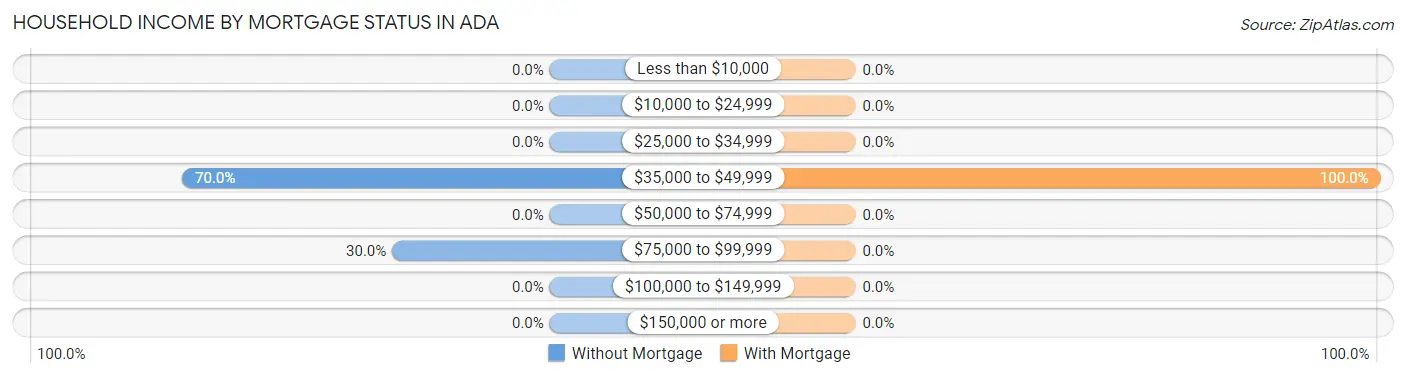
| Household Income | Without Mortgage | With Mortgage |
| Less than $10,000 | 0 (0.0%) | 0 (0.0%) |
| $10,000 to $24,999 | 0 (0.0%) | 0 (0.0%) |
| $25,000 to $34,999 | 0 (0.0%) | 0 (0.0%) |
| $35,000 to $49,999 | 7 (70.0%) | 10 (100.0%) |
| $50,000 to $74,999 | 0 (0.0%) | 0 (0.0%) |
| $75,000 to $99,999 | 3 (30.0%) | 0 (0.0%) |
| $100,000 to $149,999 | 0 (0.0%) | 0 (0.0%) |
| $150,000 or more | 0 (0.0%) | 0 (0.0%) |
| Total | 10 (100.0%) | 10 (100.0%) |
Property Value to Household Income Ratio in Ada
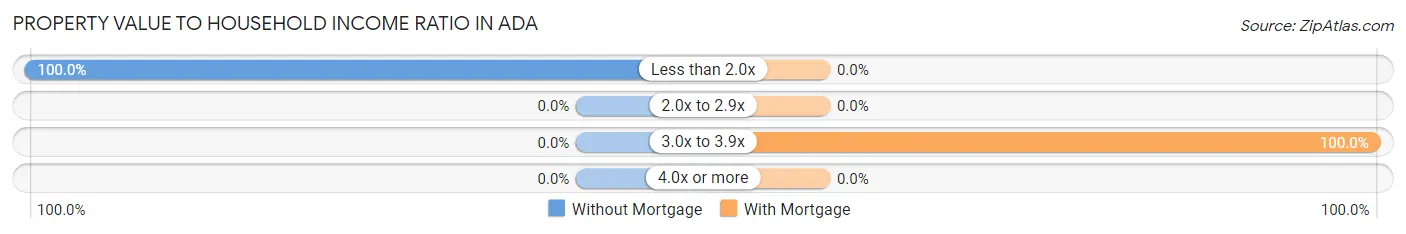
| Value-to-Income Ratio | Without Mortgage | With Mortgage |
| Less than 2.0x | 10 (100.0%) | 0 (0.0%) |
| 2.0x to 2.9x | 0 (0.0%) | 0 (0.0%) |
| 3.0x to 3.9x | 0 (0.0%) | 10 (100.0%) |
| 4.0x or more | 0 (0.0%) | 0 (0.0%) |
| Total | 10 (100.0%) | 10 (100.0%) |
Real Estate Taxes by Mortgage Status in Ada
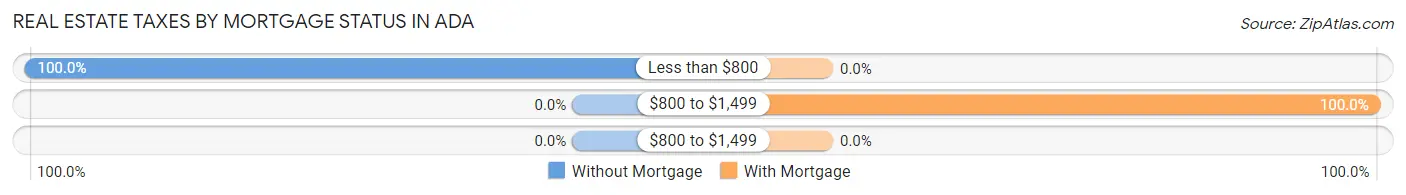
| Property Taxes | Without Mortgage | With Mortgage |
| Less than $800 | 10 (100.0%) | 0 (0.0%) |
| $800 to $1,499 | 0 (0.0%) | 10 (100.0%) |
| $800 to $1,499 | 0 (0.0%) | 0 (0.0%) |
| Total | 10 (100.0%) | 10 (100.0%) |
Health & Disability in Ada
Health Insurance Coverage by Age in Ada
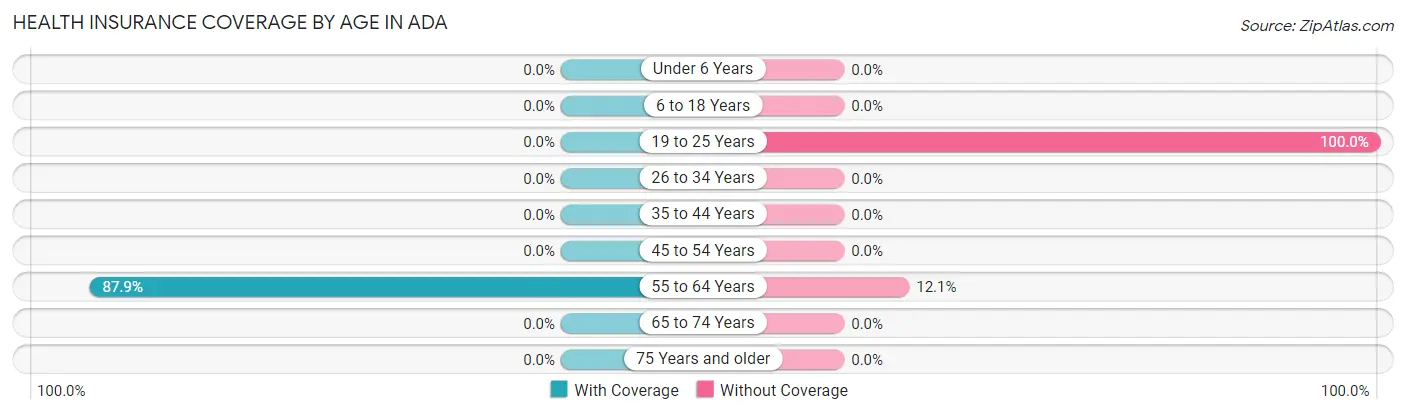
| Age Bracket | With Coverage | Without Coverage |
| Under 6 Years | 0 (0.0%) | 0 (0.0%) |
| 6 to 18 Years | 0 (0.0%) | 0 (0.0%) |
| 19 to 25 Years | 0 (0.0%) | 1 (100.0%) |
| 26 to 34 Years | 0 (0.0%) | 0 (0.0%) |
| 35 to 44 Years | 0 (0.0%) | 0 (0.0%) |
| 45 to 54 Years | 0 (0.0%) | 0 (0.0%) |
| 55 to 64 Years | 29 (87.9%) | 4 (12.1%) |
| 65 to 74 Years | 0 (0.0%) | 0 (0.0%) |
| 75 Years and older | 0 (0.0%) | 0 (0.0%) |
| Total | 29 (85.3%) | 5 (14.7%) |
Health Insurance Coverage by Citizenship Status in Ada
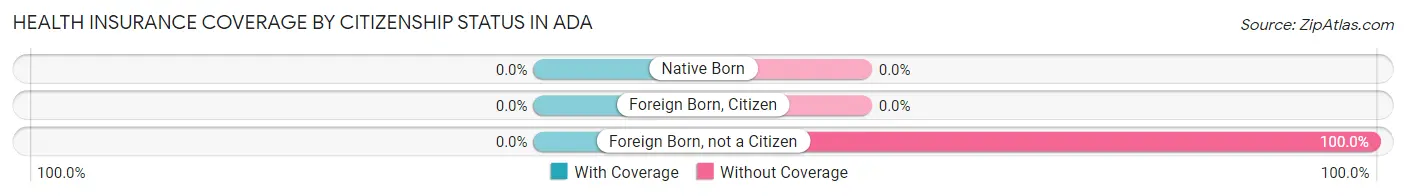
| Citizenship Status | With Coverage | Without Coverage |
| Native Born | 0 (0.0%) | 0 (0.0%) |
| Foreign Born, Citizen | 0 (0.0%) | 0 (0.0%) |
| Foreign Born, not a Citizen | 0 (0.0%) | 1 (100.0%) |
Health Insurance Coverage by Household Income in Ada
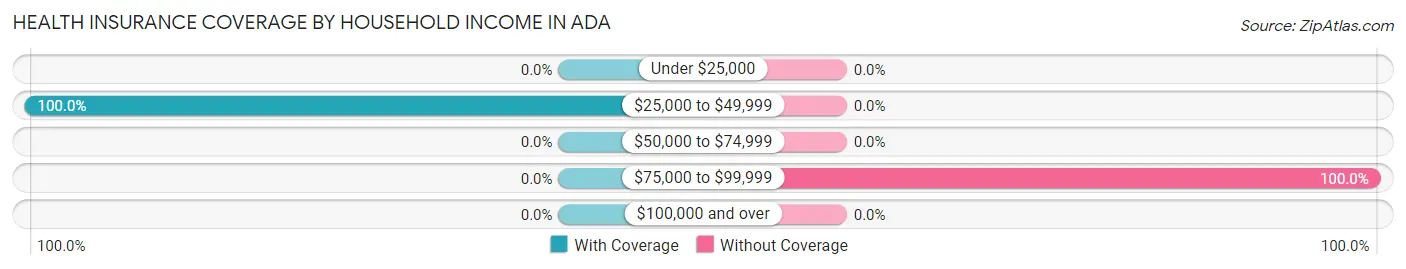
| Household Income | With Coverage | Without Coverage |
| Under $25,000 | 0 (0.0%) | 0 (0.0%) |
| $25,000 to $49,999 | 29 (100.0%) | 0 (0.0%) |
| $50,000 to $74,999 | 0 (0.0%) | 0 (0.0%) |
| $75,000 to $99,999 | 0 (0.0%) | 5 (100.0%) |
| $100,000 and over | 0 (0.0%) | 0 (0.0%) |
Public vs Private Health Insurance Coverage by Age in Ada
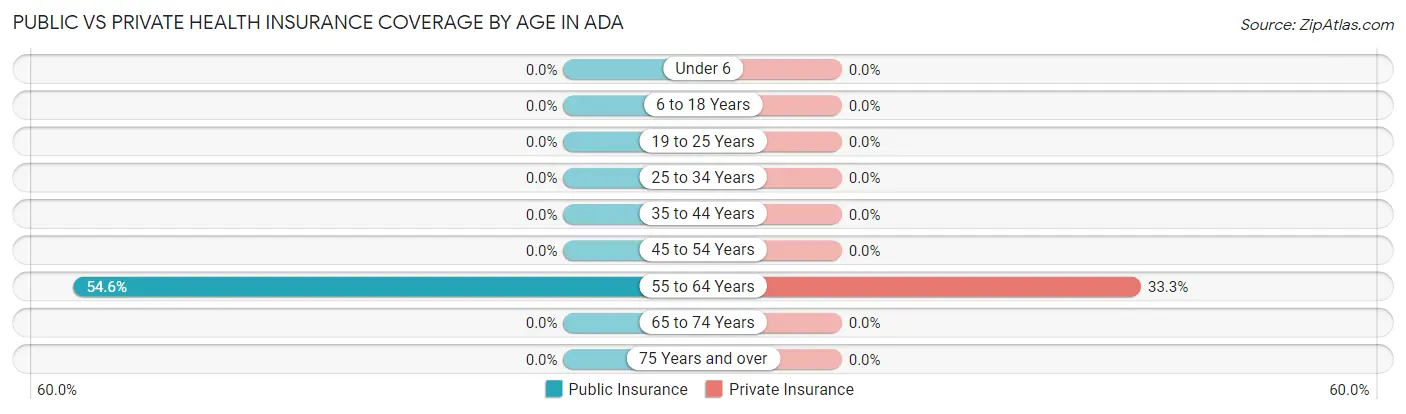
| Age Bracket | Public Insurance | Private Insurance |
| Under 6 | 0 (0.0%) | 0 (0.0%) |
| 6 to 18 Years | 0 (0.0%) | 0 (0.0%) |
| 19 to 25 Years | 0 (0.0%) | 0 (0.0%) |
| 25 to 34 Years | 0 (0.0%) | 0 (0.0%) |
| 35 to 44 Years | 0 (0.0%) | 0 (0.0%) |
| 45 to 54 Years | 0 (0.0%) | 0 (0.0%) |
| 55 to 64 Years | 18 (54.5%) | 11 (33.3%) |
| 65 to 74 Years | 0 (0.0%) | 0 (0.0%) |
| 75 Years and over | 0 (0.0%) | 0 (0.0%) |
| Total | 18 (52.9%) | 11 (32.4%) |
Disability Status by Sex by Age in Ada
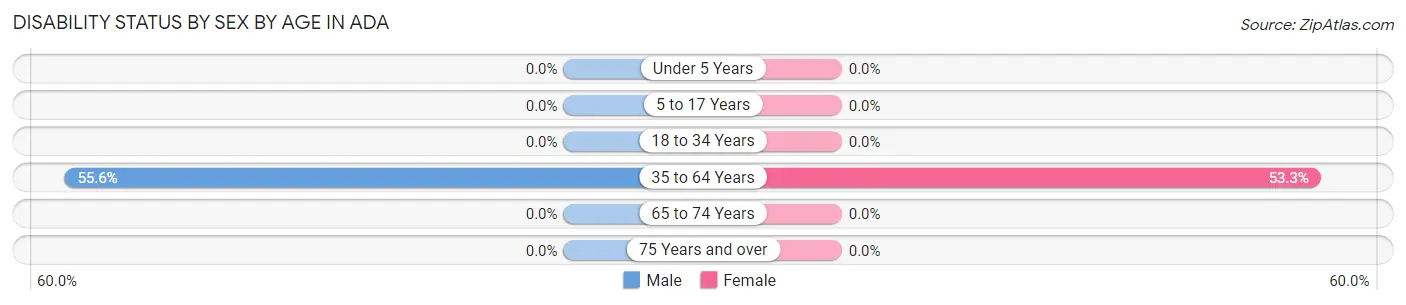
| Age Bracket | Male | Female |
| Under 5 Years | 0 (0.0%) | 0 (0.0%) |
| 5 to 17 Years | 0 (0.0%) | 0 (0.0%) |
| 18 to 34 Years | 0 (0.0%) | 0 (0.0%) |
| 35 to 64 Years | 10 (55.6%) | 8 (53.3%) |
| 65 to 74 Years | 0 (0.0%) | 0 (0.0%) |
| 75 Years and over | 0 (0.0%) | 0 (0.0%) |
Disability Class by Sex by Age in Ada
Disability Class: Hearing Difficulty
| Age Bracket | Male | Female |
| Under 5 Years | 0 (0.0%) | 0 (0.0%) |
| 5 to 17 Years | 0 (0.0%) | 0 (0.0%) |
| 18 to 34 Years | 0 (0.0%) | 0 (0.0%) |
| 35 to 64 Years | 0 (0.0%) | 0 (0.0%) |
| 65 to 74 Years | 0 (0.0%) | 0 (0.0%) |
| 75 Years and over | 0 (0.0%) | 0 (0.0%) |
Disability Class: Vision Difficulty
| Age Bracket | Male | Female |
| Under 5 Years | 0 (0.0%) | 0 (0.0%) |
| 5 to 17 Years | 0 (0.0%) | 0 (0.0%) |
| 18 to 34 Years | 0 (0.0%) | 0 (0.0%) |
| 35 to 64 Years | 0 (0.0%) | 0 (0.0%) |
| 65 to 74 Years | 0 (0.0%) | 0 (0.0%) |
| 75 Years and over | 0 (0.0%) | 0 (0.0%) |
Disability Class: Cognitive Difficulty
| Age Bracket | Male | Female |
| 5 to 17 Years | 0 (0.0%) | 0 (0.0%) |
| 18 to 34 Years | 0 (0.0%) | 0 (0.0%) |
| 35 to 64 Years | 0 (0.0%) | 0 (0.0%) |
| 65 to 74 Years | 0 (0.0%) | 0 (0.0%) |
| 75 Years and over | 0 (0.0%) | 0 (0.0%) |
Disability Class: Ambulatory Difficulty
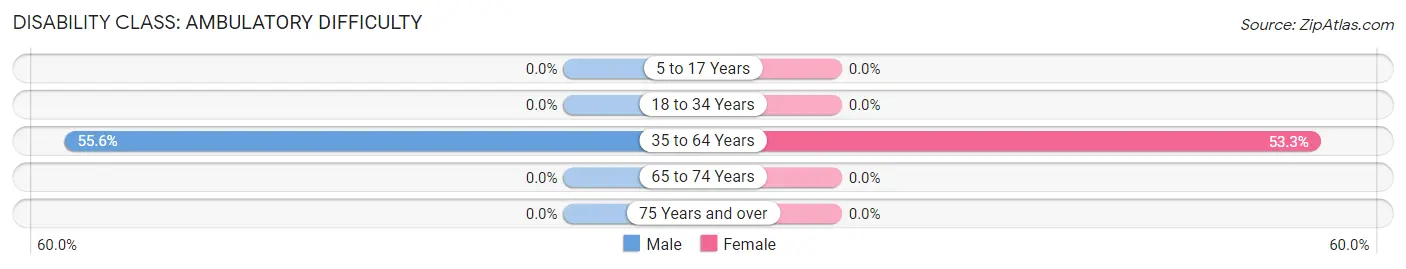
| Age Bracket | Male | Female |
| 5 to 17 Years | 0 (0.0%) | 0 (0.0%) |
| 18 to 34 Years | 0 (0.0%) | 0 (0.0%) |
| 35 to 64 Years | 10 (55.6%) | 8 (53.3%) |
| 65 to 74 Years | 0 (0.0%) | 0 (0.0%) |
| 75 Years and over | 0 (0.0%) | 0 (0.0%) |
Disability Class: Self-Care Difficulty
| Age Bracket | Male | Female |
| 5 to 17 Years | 0 (0.0%) | 0 (0.0%) |
| 18 to 34 Years | 0 (0.0%) | 0 (0.0%) |
| 35 to 64 Years | 0 (0.0%) | 0 (0.0%) |
| 65 to 74 Years | 0 (0.0%) | 0 (0.0%) |
| 75 Years and over | 0 (0.0%) | 0 (0.0%) |
Technology Access in Ada
Computing Device Access in Ada
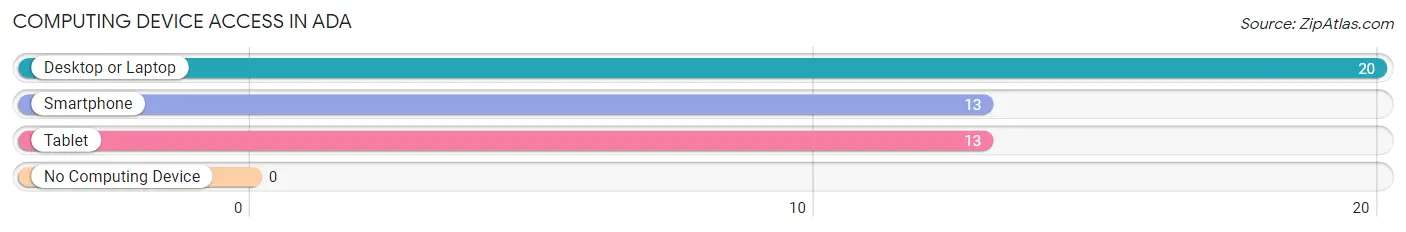
| Device Type | # Households | % Households |
| Desktop or Laptop | 20 | 100.0% |
| Smartphone | 13 | 65.0% |
| Tablet | 13 | 65.0% |
| No Computing Device | 0 | 0.0% |
| Total | 20 | 100.0% |
Internet Access in Ada
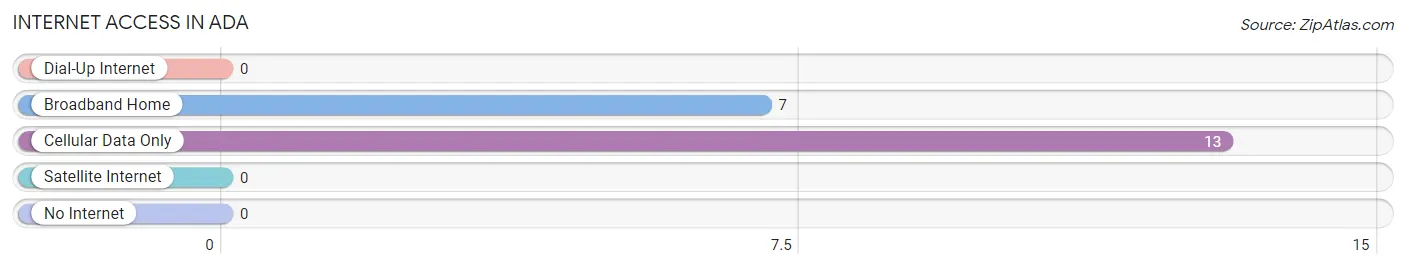
| Internet Type | # Households | % Households |
| Dial-Up Internet | 0 | 0.0% |
| Broadband Home | 7 | 35.0% |
| Cellular Data Only | 13 | 65.0% |
| Satellite Internet | 0 | 0.0% |
| No Internet | 0 | 0.0% |
| Total | 20 | 100.0% |
Ada Summary
Ada, Kansas is a small town located in the northeastern corner of the state, in the county of Clay. It is situated on the banks of the Republican River, and is surrounded by rolling hills and farmland. The town was founded in 1871, and has a population of just over 1,000 people.
Ada is a rural community, and its economy is largely based on agriculture. The town is home to several large farms, and the surrounding area is known for its production of corn, wheat, and soybeans. The town also has a few small businesses, including a grocery store, a hardware store, and a few restaurants.
The town of Ada is located in the Republican River Valley, and is part of the larger Flint Hills region. The area is known for its rolling hills and prairies, and is home to a variety of wildlife, including deer, wild turkeys, and quail. The town is also home to several parks and recreational areas, including the Ada City Park, which features a playground, picnic areas, and a walking trail.
Ada is a small town, but it has a rich history. The town was founded in 1871, and was named after Ada K. Smith, the daughter of one of the town’s founders. The town was originally a stop on the Santa Fe Trail, and was a popular destination for travelers and settlers. The town was also home to several Native American tribes, including the Pawnee, the Kaw, and the Osage.
The town of Ada has a population of just over 1,000 people, and the majority of the population is white. The median household income is around $40,000, and the median home value is around $90,000. The town has a low unemployment rate, and the majority of the population is employed in the agricultural industry.
Ada is a small town, but it has a lot to offer. The town is home to several parks and recreational areas, and the surrounding area is known for its rolling hills and prairies. The town is also home to several small businesses, and the local economy is largely based on agriculture. The town is a great place to live, and it is a great place to visit.
Common Questions
What is Per Capita Income in Ada?
Per Capita income in Ada is $19,141.
What is the Median Household income in Ada?
Median Household Income in Ada is $33,750.
What is Inequality or Gini Index in Ada?
Inequality or Gini Index in Ada is 0.17.
What is the Total Population of Ada?
Total Population of Ada is 34.
What is the Total Male Population of Ada?
Total Male Population of Ada is 18.
What is the Total Female Population of Ada?
Total Female Population of Ada is 16.
What is the Ratio of Males per 100 Females in Ada?
There are 112.50 Males per 100 Females in Ada.
What is the Ratio of Females per 100 Males in Ada?
There are 88.89 Females per 100 Males in Ada.
What is the Median Population Age in Ada?
Median Population Age in Ada is 59.4 Years.
What is the Average Family Size in Ada
Average Family Size in Ada is 1.6 People.
What is the Average Household Size in Ada
Average Household Size in Ada is 1.7 People.
How Large is the Labor Force in Ada?
There are 9 People in the Labor Forcein in Ada.
What is the Percentage of People in the Labor Force in Ada?
26.5% of People are in the Labor Force in Ada.