Tlingit-Haida vs Subsaharan African Self-Care Disability
COMPARE
Tlingit-Haida
Subsaharan African
Self-Care Disability
Self-Care Disability Comparison
Tlingit-Haida
Sub-Saharan Africans
2.4%
SELF-CARE DISABILITY
73.5/ 100
METRIC RATING
152nd/ 347
METRIC RANK
2.6%
SELF-CARE DISABILITY
4.0/ 100
METRIC RATING
220th/ 347
METRIC RANK
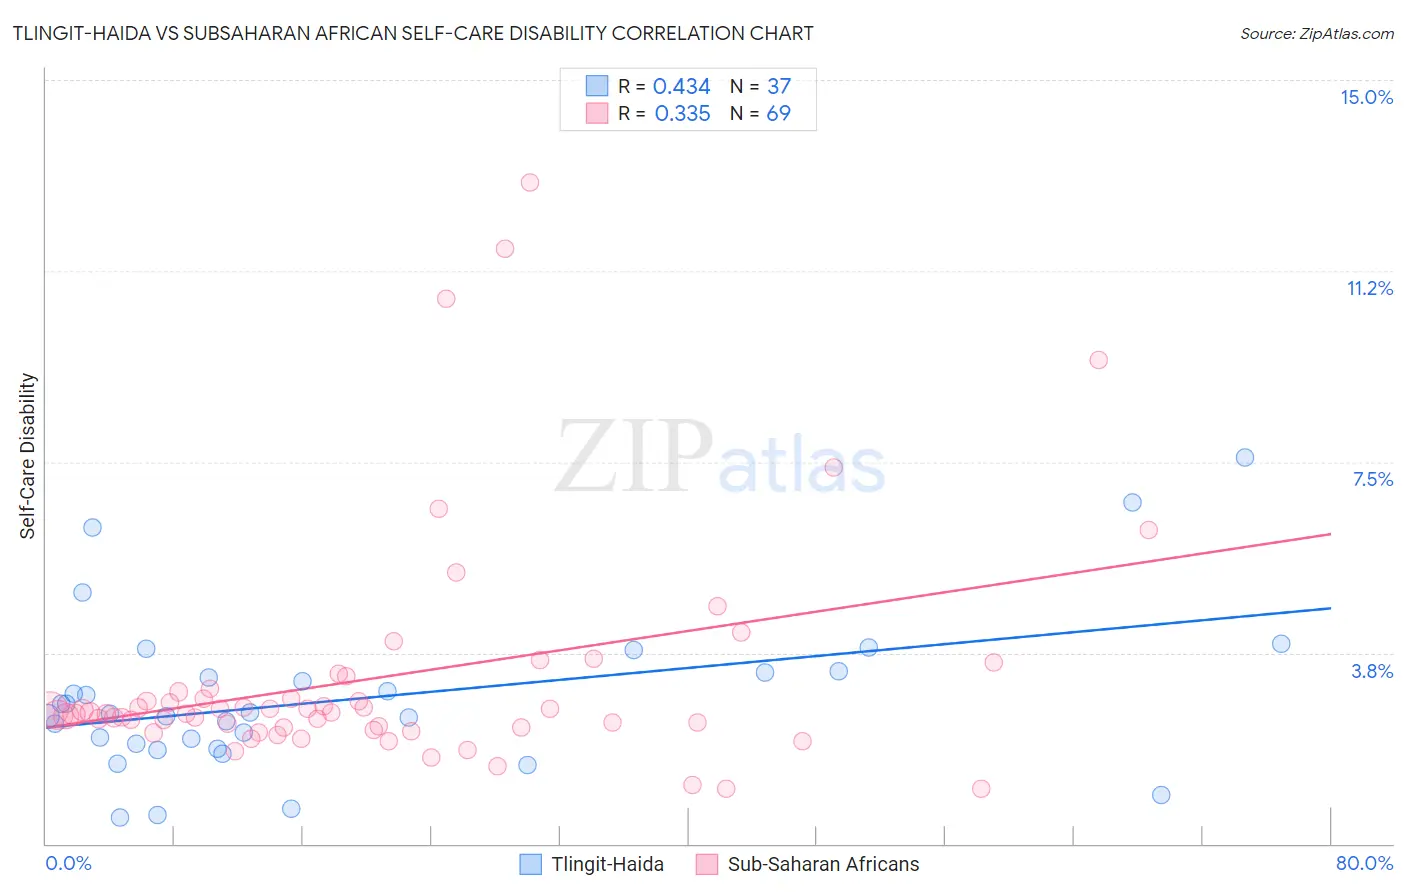
Tlingit-Haida vs Subsaharan African Self-Care Disability Correlation Chart
The statistical analysis conducted on geographies consisting of 60,819,525 people shows a moderate positive correlation between the proportion of Tlingit-Haida and percentage of population with self-care disability in the United States with a correlation coefficient (R) of 0.434 and weighted average of 2.4%. Similarly, the statistical analysis conducted on geographies consisting of 507,052,874 people shows a mild positive correlation between the proportion of Sub-Saharan Africans and percentage of population with self-care disability in the United States with a correlation coefficient (R) of 0.335 and weighted average of 2.6%, a difference of 5.1%.
Self-Care Disability Correlation Summary
| Measurement | Tlingit-Haida | Subsaharan African |
| Minimum | 0.50% | 1.1% |
| Maximum | 7.6% | 13.0% |
| Range | 7.1% | 11.9% |
| Mean | 2.8% | 3.3% |
| Median | 2.6% | 2.6% |
| Interquartile 25% (IQ1) | 1.9% | 2.3% |
| Interquartile 75% (IQ3) | 3.4% | 3.0% |
| Interquartile Range (IQR) | 1.5% | 0.74% |
| Standard Deviation (Sample) | 1.6% | 2.3% |
| Standard Deviation (Population) | 1.5% | 2.3% |
Similar Demographics by Self-Care Disability
Demographics Similar to Tlingit-Haida by Self-Care Disability
In terms of self-care disability, the demographic groups most similar to Tlingit-Haida are Immigrants from England (2.4%, a difference of 0.010%), Basque (2.4%, a difference of 0.030%), Italian (2.4%, a difference of 0.080%), Immigrants from Costa Rica (2.4%, a difference of 0.10%), and Pakistani (2.4%, a difference of 0.13%).
| Demographics | Rating | Rank | Self-Care Disability |
| Germans | 80.1 /100 | #145 | Excellent 2.4% |
| Israelis | 80.0 /100 | #146 | Good 2.4% |
| Dutch | 77.5 /100 | #147 | Good 2.4% |
| Romanians | 75.8 /100 | #148 | Good 2.4% |
| Arabs | 75.7 /100 | #149 | Good 2.4% |
| Immigrants | Costa Rica | 75.1 /100 | #150 | Good 2.4% |
| Basques | 74.0 /100 | #151 | Good 2.4% |
| Tlingit-Haida | 73.5 /100 | #152 | Good 2.4% |
| Immigrants | England | 73.5 /100 | #153 | Good 2.4% |
| Italians | 72.2 /100 | #154 | Good 2.4% |
| Pakistanis | 71.4 /100 | #155 | Good 2.4% |
| Nigerians | 70.6 /100 | #156 | Good 2.4% |
| Immigrants | Europe | 69.6 /100 | #157 | Good 2.4% |
| Immigrants | Western Europe | 68.6 /100 | #158 | Good 2.4% |
| Immigrants | Italy | 68.5 /100 | #159 | Good 2.4% |
Demographics Similar to Sub-Saharan Africans by Self-Care Disability
In terms of self-care disability, the demographic groups most similar to Sub-Saharan Africans are Immigrants from Moldova (2.6%, a difference of 0.010%), Scotch-Irish (2.6%, a difference of 0.040%), Honduran (2.6%, a difference of 0.040%), Spaniard (2.6%, a difference of 0.050%), and French Canadian (2.6%, a difference of 0.050%).
| Demographics | Rating | Rank | Self-Care Disability |
| Ecuadorians | 4.7 /100 | #213 | Tragic 2.6% |
| Immigrants | Honduras | 4.7 /100 | #214 | Tragic 2.6% |
| Immigrants | Thailand | 4.5 /100 | #215 | Tragic 2.6% |
| Whites/Caucasians | 4.4 /100 | #216 | Tragic 2.6% |
| Celtics | 4.4 /100 | #217 | Tragic 2.6% |
| Scotch-Irish | 4.1 /100 | #218 | Tragic 2.6% |
| Immigrants | Moldova | 4.0 /100 | #219 | Tragic 2.6% |
| Sub-Saharan Africans | 4.0 /100 | #220 | Tragic 2.6% |
| Hondurans | 3.8 /100 | #221 | Tragic 2.6% |
| Spaniards | 3.8 /100 | #222 | Tragic 2.6% |
| French Canadians | 3.8 /100 | #223 | Tragic 2.6% |
| Osage | 3.6 /100 | #224 | Tragic 2.6% |
| Iraqis | 3.2 /100 | #225 | Tragic 2.6% |
| Chinese | 2.9 /100 | #226 | Tragic 2.6% |
| Immigrants | Philippines | 2.7 /100 | #227 | Tragic 2.6% |