Tlingit-Haida vs Australian Self-Care Disability
COMPARE
Tlingit-Haida
Australian
Self-Care Disability
Self-Care Disability Comparison
Tlingit-Haida
Australians
2.4%
SELF-CARE DISABILITY
73.5/ 100
METRIC RATING
152nd/ 347
METRIC RANK
2.3%
SELF-CARE DISABILITY
99.6/ 100
METRIC RATING
53rd/ 347
METRIC RANK
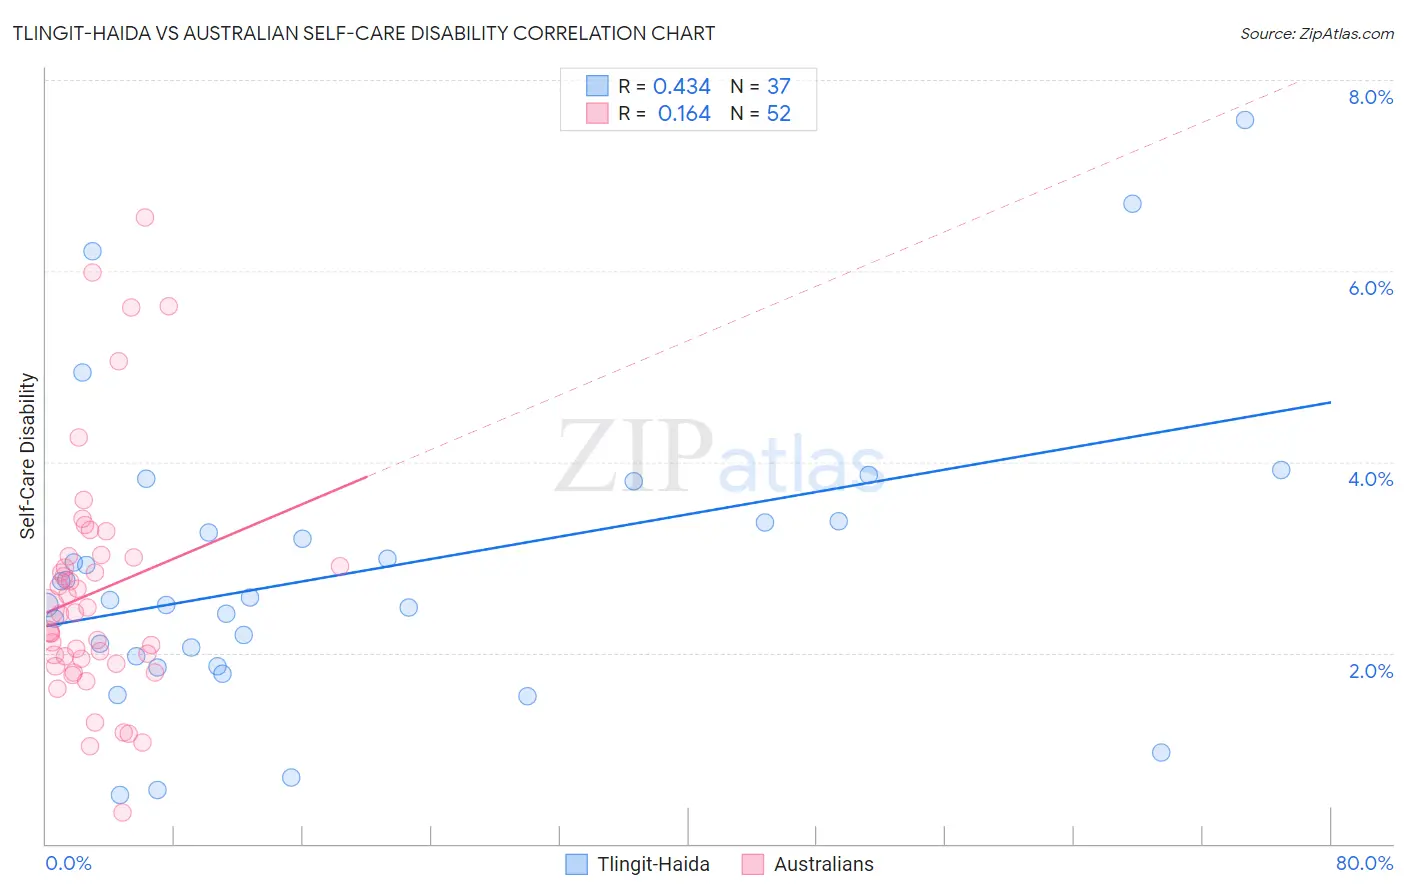
Tlingit-Haida vs Australian Self-Care Disability Correlation Chart
The statistical analysis conducted on geographies consisting of 60,819,525 people shows a moderate positive correlation between the proportion of Tlingit-Haida and percentage of population with self-care disability in the United States with a correlation coefficient (R) of 0.434 and weighted average of 2.4%. Similarly, the statistical analysis conducted on geographies consisting of 223,956,744 people shows a poor positive correlation between the proportion of Australians and percentage of population with self-care disability in the United States with a correlation coefficient (R) of 0.164 and weighted average of 2.3%, a difference of 5.9%.
Self-Care Disability Correlation Summary
| Measurement | Tlingit-Haida | Australian |
| Minimum | 0.50% | 0.32% |
| Maximum | 7.6% | 6.6% |
| Range | 7.1% | 6.2% |
| Mean | 2.8% | 2.6% |
| Median | 2.6% | 2.4% |
| Interquartile 25% (IQ1) | 1.9% | 1.9% |
| Interquartile 75% (IQ3) | 3.4% | 3.0% |
| Interquartile Range (IQR) | 1.5% | 1.1% |
| Standard Deviation (Sample) | 1.6% | 1.3% |
| Standard Deviation (Population) | 1.5% | 1.3% |
Similar Demographics by Self-Care Disability
Demographics Similar to Tlingit-Haida by Self-Care Disability
In terms of self-care disability, the demographic groups most similar to Tlingit-Haida are Immigrants from England (2.4%, a difference of 0.010%), Basque (2.4%, a difference of 0.030%), Italian (2.4%, a difference of 0.080%), Immigrants from Costa Rica (2.4%, a difference of 0.10%), and Pakistani (2.4%, a difference of 0.13%).
| Demographics | Rating | Rank | Self-Care Disability |
| Germans | 80.1 /100 | #145 | Excellent 2.4% |
| Israelis | 80.0 /100 | #146 | Good 2.4% |
| Dutch | 77.5 /100 | #147 | Good 2.4% |
| Romanians | 75.8 /100 | #148 | Good 2.4% |
| Arabs | 75.7 /100 | #149 | Good 2.4% |
| Immigrants | Costa Rica | 75.1 /100 | #150 | Good 2.4% |
| Basques | 74.0 /100 | #151 | Good 2.4% |
| Tlingit-Haida | 73.5 /100 | #152 | Good 2.4% |
| Immigrants | England | 73.5 /100 | #153 | Good 2.4% |
| Italians | 72.2 /100 | #154 | Good 2.4% |
| Pakistanis | 71.4 /100 | #155 | Good 2.4% |
| Nigerians | 70.6 /100 | #156 | Good 2.4% |
| Immigrants | Europe | 69.6 /100 | #157 | Good 2.4% |
| Immigrants | Western Europe | 68.6 /100 | #158 | Good 2.4% |
| Immigrants | Italy | 68.5 /100 | #159 | Good 2.4% |
Demographics Similar to Australians by Self-Care Disability
In terms of self-care disability, the demographic groups most similar to Australians are Immigrants from Serbia (2.3%, a difference of 0.030%), Argentinean (2.3%, a difference of 0.050%), Kenyan (2.3%, a difference of 0.060%), Immigrants from France (2.3%, a difference of 0.11%), and Immigrants from Eastern Asia (2.3%, a difference of 0.15%).
| Demographics | Rating | Rank | Self-Care Disability |
| Czechs | 99.8 /100 | #46 | Exceptional 2.3% |
| Jordanians | 99.7 /100 | #47 | Exceptional 2.3% |
| Immigrants | Malaysia | 99.7 /100 | #48 | Exceptional 2.3% |
| Latvians | 99.7 /100 | #49 | Exceptional 2.3% |
| Immigrants | Brazil | 99.7 /100 | #50 | Exceptional 2.3% |
| Kenyans | 99.7 /100 | #51 | Exceptional 2.3% |
| Immigrants | Serbia | 99.6 /100 | #52 | Exceptional 2.3% |
| Australians | 99.6 /100 | #53 | Exceptional 2.3% |
| Argentineans | 99.6 /100 | #54 | Exceptional 2.3% |
| Immigrants | France | 99.6 /100 | #55 | Exceptional 2.3% |
| Immigrants | Eastern Asia | 99.6 /100 | #56 | Exceptional 2.3% |
| Immigrants | Belgium | 99.6 /100 | #57 | Exceptional 2.3% |
| Immigrants | Cameroon | 99.6 /100 | #58 | Exceptional 2.3% |
| New Zealanders | 99.5 /100 | #59 | Exceptional 2.3% |
| Immigrants | Japan | 99.5 /100 | #60 | Exceptional 2.3% |