Portuguese Female Disability
COMPARE
Portuguese
Select to Compare
Female Disability
Portuguese Female Disability
13.0%
DISABILITY | FEMALES
0.1/ 100
METRIC RATING
274th/ 347
METRIC RANK
Portuguese Female Disability Correlation Chart
The statistical analysis conducted on geographies consisting of 450,255,075 people shows a slight positive correlation between the proportion of Portuguese and percentage of females with a disability in the United States with a correlation coefficient (R) of 0.078 and weighted average of 13.0%. On average, for every 1% (one percent) increase in Portuguese within a typical geography, there is an increase of 0.023% in percentage of females with a disability.
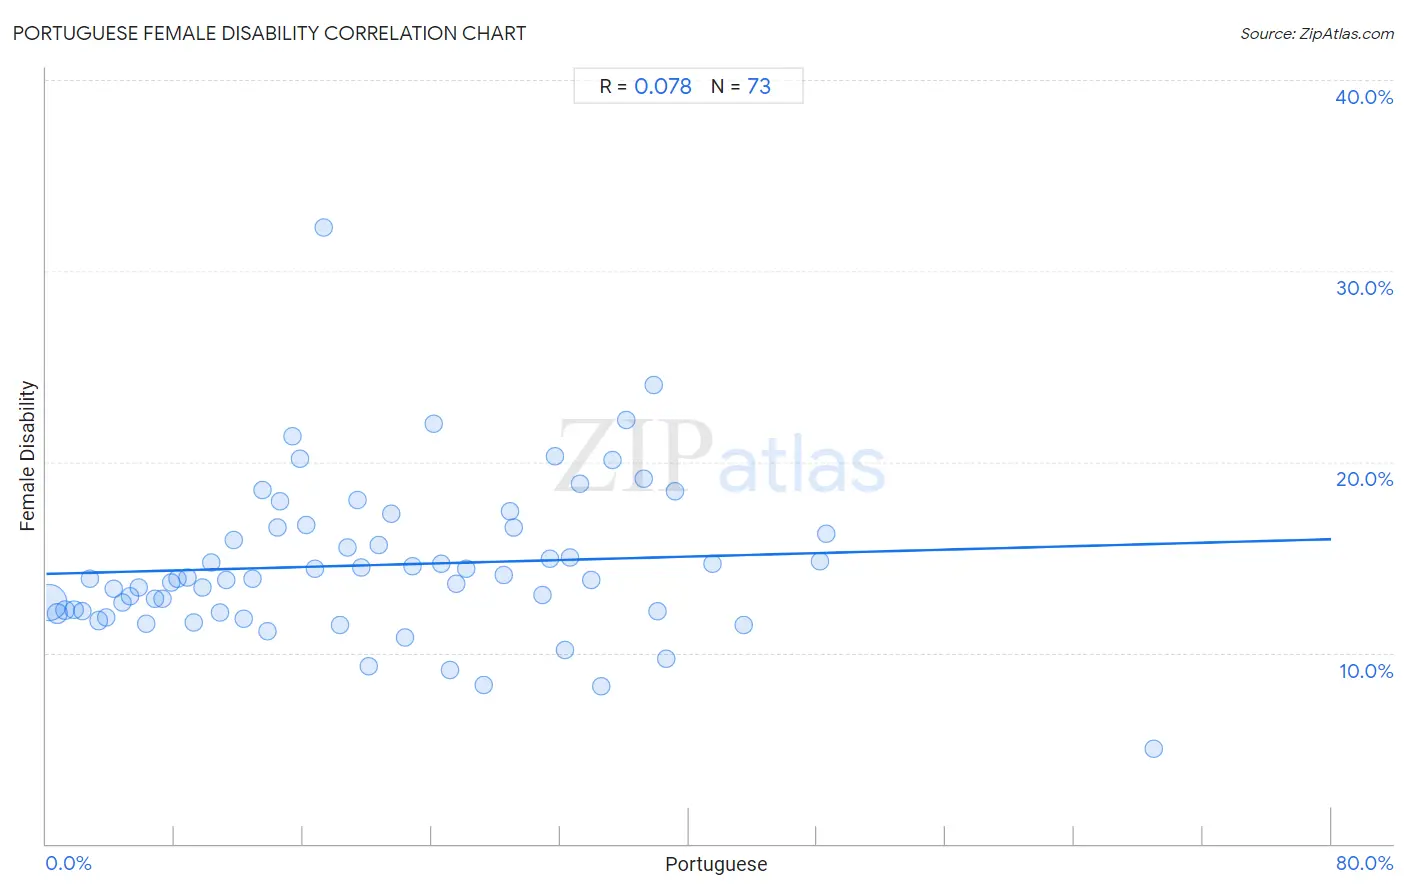
It is essential to understand that the correlation between the percentage of Portuguese and percentage of females with a disability does not imply a direct cause-and-effect relationship. It remains uncertain whether the presence of Portuguese influences an upward or downward trend in the level of percentage of females with a disability within an area, or if Portuguese simply ended up residing in those areas with higher or lower levels of percentage of females with a disability due to other factors.
Demographics Similar to Portuguese by Female Disability
In terms of female disability, the demographic groups most similar to Portuguese are Cheyenne (13.0%, a difference of 0.050%), Immigrants from Dominica (13.0%, a difference of 0.10%), Sioux (12.9%, a difference of 0.12%), German (12.9%, a difference of 0.14%), and Spanish (13.0%, a difference of 0.31%).
| Demographics | Rating | Rank | Female Disability |
| Senegalese | 0.4 /100 | #267 | Tragic 12.8% |
| Immigrants from Laos | 0.4 /100 | #268 | Tragic 12.8% |
| Indonesians | 0.4 /100 | #269 | Tragic 12.8% |
| Immigrants from Liberia | 0.3 /100 | #270 | Tragic 12.9% |
| Dutch | 0.2 /100 | #271 | Tragic 12.9% |
| Germans | 0.1 /100 | #272 | Tragic 12.9% |
| Sioux | 0.1 /100 | #273 | Tragic 12.9% |
| Portuguese | 0.1 /100 | #274 | Tragic 13.0% |
| Cheyenne | 0.1 /100 | #275 | Tragic 13.0% |
| Immigrants from Dominica | 0.1 /100 | #276 | Tragic 13.0% |
| Spanish | 0.1 /100 | #277 | Tragic 13.0% |
| Scottish | 0.1 /100 | #278 | Tragic 13.0% |
| Arapaho | 0.1 /100 | #279 | Tragic 13.0% |
| Irish | 0.1 /100 | #280 | Tragic 13.1% |
| U.S. Virgin Islanders | 0.1 /100 | #281 | Tragic 13.1% |
Portuguese Female Disability Correlation Summary
| Measurement | Portuguese Data | Female Disability Data |
| Minimum | 0.18% | 5.0% |
| Maximum | 68.9% | 32.3% |
| Range | 68.8% | 27.3% |
| Mean | 20.6% | 14.6% |
| Median | 18.7% | 13.9% |
| Interquartile 25% (IQ1) | 9.0% | 12.1% |
| Interquartile 75% (IQ3) | 31.5% | 16.6% |
| Interquartile Range (IQR) | 22.5% | 4.5% |
| Standard Deviation (Sample) | 14.0% | 4.1% |
| Standard Deviation (Population) | 13.9% | 4.1% |
Correlation Details
| Portuguese Percentile | Sample Size | Female Disability |
[ 0.0% - 0.5% ] 0.18% | 348,282,139 | 12.6% |
[ 0.5% - 1.0% ] 0.70% | 53,655,924 | 12.0% |
[ 1.0% - 1.5% ] 1.20% | 19,769,907 | 12.2% |
[ 1.5% - 2.0% ] 1.72% | 10,111,244 | 12.3% |
[ 2.0% - 2.5% ] 2.22% | 5,475,630 | 12.2% |
[ 2.5% - 3.0% ] 2.74% | 2,806,904 | 13.9% |
[ 3.0% - 3.5% ] 3.24% | 2,440,512 | 11.7% |
[ 3.5% - 4.0% ] 3.73% | 1,397,572 | 11.8% |
[ 4.0% - 4.5% ] 4.21% | 722,280 | 13.3% |
[ 4.5% - 5.0% ] 4.74% | 848,418 | 12.6% |
[ 5.0% - 5.5% ] 5.23% | 672,395 | 13.0% |
[ 5.5% - 6.0% ] 5.74% | 752,362 | 13.4% |
[ 6.0% - 6.5% ] 6.21% | 425,051 | 11.6% |
[ 6.5% - 7.0% ] 6.78% | 393,500 | 12.8% |
[ 7.0% - 7.5% ] 7.22% | 255,261 | 12.8% |
[ 7.5% - 8.0% ] 7.81% | 363,245 | 13.7% |
[ 8.0% - 8.5% ] 8.19% | 119,887 | 13.9% |
[ 8.5% - 9.0% ] 8.83% | 141,919 | 13.9% |
[ 9.0% - 9.5% ] 9.17% | 142,260 | 11.6% |
[ 9.5% - 10.0% ] 9.75% | 141,032 | 13.4% |
[ 10.0% - 10.5% ] 10.30% | 15,380 | 14.8% |
[ 10.5% - 11.0% ] 10.80% | 61,295 | 12.1% |
[ 11.0% - 11.5% ] 11.22% | 73,136 | 13.8% |
[ 11.5% - 12.0% ] 11.70% | 125,289 | 15.9% |
[ 12.0% - 12.5% ] 12.31% | 20,468 | 11.8% |
[ 12.5% - 13.0% ] 12.85% | 33,522 | 13.9% |
[ 13.0% - 13.5% ] 13.44% | 18,931 | 18.5% |
[ 13.5% - 14.0% ] 13.76% | 25,750 | 11.1% |
[ 14.0% - 14.5% ] 14.37% | 6,401 | 16.6% |
[ 14.5% - 15.0% ] 14.57% | 2,868 | 17.9% |
[ 15.0% - 15.5% ] 15.33% | 7,833 | 21.3% |
[ 15.5% - 16.0% ] 15.81% | 6,475 | 20.2% |
[ 16.0% - 16.5% ] 16.19% | 9,009 | 16.7% |
[ 16.5% - 17.0% ] 16.74% | 19,746 | 14.4% |
[ 17.0% - 17.5% ] 17.31% | 104 | 32.3% |
[ 18.0% - 18.5% ] 18.26% | 40,467 | 11.5% |
[ 18.5% - 19.0% ] 18.73% | 82,595 | 15.5% |
[ 19.0% - 19.5% ] 19.35% | 54,661 | 18.0% |
[ 19.5% - 20.0% ] 19.59% | 5,231 | 14.5% |
[ 20.0% - 20.5% ] 20.04% | 6,511 | 9.3% |
[ 20.5% - 21.0% ] 20.70% | 1,348 | 15.7% |
[ 21.0% - 21.5% ] 21.48% | 20,883 | 17.3% |
[ 22.0% - 22.5% ] 22.36% | 13,232 | 10.8% |
[ 22.5% - 23.0% ] 22.84% | 52,526 | 14.5% |
[ 24.0% - 24.5% ] 24.10% | 249 | 22.0% |
[ 24.5% - 25.0% ] 24.56% | 16,286 | 14.7% |
[ 25.0% - 25.5% ] 25.16% | 4,463 | 9.1% |
[ 25.5% - 26.0% ] 25.53% | 1,034 | 13.6% |
[ 26.0% - 26.5% ] 26.17% | 10,792 | 14.4% |
[ 27.0% - 27.5% ] 27.23% | 7,422 | 8.3% |
[ 28.0% - 28.5% ] 28.50% | 11,117 | 14.1% |
[ 28.5% - 29.0% ] 28.88% | 63,645 | 17.4% |
[ 29.0% - 29.5% ] 29.14% | 21,742 | 16.6% |
[ 30.5% - 31.0% ] 30.91% | 495 | 13.1% |
[ 31.0% - 31.5% ] 31.35% | 50,396 | 14.9% |
[ 31.5% - 32.0% ] 31.65% | 18,810 | 20.3% |
[ 32.0% - 32.5% ] 32.30% | 10,466 | 10.1% |
[ 32.5% - 33.0% ] 32.62% | 120,280 | 15.0% |
[ 33.0% - 33.5% ] 33.21% | 8,763 | 18.9% |
[ 33.5% - 34.0% ] 33.89% | 15,629 | 13.8% |
[ 34.5% - 35.0% ] 34.52% | 8,403 | 8.3% |
[ 35.0% - 35.5% ] 35.22% | 17,164 | 20.1% |
[ 36.0% - 36.5% ] 36.09% | 93,638 | 22.2% |
[ 37.0% - 37.5% ] 37.20% | 43,238 | 19.1% |
[ 37.5% - 38.0% ] 37.83% | 30,558 | 24.0% |
[ 38.0% - 38.5% ] 38.05% | 21,383 | 12.1% |
[ 38.5% - 39.0% ] 38.59% | 4,556 | 9.7% |
[ 39.0% - 39.5% ] 39.14% | 6,545 | 18.5% |
[ 41.0% - 41.5% ] 41.44% | 11,431 | 14.7% |
[ 43.0% - 43.5% ] 43.45% | 25,084 | 11.5% |
[ 48.0% - 48.5% ] 48.18% | 4,660 | 14.8% |
[ 48.5% - 49.0% ] 48.56% | 5,591 | 16.3% |
[ 68.5% - 69.0% ] 68.94% | 132 | 5.0% |