Portuguese vs Bhutanese Disability Age 5 to 17
COMPARE
Portuguese
Bhutanese
Disability Age 5 to 17
Disability Age 5 to 17 Comparison
Portuguese
Bhutanese
6.1%
DISABILITY AGE 5 TO 17
0.1/ 100
METRIC RATING
280th/ 347
METRIC RANK
4.9%
DISABILITY AGE 5 TO 17
100.0/ 100
METRIC RATING
26th/ 347
METRIC RANK
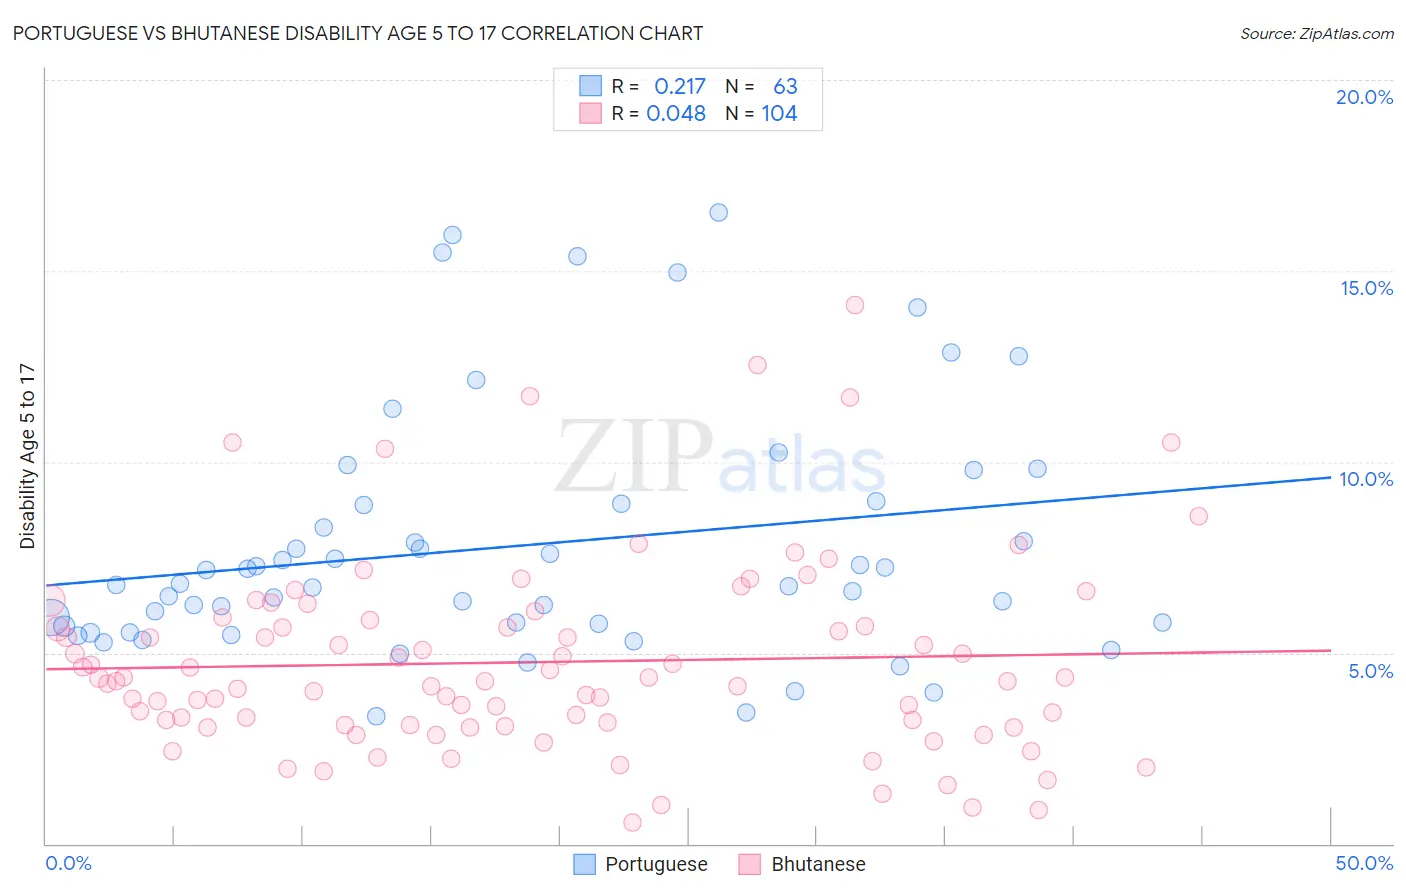
Portuguese vs Bhutanese Disability Age 5 to 17 Correlation Chart
The statistical analysis conducted on geographies consisting of 444,787,533 people shows a weak positive correlation between the proportion of Portuguese and percentage of population with a disability between the ages 5 and 17 in the United States with a correlation coefficient (R) of 0.217 and weighted average of 6.1%. Similarly, the statistical analysis conducted on geographies consisting of 450,824,521 people shows no correlation between the proportion of Bhutanese and percentage of population with a disability between the ages 5 and 17 in the United States with a correlation coefficient (R) of 0.048 and weighted average of 4.9%, a difference of 25.0%.
Disability Age 5 to 17 Correlation Summary
| Measurement | Portuguese | Bhutanese |
| Minimum | 3.3% | 0.55% |
| Maximum | 16.5% | 14.1% |
| Range | 13.2% | 13.6% |
| Mean | 7.8% | 4.8% |
| Median | 6.8% | 4.3% |
| Interquartile 25% (IQ1) | 5.7% | 3.1% |
| Interquartile 75% (IQ3) | 8.9% | 5.8% |
| Interquartile Range (IQR) | 3.2% | 2.7% |
| Standard Deviation (Sample) | 3.2% | 2.5% |
| Standard Deviation (Population) | 3.2% | 2.5% |
Similar Demographics by Disability Age 5 to 17
Demographics Similar to Portuguese by Disability Age 5 to 17
In terms of disability age 5 to 17, the demographic groups most similar to Portuguese are Immigrants from Jamaica (6.1%, a difference of 0.14%), Scottish (6.1%, a difference of 0.25%), Immigrants from Liberia (6.1%, a difference of 0.28%), Puget Sound Salish (6.1%, a difference of 0.36%), and German (6.1%, a difference of 0.50%).
| Demographics | Rating | Rank | Disability Age 5 to 17 |
| Alaska Natives | 0.2 /100 | #273 | Tragic 6.0% |
| Cheyenne | 0.2 /100 | #274 | Tragic 6.0% |
| Dutch | 0.2 /100 | #275 | Tragic 6.0% |
| Japanese | 0.1 /100 | #276 | Tragic 6.1% |
| Puget Sound Salish | 0.1 /100 | #277 | Tragic 6.1% |
| Immigrants | Liberia | 0.1 /100 | #278 | Tragic 6.1% |
| Immigrants | Jamaica | 0.1 /100 | #279 | Tragic 6.1% |
| Portuguese | 0.1 /100 | #280 | Tragic 6.1% |
| Scottish | 0.0 /100 | #281 | Tragic 6.1% |
| Germans | 0.0 /100 | #282 | Tragic 6.1% |
| Ugandans | 0.0 /100 | #283 | Tragic 6.2% |
| Sub-Saharan Africans | 0.0 /100 | #284 | Tragic 6.2% |
| English | 0.0 /100 | #285 | Tragic 6.2% |
| Colville | 0.0 /100 | #286 | Tragic 6.2% |
| Pima | 0.0 /100 | #287 | Tragic 6.2% |
Demographics Similar to Bhutanese by Disability Age 5 to 17
In terms of disability age 5 to 17, the demographic groups most similar to Bhutanese are Taiwanese (4.9%, a difference of 0.56%), Immigrants from Japan (4.9%, a difference of 0.64%), Immigrants from Asia (4.8%, a difference of 0.87%), Immigrants from Lebanon (4.8%, a difference of 0.98%), and Immigrants from Serbia (4.9%, a difference of 1.1%).
| Demographics | Rating | Rank | Disability Age 5 to 17 |
| Immigrants | Uzbekistan | 100.0 /100 | #19 | Exceptional 4.8% |
| Burmese | 100.0 /100 | #20 | Exceptional 4.8% |
| Yup'ik | 100.0 /100 | #21 | Exceptional 4.8% |
| Asians | 100.0 /100 | #22 | Exceptional 4.8% |
| Immigrants | Bolivia | 100.0 /100 | #23 | Exceptional 4.8% |
| Immigrants | Lebanon | 100.0 /100 | #24 | Exceptional 4.8% |
| Immigrants | Asia | 100.0 /100 | #25 | Exceptional 4.8% |
| Bhutanese | 100.0 /100 | #26 | Exceptional 4.9% |
| Taiwanese | 100.0 /100 | #27 | Exceptional 4.9% |
| Immigrants | Japan | 100.0 /100 | #28 | Exceptional 4.9% |
| Immigrants | Serbia | 100.0 /100 | #29 | Exceptional 4.9% |
| Immigrants | Malaysia | 100.0 /100 | #30 | Exceptional 5.0% |
| Immigrants | Pakistan | 100.0 /100 | #31 | Exceptional 5.0% |
| Soviet Union | 100.0 /100 | #32 | Exceptional 5.0% |
| Immigrants | Indonesia | 100.0 /100 | #33 | Exceptional 5.0% |