Panamanian vs Immigrants from Denmark Disability Age 5 to 17
COMPARE
Panamanian
Immigrants from Denmark
Disability Age 5 to 17
Disability Age 5 to 17 Comparison
Panamanians
Immigrants from Denmark
6.0%
DISABILITY AGE 5 TO 17
0.6/ 100
METRIC RATING
265th/ 347
METRIC RANK
5.4%
DISABILITY AGE 5 TO 17
91.4/ 100
METRIC RATING
136th/ 347
METRIC RANK
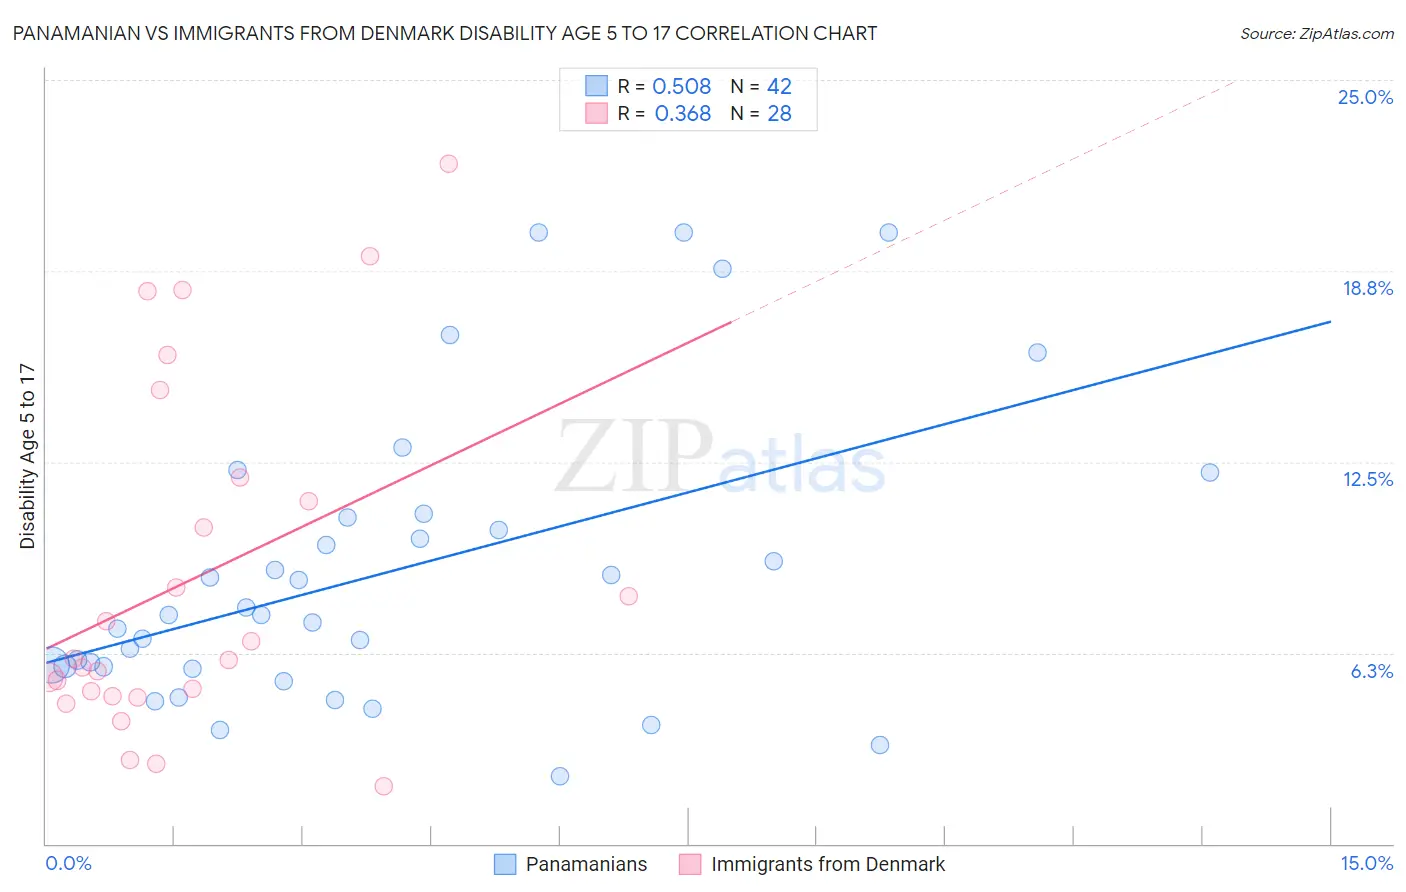
Panamanian vs Immigrants from Denmark Disability Age 5 to 17 Correlation Chart
The statistical analysis conducted on geographies consisting of 279,931,901 people shows a substantial positive correlation between the proportion of Panamanians and percentage of population with a disability between the ages 5 and 17 in the United States with a correlation coefficient (R) of 0.508 and weighted average of 6.0%. Similarly, the statistical analysis conducted on geographies consisting of 135,667,320 people shows a mild positive correlation between the proportion of Immigrants from Denmark and percentage of population with a disability between the ages 5 and 17 in the United States with a correlation coefficient (R) of 0.368 and weighted average of 5.4%, a difference of 9.6%.
Disability Age 5 to 17 Correlation Summary
| Measurement | Panamanian | Immigrants from Denmark |
| Minimum | 2.2% | 1.9% |
| Maximum | 20.0% | 22.3% |
| Range | 17.8% | 20.4% |
| Mean | 8.9% | 8.7% |
| Median | 7.5% | 6.0% |
| Interquartile 25% (IQ1) | 5.8% | 4.9% |
| Interquartile 75% (IQ3) | 10.7% | 11.6% |
| Interquartile Range (IQR) | 4.9% | 6.7% |
| Standard Deviation (Sample) | 4.8% | 5.6% |
| Standard Deviation (Population) | 4.7% | 5.5% |
Similar Demographics by Disability Age 5 to 17
Demographics Similar to Panamanians by Disability Age 5 to 17
In terms of disability age 5 to 17, the demographic groups most similar to Panamanians are Slovene (6.0%, a difference of 0.030%), Canadian (6.0%, a difference of 0.070%), Spanish (6.0%, a difference of 0.13%), Czechoslovakian (5.9%, a difference of 0.19%), and Immigrants from Western Africa (5.9%, a difference of 0.28%).
| Demographics | Rating | Rank | Disability Age 5 to 17 |
| Brazilians | 0.9 /100 | #258 | Tragic 5.9% |
| Slavs | 0.9 /100 | #259 | Tragic 5.9% |
| Somalis | 0.8 /100 | #260 | Tragic 5.9% |
| Immigrants | Middle Africa | 0.7 /100 | #261 | Tragic 5.9% |
| Immigrants | Western Africa | 0.7 /100 | #262 | Tragic 5.9% |
| Czechoslovakians | 0.7 /100 | #263 | Tragic 5.9% |
| Canadians | 0.6 /100 | #264 | Tragic 6.0% |
| Panamanians | 0.6 /100 | #265 | Tragic 6.0% |
| Slovenes | 0.6 /100 | #266 | Tragic 6.0% |
| Spanish | 0.5 /100 | #267 | Tragic 6.0% |
| Sioux | 0.4 /100 | #268 | Tragic 6.0% |
| Liberians | 0.4 /100 | #269 | Tragic 6.0% |
| Immigrants | Somalia | 0.4 /100 | #270 | Tragic 6.0% |
| Immigrants | Zaire | 0.2 /100 | #271 | Tragic 6.0% |
| Finns | 0.2 /100 | #272 | Tragic 6.0% |
Demographics Similar to Immigrants from Denmark by Disability Age 5 to 17
In terms of disability age 5 to 17, the demographic groups most similar to Immigrants from Denmark are Immigrants from Belize (5.4%, a difference of 0.050%), Navajo (5.4%, a difference of 0.080%), Immigrants from Oceania (5.4%, a difference of 0.090%), Belizean (5.4%, a difference of 0.090%), and Immigrants from Netherlands (5.4%, a difference of 0.14%).
| Demographics | Rating | Rank | Disability Age 5 to 17 |
| Romanians | 94.1 /100 | #129 | Exceptional 5.4% |
| Immigrants | Bulgaria | 94.0 /100 | #130 | Exceptional 5.4% |
| Arabs | 92.9 /100 | #131 | Exceptional 5.4% |
| Immigrants | Colombia | 92.9 /100 | #132 | Exceptional 5.4% |
| Venezuelans | 92.7 /100 | #133 | Exceptional 5.4% |
| Yuman | 92.3 /100 | #134 | Exceptional 5.4% |
| Immigrants | Belize | 91.7 /100 | #135 | Exceptional 5.4% |
| Immigrants | Denmark | 91.4 /100 | #136 | Exceptional 5.4% |
| Navajo | 90.9 /100 | #137 | Exceptional 5.4% |
| Immigrants | Oceania | 90.8 /100 | #138 | Exceptional 5.4% |
| Belizeans | 90.8 /100 | #139 | Exceptional 5.4% |
| Immigrants | Netherlands | 90.5 /100 | #140 | Exceptional 5.4% |
| South American Indians | 89.3 /100 | #141 | Excellent 5.5% |
| Colombians | 88.0 /100 | #142 | Excellent 5.5% |
| Immigrants | Hungary | 87.9 /100 | #143 | Excellent 5.5% |