Panamanian vs British Disability Age 5 to 17
COMPARE
Panamanian
British
Disability Age 5 to 17
Disability Age 5 to 17 Comparison
Panamanians
British
6.0%
DISABILITY AGE 5 TO 17
0.6/ 100
METRIC RATING
265th/ 347
METRIC RANK
5.9%
DISABILITY AGE 5 TO 17
1.7/ 100
METRIC RATING
248th/ 347
METRIC RANK
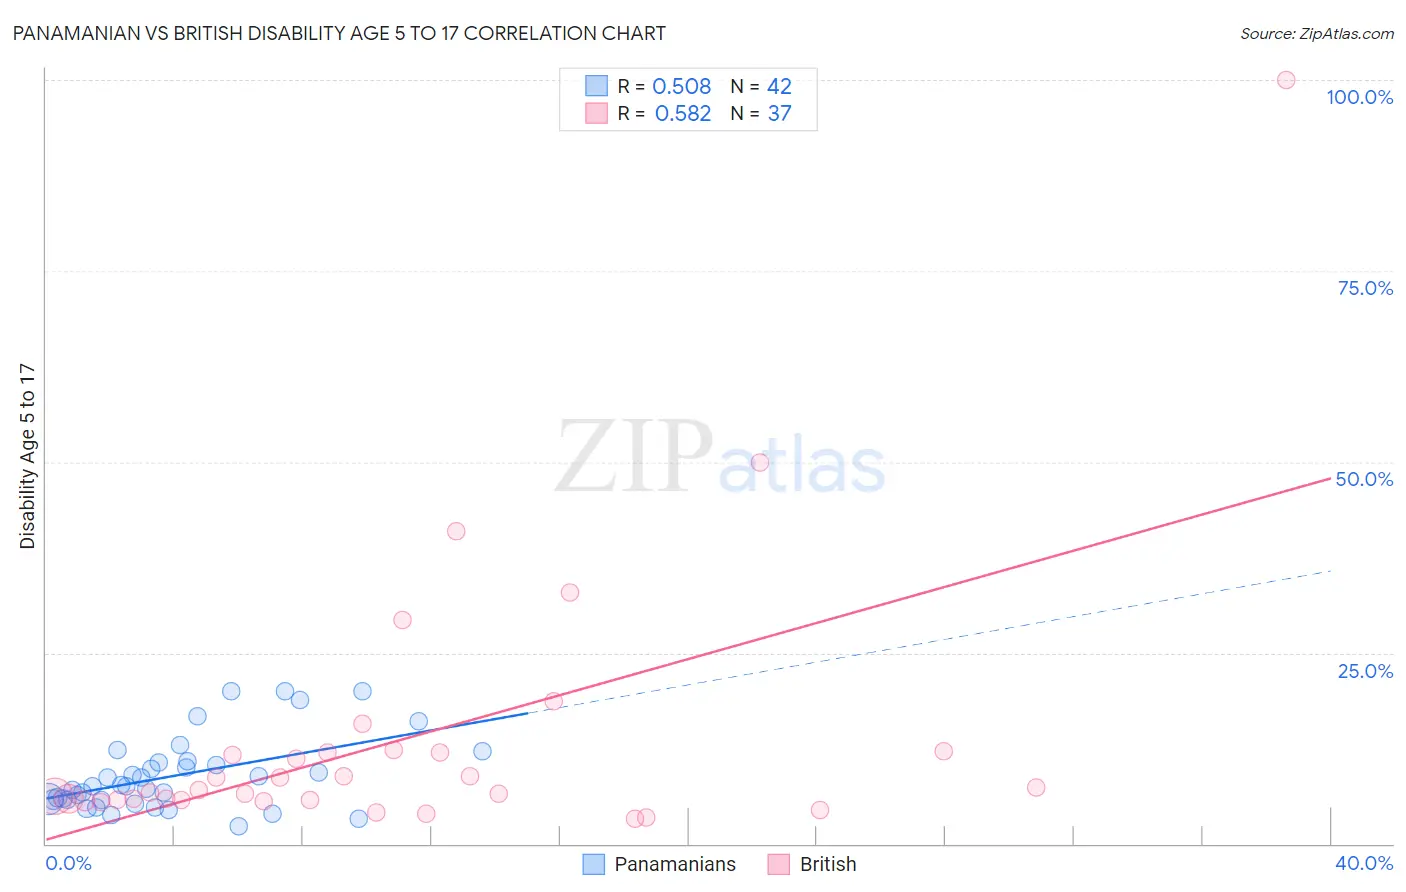
Panamanian vs British Disability Age 5 to 17 Correlation Chart
The statistical analysis conducted on geographies consisting of 279,931,901 people shows a substantial positive correlation between the proportion of Panamanians and percentage of population with a disability between the ages 5 and 17 in the United States with a correlation coefficient (R) of 0.508 and weighted average of 6.0%. Similarly, the statistical analysis conducted on geographies consisting of 522,278,318 people shows a substantial positive correlation between the proportion of British and percentage of population with a disability between the ages 5 and 17 in the United States with a correlation coefficient (R) of 0.582 and weighted average of 5.9%, a difference of 1.3%.
Disability Age 5 to 17 Correlation Summary
| Measurement | Panamanian | British |
| Minimum | 2.2% | 3.2% |
| Maximum | 20.0% | 100.0% |
| Range | 17.8% | 96.8% |
| Mean | 8.9% | 13.6% |
| Median | 7.5% | 7.0% |
| Interquartile 25% (IQ1) | 5.8% | 5.7% |
| Interquartile 75% (IQ3) | 10.7% | 12.0% |
| Interquartile Range (IQR) | 4.9% | 6.2% |
| Standard Deviation (Sample) | 4.8% | 18.0% |
| Standard Deviation (Population) | 4.7% | 17.7% |
Demographics Similar to Panamanians and British by Disability Age 5 to 17
In terms of disability age 5 to 17, the demographic groups most similar to Panamanians are Slovene (6.0%, a difference of 0.030%), Canadian (6.0%, a difference of 0.070%), Czechoslovakian (5.9%, a difference of 0.19%), Immigrants from Western Africa (5.9%, a difference of 0.28%), and Immigrants from Middle Africa (5.9%, a difference of 0.30%). Similarly, the demographic groups most similar to British are Immigrants from Ghana (5.9%, a difference of 0.010%), Immigrants from Honduras (5.9%, a difference of 0.070%), Tlingit-Haida (5.9%, a difference of 0.10%), Polish (5.9%, a difference of 0.13%), and Immigrants from Cambodia (5.9%, a difference of 0.16%).
| Demographics | Rating | Rank | Disability Age 5 to 17 |
| Tlingit-Haida | 1.9 /100 | #246 | Tragic 5.9% |
| Immigrants | Honduras | 1.8 /100 | #247 | Tragic 5.9% |
| British | 1.7 /100 | #248 | Tragic 5.9% |
| Immigrants | Ghana | 1.7 /100 | #249 | Tragic 5.9% |
| Poles | 1.5 /100 | #250 | Tragic 5.9% |
| Immigrants | Cambodia | 1.5 /100 | #251 | Tragic 5.9% |
| Hondurans | 1.5 /100 | #252 | Tragic 5.9% |
| Scandinavians | 1.4 /100 | #253 | Tragic 5.9% |
| Barbadians | 1.3 /100 | #254 | Tragic 5.9% |
| Italians | 1.2 /100 | #255 | Tragic 5.9% |
| Hopi | 1.0 /100 | #256 | Tragic 5.9% |
| Hispanics or Latinos | 1.0 /100 | #257 | Tragic 5.9% |
| Brazilians | 0.9 /100 | #258 | Tragic 5.9% |
| Slavs | 0.9 /100 | #259 | Tragic 5.9% |
| Somalis | 0.8 /100 | #260 | Tragic 5.9% |
| Immigrants | Middle Africa | 0.7 /100 | #261 | Tragic 5.9% |
| Immigrants | Western Africa | 0.7 /100 | #262 | Tragic 5.9% |
| Czechoslovakians | 0.7 /100 | #263 | Tragic 5.9% |
| Canadians | 0.6 /100 | #264 | Tragic 6.0% |
| Panamanians | 0.6 /100 | #265 | Tragic 6.0% |
| Slovenes | 0.6 /100 | #266 | Tragic 6.0% |