Panamanian vs Mongolian Disability Age 5 to 17
COMPARE
Panamanian
Mongolian
Disability Age 5 to 17
Disability Age 5 to 17 Comparison
Panamanians
Mongolians
6.0%
DISABILITY AGE 5 TO 17
0.6/ 100
METRIC RATING
265th/ 347
METRIC RANK
5.3%
DISABILITY AGE 5 TO 17
99.2/ 100
METRIC RATING
91st/ 347
METRIC RANK
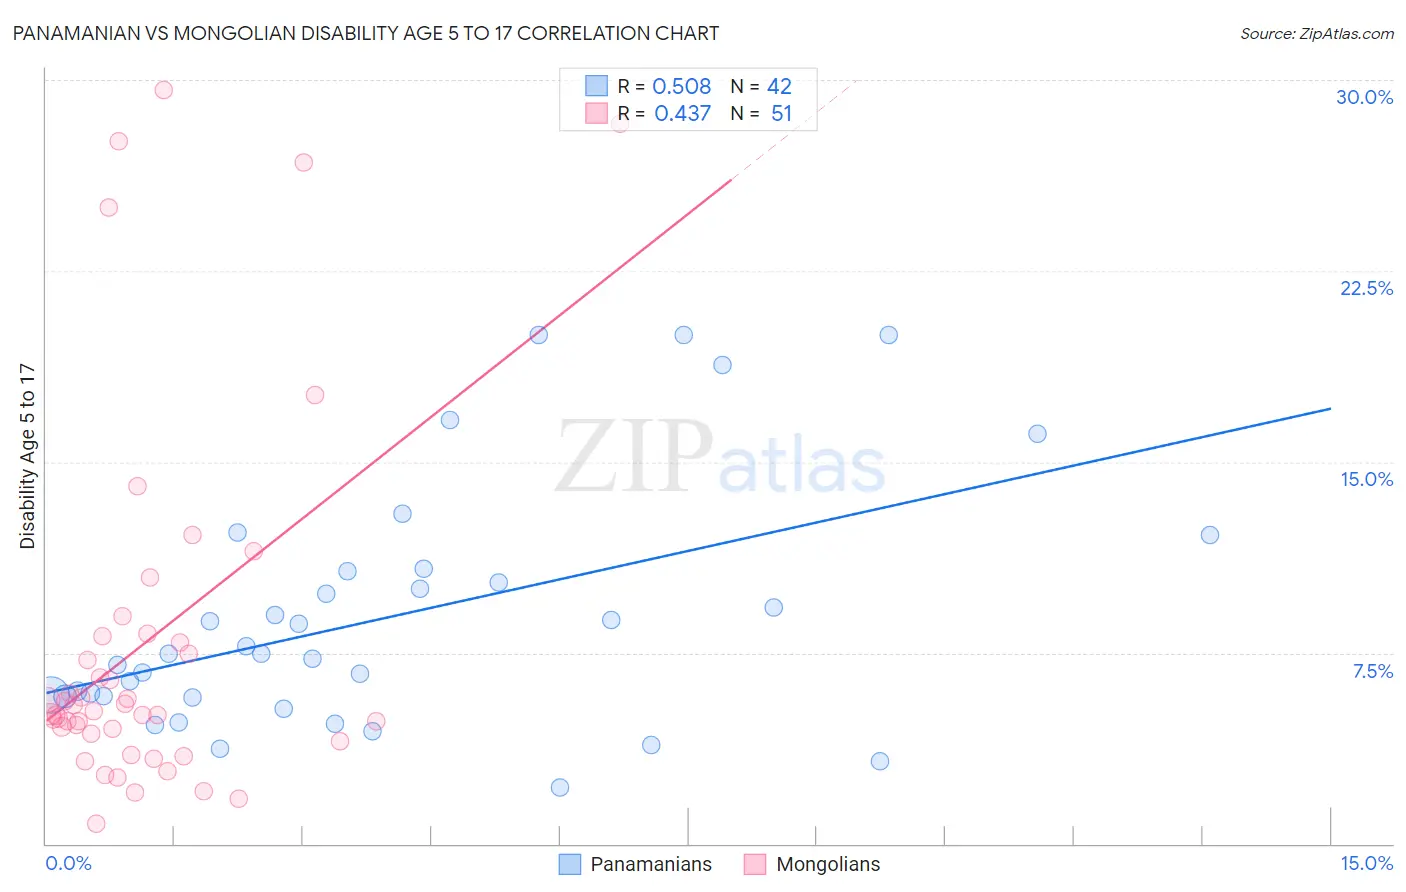
Panamanian vs Mongolian Disability Age 5 to 17 Correlation Chart
The statistical analysis conducted on geographies consisting of 279,931,901 people shows a substantial positive correlation between the proportion of Panamanians and percentage of population with a disability between the ages 5 and 17 in the United States with a correlation coefficient (R) of 0.508 and weighted average of 6.0%. Similarly, the statistical analysis conducted on geographies consisting of 139,966,367 people shows a moderate positive correlation between the proportion of Mongolians and percentage of population with a disability between the ages 5 and 17 in the United States with a correlation coefficient (R) of 0.437 and weighted average of 5.3%, a difference of 13.1%.
Disability Age 5 to 17 Correlation Summary
| Measurement | Panamanian | Mongolian |
| Minimum | 2.2% | 0.80% |
| Maximum | 20.0% | 29.6% |
| Range | 17.8% | 28.8% |
| Mean | 8.9% | 7.9% |
| Median | 7.5% | 5.2% |
| Interquartile 25% (IQ1) | 5.8% | 4.3% |
| Interquartile 75% (IQ3) | 10.7% | 8.1% |
| Interquartile Range (IQR) | 4.9% | 3.8% |
| Standard Deviation (Sample) | 4.8% | 7.2% |
| Standard Deviation (Population) | 4.7% | 7.1% |
Similar Demographics by Disability Age 5 to 17
Demographics Similar to Panamanians by Disability Age 5 to 17
In terms of disability age 5 to 17, the demographic groups most similar to Panamanians are Slovene (6.0%, a difference of 0.030%), Canadian (6.0%, a difference of 0.070%), Spanish (6.0%, a difference of 0.13%), Czechoslovakian (5.9%, a difference of 0.19%), and Immigrants from Western Africa (5.9%, a difference of 0.28%).
| Demographics | Rating | Rank | Disability Age 5 to 17 |
| Brazilians | 0.9 /100 | #258 | Tragic 5.9% |
| Slavs | 0.9 /100 | #259 | Tragic 5.9% |
| Somalis | 0.8 /100 | #260 | Tragic 5.9% |
| Immigrants | Middle Africa | 0.7 /100 | #261 | Tragic 5.9% |
| Immigrants | Western Africa | 0.7 /100 | #262 | Tragic 5.9% |
| Czechoslovakians | 0.7 /100 | #263 | Tragic 5.9% |
| Canadians | 0.6 /100 | #264 | Tragic 6.0% |
| Panamanians | 0.6 /100 | #265 | Tragic 6.0% |
| Slovenes | 0.6 /100 | #266 | Tragic 6.0% |
| Spanish | 0.5 /100 | #267 | Tragic 6.0% |
| Sioux | 0.4 /100 | #268 | Tragic 6.0% |
| Liberians | 0.4 /100 | #269 | Tragic 6.0% |
| Immigrants | Somalia | 0.4 /100 | #270 | Tragic 6.0% |
| Immigrants | Zaire | 0.2 /100 | #271 | Tragic 6.0% |
| Finns | 0.2 /100 | #272 | Tragic 6.0% |
Demographics Similar to Mongolians by Disability Age 5 to 17
In terms of disability age 5 to 17, the demographic groups most similar to Mongolians are Luxembourger (5.3%, a difference of 0.010%), Immigrants from Peru (5.3%, a difference of 0.090%), Immigrants from Jordan (5.3%, a difference of 0.16%), Immigrants from Grenada (5.3%, a difference of 0.18%), and Immigrants from Kuwait (5.3%, a difference of 0.29%).
| Demographics | Rating | Rank | Disability Age 5 to 17 |
| Immigrants | Nicaragua | 99.5 /100 | #84 | Exceptional 5.2% |
| Bulgarians | 99.4 /100 | #85 | Exceptional 5.2% |
| Immigrants | St. Vincent and the Grenadines | 99.4 /100 | #86 | Exceptional 5.2% |
| Eastern Europeans | 99.4 /100 | #87 | Exceptional 5.2% |
| Immigrants | Croatia | 99.4 /100 | #88 | Exceptional 5.2% |
| Immigrants | Spain | 99.4 /100 | #89 | Exceptional 5.2% |
| Immigrants | Kuwait | 99.4 /100 | #90 | Exceptional 5.3% |
| Mongolians | 99.2 /100 | #91 | Exceptional 5.3% |
| Luxembourgers | 99.2 /100 | #92 | Exceptional 5.3% |
| Immigrants | Peru | 99.1 /100 | #93 | Exceptional 5.3% |
| Immigrants | Jordan | 99.1 /100 | #94 | Exceptional 5.3% |
| Immigrants | Grenada | 99.1 /100 | #95 | Exceptional 5.3% |
| Immigrants | El Salvador | 99.0 /100 | #96 | Exceptional 5.3% |
| Immigrants | Europe | 99.0 /100 | #97 | Exceptional 5.3% |
| Immigrants | Austria | 98.9 /100 | #98 | Exceptional 5.3% |