Immigrants from Honduras vs Immigrants from Cameroon Disability Age 5 to 17

COMPARE

Immigrants from Honduras
Race
Ancestry
AfghanAfricanAlaska NativeAlaskan AthabascanAlbanianAleutAlsatianAmericanApacheArabArapahoArgentineanArmenianAssyrian/Chaldean/SyriacAustralianAustrianBahamianBangladeshiBarbadianBasqueBelgianBelizeanBermudanBhutaneseBlackfeetBolivianBrazilianBritishBritish West IndianBulgarianBurmeseCajunCambodianCanadianCape VerdeanCarpatho RusynCelticCentral AmericanCentral American IndianCherokeeCheyenneChickasawChileanChineseChippewaChoctawColombianColvilleComancheCosta RicanCreeCreekCroatianCrowCubanCypriotCzechCzechoslovakianDanishDelawareDominicanDutchDutch West IndianEastern EuropeanEcuadorianEgyptianEnglishEstonianEthiopianEuropeanFijianFilipinoFinnishFrenchFrench American IndianFrench CanadianGermanGerman RussianGhanaianGreekGuamanian/ChamorroGuatemalanGuyaneseHaitianHmongHonduranHopiHoumaHungarianIcelanderIndian (Asian)IndonesianInupiatIranianIraqiIrishIroquoisIsraeliItalianJamaicanJapaneseJordanianKenyanKiowaKoreanLaotianLatvianLebaneseLiberianLithuanianLumbeeLuxembourgerMacedonianMalaysianMalteseMarshalleseMenomineeMexicanMexican American IndianMongolianMoroccanNative HawaiianNavajoNepaleseNew ZealanderNicaraguanNigerianNorthern EuropeanNorwegianOkinawanOsageOttawaPaiutePakistaniPalestinianPanamanianParaguayanPennsylvania GermanPeruvianPimaPolishPortuguesePotawatomiPuebloPuerto RicanPuget Sound SalishRomanianRussianSalvadoranSamoanScandinavianScotch-IrishScottishSeminoleSenegaleseSerbianShoshoneSierra LeoneanSiouxSlavicSlovakSloveneSomaliSouth AfricanSouth AmericanSouth American IndianSoviet UnionSpaniardSpanishSpanish AmericanSpanish American IndianSri LankanSubsaharan AfricanSudaneseSwedishSwissSyrianTaiwaneseThaiTlingit-HaidaTohono O'OdhamTonganTrinidadian and TobagonianTsimshianTurkishU.S. Virgin IslanderUgandanUkrainianUruguayanUteVenezuelanVietnameseWelshWest IndianYakamaYaquiYugoslavianYumanYup'ikZimbabwean
Immigration
NonimmigrantsImmigrantsAfghanistanAfricaAlbaniaArgentinaArmeniaAsiaAustraliaAustriaBahamasBangladeshBarbadosBelarusBelgiumBelizeBoliviaBosnia and HerzegovinaBrazilBulgariaBurma/MyanmarCabo VerdeCambodiaCanadaCaribbeanCentral AmericaChileChinaColombiaCongoCosta RicaCroatiaCubaCzechoslovakiaDenmarkDominicaDominican RepublicEastern AfricaEastern AsiaEastern EuropeEcuadorEgyptEl SalvadorEnglandEritreaEthiopiaEuropeFijiFranceGermanyGhanaGreeceGrenadaGuatemalaGuyanaHaitiHondurasHong KongHungaryIndiaIndonesiaIranIraqIrelandIsraelItalyJamaicaJapanJordanKazakhstanKenyaKoreaKuwaitLaosLatin AmericaLatviaLebanonLiberiaLithuaniaMalaysiaMexicoMicronesiaMiddle AfricaMoldovaMoroccoNepalNetherlandsNicaraguaNigeriaNorth AmericaNorth MacedoniaNorthern AfricaNorthern EuropeNorwayOceaniaPakistanPanamaPeruPhilippinesPolandPortugalRomaniaRussiaSaudi ArabiaScotlandSenegalSerbiaSierra LeoneSingaporeSomaliaSouth AfricaSouth AmericaSouth Central AsiaSouth Eastern AsiaSouthern EuropeSpainSri LankaSt. Vincent and the GrenadinesSudanSwedenSwitzerlandSyriaTaiwanThailandTrinidad and TobagoTurkeyUgandaUkraineUruguayUzbekistanVenezuelaVietnamWest IndiesWestern AfricaWestern AsiaWestern EuropeYemenZaireZimbabweAzores
Immigrants from Cameroon
Race
Ancestry
AfghanAfricanAlaska NativeAlaskan AthabascanAlbanianAleutAlsatianAmericanApacheArabArapahoArgentineanArmenianAssyrian/Chaldean/SyriacAustralianAustrianBahamianBangladeshiBarbadianBasqueBelgianBelizeanBermudanBhutaneseBlackfeetBolivianBrazilianBritishBritish West IndianBulgarianBurmeseCajunCambodianCanadianCape VerdeanCarpatho RusynCelticCentral AmericanCentral American IndianCherokeeCheyenneChickasawChileanChineseChippewaChoctawColombianColvilleComancheCosta RicanCreeCreekCroatianCrowCubanCypriotCzechCzechoslovakianDanishDelawareDominicanDutchDutch West IndianEastern EuropeanEcuadorianEgyptianEnglishEstonianEthiopianEuropeanFijianFilipinoFinnishFrenchFrench American IndianFrench CanadianGermanGerman RussianGhanaianGreekGuamanian/ChamorroGuatemalanGuyaneseHaitianHmongHonduranHopiHoumaHungarianIcelanderIndian (Asian)IndonesianInupiatIranianIraqiIrishIroquoisIsraeliItalianJamaicanJapaneseJordanianKenyanKiowaKoreanLaotianLatvianLebaneseLiberianLithuanianLumbeeLuxembourgerMacedonianMalaysianMalteseMarshalleseMenomineeMexicanMexican American IndianMongolianMoroccanNative HawaiianNavajoNepaleseNew ZealanderNicaraguanNigerianNorthern EuropeanNorwegianOkinawanOsageOttawaPaiutePakistaniPalestinianPanamanianParaguayanPennsylvania GermanPeruvianPimaPolishPortuguesePotawatomiPuebloPuerto RicanPuget Sound SalishRomanianRussianSalvadoranSamoanScandinavianScotch-IrishScottishSeminoleSenegaleseSerbianShoshoneSierra LeoneanSiouxSlavicSlovakSloveneSomaliSouth AfricanSouth AmericanSouth American IndianSoviet UnionSpaniardSpanishSpanish AmericanSpanish American IndianSri LankanSubsaharan AfricanSudaneseSwedishSwissSyrianTaiwaneseThaiTlingit-HaidaTohono O'OdhamTonganTrinidadian and TobagonianTsimshianTurkishU.S. Virgin IslanderUgandanUkrainianUruguayanUteVenezuelanVietnameseWelshWest IndianYakamaYaquiYugoslavianYumanYup'ikZimbabwean
Immigration
NonimmigrantsImmigrantsAfghanistanAfricaAlbaniaArgentinaArmeniaAsiaAustraliaAustriaBahamasBangladeshBarbadosBelarusBelgiumBelizeBoliviaBosnia and HerzegovinaBrazilBulgariaBurma/MyanmarCabo VerdeCambodiaCameroonCanadaCaribbeanCentral AmericaChileChinaColombiaCongoCosta RicaCroatiaCubaCzechoslovakiaDenmarkDominicaDominican RepublicEastern AfricaEastern AsiaEastern EuropeEcuadorEgyptEl SalvadorEnglandEritreaEthiopiaEuropeFijiFranceGermanyGhanaGreeceGrenadaGuatemalaGuyanaHaitiHong KongHungaryIndiaIndonesiaIranIraqIrelandIsraelItalyJamaicaJapanJordanKazakhstanKenyaKoreaKuwaitLaosLatin AmericaLatviaLebanonLiberiaLithuaniaMalaysiaMexicoMicronesiaMiddle AfricaMoldovaMoroccoNepalNetherlandsNicaraguaNigeriaNorth AmericaNorth MacedoniaNorthern AfricaNorthern EuropeNorwayOceaniaPakistanPanamaPeruPhilippinesPolandPortugalRomaniaRussiaSaudi ArabiaScotlandSenegalSerbiaSierra LeoneSingaporeSomaliaSouth AfricaSouth AmericaSouth Central AsiaSouth Eastern AsiaSouthern EuropeSpainSri LankaSt. Vincent and the GrenadinesSudanSwedenSwitzerlandSyriaTaiwanThailandTrinidad and TobagoTurkeyUgandaUkraineUruguayUzbekistanVenezuelaVietnamWest IndiesWestern AfricaWestern AsiaWestern EuropeYemenZaireZimbabweAzores
Disability Age 5 to 17
Income
Poverty
Unemployment
Labor Participation
Family Structure
Vehicle Availability
Education Level
Disability

Disability Age 5 to 17 Comparison

Immigrants from Honduras

Immigrants from Cameroon

Tragic
Tragic
5.9%
DISABILITY AGE 5 TO 17
1.8/ 100
METRIC RATING
247th/ 347
METRIC RANK
5.8%
DISABILITY AGE 5 TO 17
8.3/ 100
METRIC RATING
213th/ 347
METRIC RANK

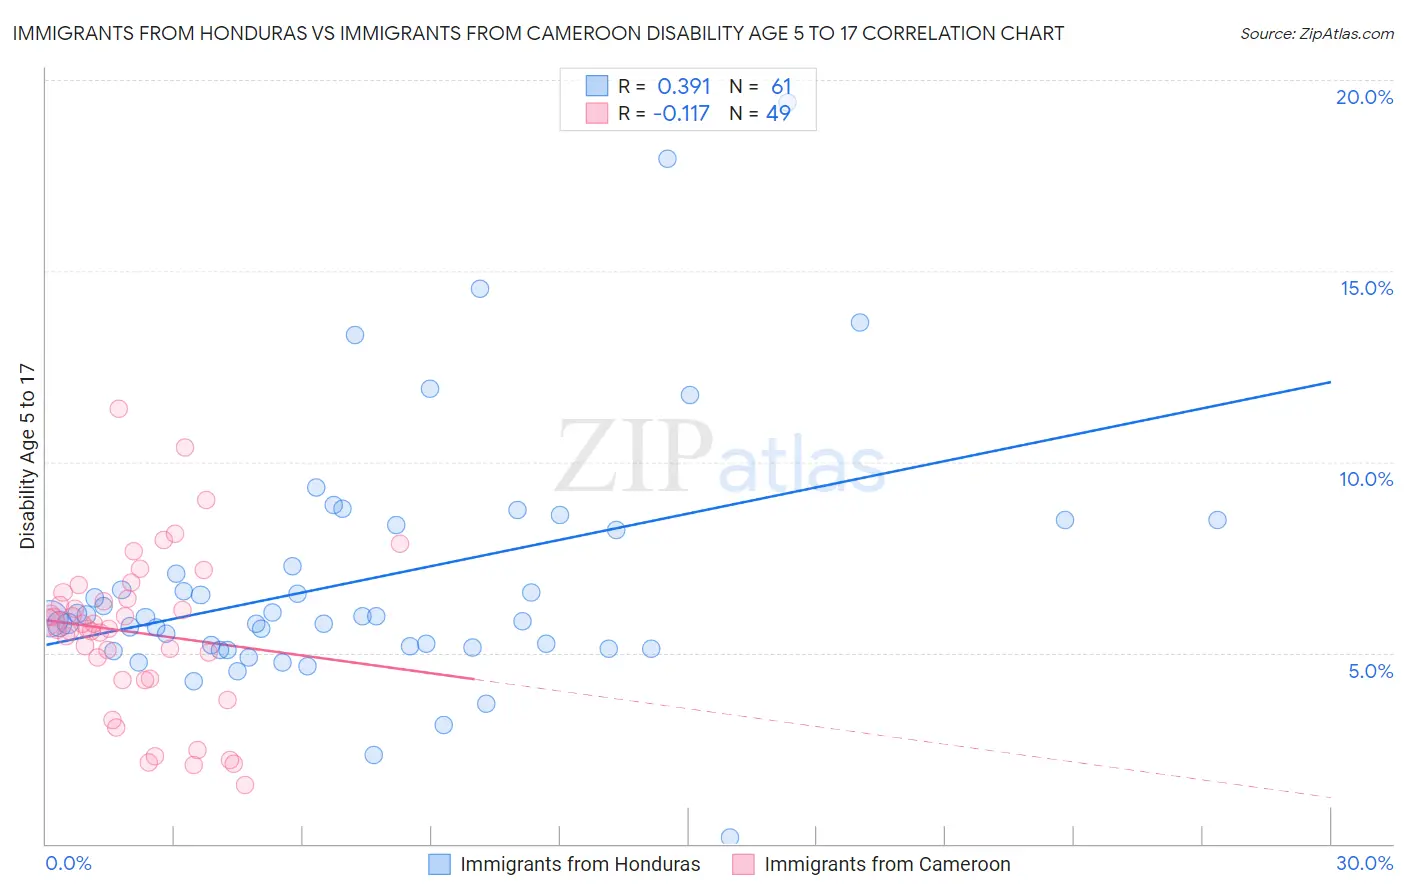
Immigrants from Honduras vs Immigrants from Cameroon Disability Age 5 to 17 Correlation Chart

The statistical analysis conducted on geographies consisting of 321,075,572 people shows a mild positive correlation between the proportion of Immigrants from Honduras and percentage of population with a disability between the ages 5 and 17 in the United States with a correlation coefficient (R) of 0.391 and weighted average of 5.9%. Similarly, the statistical analysis conducted on geographies consisting of 130,401,709 people shows a poor negative correlation between the proportion of Immigrants from Cameroon and percentage of population with a disability between the ages 5 and 17 in the United States with a correlation coefficient (R) of -0.117 and weighted average of 5.8%, a difference of 1.9%.
Immigrants from Honduras vs Immigrants from Cameroon Disability Age 5 to 17

Disability Age 5 to 17 Correlation Summary

MeasurementImmigrants from HondurasImmigrants from Cameroon
Minimum0.17%1.5%
Maximum19.4%11.4%
Range19.3%9.9%
Mean6.9%5.5%
Median5.9%5.6%
Interquartile 25% (IQ1)5.1%4.3%
Interquartile 75% (IQ3)8.3%6.5%
Interquartile Range (IQR)3.2%2.2%
Standard Deviation (Sample)3.4%2.1%
Standard Deviation (Population)3.3%2.1%

Similar Demographics by Disability Age 5 to 17

Demographics Similar to Immigrants from Honduras by Disability Age 5 to 17

In terms of disability age 5 to 17, the demographic groups most similar to Immigrants from Honduras are Immigrants from Germany (5.9%, a difference of 0.030%), Immigrants from Micronesia (5.9%, a difference of 0.030%), Tlingit-Haida (5.9%, a difference of 0.030%), British (5.9%, a difference of 0.070%), and Indonesian (5.9%, a difference of 0.090%).
DemographicsRating | RankDisability Age 5 to 17
West Indians
2.4
/100
|
#240
Tragic
5.9%
Immigrants | Caribbean
2.1
/100
|
#241
Tragic
5.9%
Spaniards
2.0
/100
|
#242
Tragic
5.9%
Indonesians
2.0
/100
|
#243
Tragic
5.9%
Immigrants | Germany
1.9
/100
|
#244
Tragic
5.9%
Immigrants | Micronesia
1.9
/100
|
#245
Tragic
5.9%
Tlingit-Haida
1.9
/100
|
#246
Tragic
5.9%
Immigrants | Honduras
1.8
/100
|
#247
Tragic
5.9%
British
1.7
/100
|
#248
Tragic
5.9%
Immigrants | Ghana
1.7
/100
|
#249
Tragic
5.9%
Poles
1.5
/100
|
#250
Tragic
5.9%
Immigrants | Cambodia
1.5
/100
|
#251
Tragic
5.9%
Hondurans
1.5
/100
|
#252
Tragic
5.9%
Scandinavians
1.4
/100
|
#253
Tragic
5.9%
Barbadians
1.3
/100
|
#254
Tragic
5.9%

Demographics Similar to Immigrants from Cameroon by Disability Age 5 to 17

In terms of disability age 5 to 17, the demographic groups most similar to Immigrants from Cameroon are Immigrants from Morocco (5.8%, a difference of 0.0%), Swedish (5.8%, a difference of 0.040%), Immigrants from Panama (5.8%, a difference of 0.050%), Yugoslavian (5.8%, a difference of 0.12%), and Nigerian (5.8%, a difference of 0.13%).
DemographicsRating | RankDisability Age 5 to 17
Immigrants | Africa
10.8
/100
|
#206
Poor
5.7%
Moroccans
10.4
/100
|
#207
Poor
5.7%
Kenyans
10.0
/100
|
#208
Poor
5.8%
Immigrants | Uganda
9.7
/100
|
#209
Tragic
5.8%
Immigrants | Haiti
9.5
/100
|
#210
Tragic
5.8%
Yugoslavians
9.1
/100
|
#211
Tragic
5.8%
Immigrants | Panama
8.7
/100
|
#212
Tragic
5.8%
Immigrants | Cameroon
8.3
/100
|
#213
Tragic
5.8%
Immigrants | Morocco
8.3
/100
|
#214
Tragic
5.8%
Swedes
8.1
/100
|
#215
Tragic
5.8%
Nigerians
7.5
/100
|
#216
Tragic
5.8%
Czechs
7.4
/100
|
#217
Tragic
5.8%
Immigrants | Sierra Leone
7.1
/100
|
#218
Tragic
5.8%
Sierra Leoneans
7.0
/100
|
#219
Tragic
5.8%
Belgians
6.9
/100
|
#220
Tragic
5.8%