Immigrants from Honduras vs Aleut Disability Age 5 to 17
COMPARE
Immigrants from Honduras
Aleut
Disability Age 5 to 17
Disability Age 5 to 17 Comparison
Immigrants from Honduras
Aleuts
5.9%
DISABILITY AGE 5 TO 17
1.8/ 100
METRIC RATING
247th/ 347
METRIC RANK
5.3%
DISABILITY AGE 5 TO 17
97.8/ 100
METRIC RATING
113th/ 347
METRIC RANK
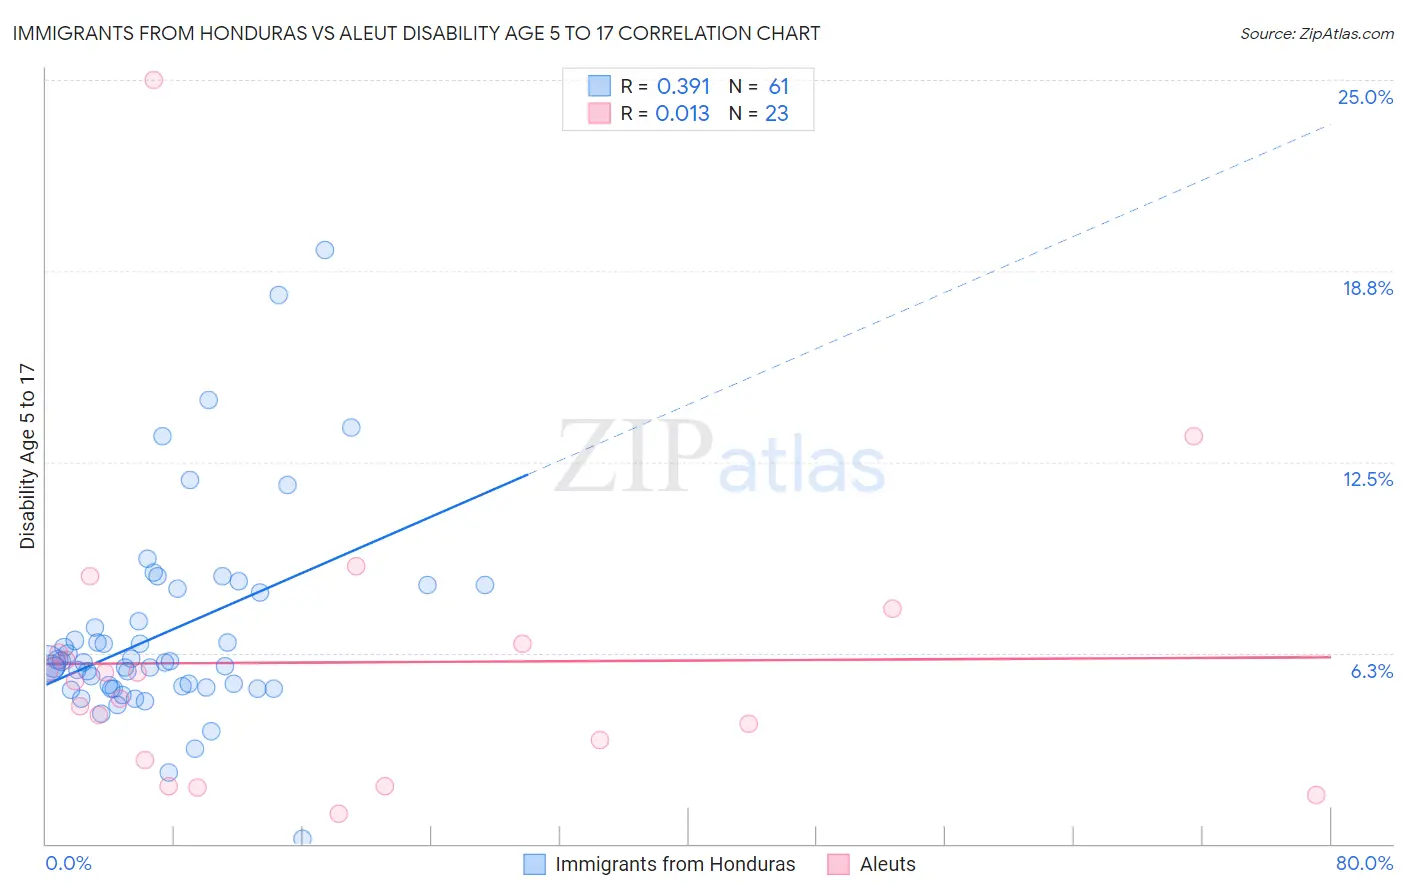
Immigrants from Honduras vs Aleut Disability Age 5 to 17 Correlation Chart
The statistical analysis conducted on geographies consisting of 321,075,572 people shows a mild positive correlation between the proportion of Immigrants from Honduras and percentage of population with a disability between the ages 5 and 17 in the United States with a correlation coefficient (R) of 0.391 and weighted average of 5.9%. Similarly, the statistical analysis conducted on geographies consisting of 61,654,039 people shows no correlation between the proportion of Aleuts and percentage of population with a disability between the ages 5 and 17 in the United States with a correlation coefficient (R) of 0.013 and weighted average of 5.3%, a difference of 10.1%.
Disability Age 5 to 17 Correlation Summary
| Measurement | Immigrants from Honduras | Aleut |
| Minimum | 0.17% | 0.99% |
| Maximum | 19.4% | 25.0% |
| Range | 19.3% | 24.0% |
| Mean | 6.9% | 5.9% |
| Median | 5.9% | 5.3% |
| Interquartile 25% (IQ1) | 5.1% | 2.7% |
| Interquartile 75% (IQ3) | 8.3% | 6.6% |
| Interquartile Range (IQR) | 3.2% | 3.8% |
| Standard Deviation (Sample) | 3.4% | 5.0% |
| Standard Deviation (Population) | 3.3% | 4.9% |
Similar Demographics by Disability Age 5 to 17
Demographics Similar to Immigrants from Honduras by Disability Age 5 to 17
In terms of disability age 5 to 17, the demographic groups most similar to Immigrants from Honduras are Immigrants from Germany (5.9%, a difference of 0.030%), Immigrants from Micronesia (5.9%, a difference of 0.030%), Tlingit-Haida (5.9%, a difference of 0.030%), British (5.9%, a difference of 0.070%), and Indonesian (5.9%, a difference of 0.090%).
| Demographics | Rating | Rank | Disability Age 5 to 17 |
| West Indians | 2.4 /100 | #240 | Tragic 5.9% |
| Immigrants | Caribbean | 2.1 /100 | #241 | Tragic 5.9% |
| Spaniards | 2.0 /100 | #242 | Tragic 5.9% |
| Indonesians | 2.0 /100 | #243 | Tragic 5.9% |
| Immigrants | Germany | 1.9 /100 | #244 | Tragic 5.9% |
| Immigrants | Micronesia | 1.9 /100 | #245 | Tragic 5.9% |
| Tlingit-Haida | 1.9 /100 | #246 | Tragic 5.9% |
| Immigrants | Honduras | 1.8 /100 | #247 | Tragic 5.9% |
| British | 1.7 /100 | #248 | Tragic 5.9% |
| Immigrants | Ghana | 1.7 /100 | #249 | Tragic 5.9% |
| Poles | 1.5 /100 | #250 | Tragic 5.9% |
| Immigrants | Cambodia | 1.5 /100 | #251 | Tragic 5.9% |
| Hondurans | 1.5 /100 | #252 | Tragic 5.9% |
| Scandinavians | 1.4 /100 | #253 | Tragic 5.9% |
| Barbadians | 1.3 /100 | #254 | Tragic 5.9% |
Demographics Similar to Aleuts by Disability Age 5 to 17
In terms of disability age 5 to 17, the demographic groups most similar to Aleuts are Immigrants from Northern Europe (5.3%, a difference of 0.020%), Immigrants from Latvia (5.3%, a difference of 0.040%), Cuban (5.3%, a difference of 0.040%), Ethiopian (5.3%, a difference of 0.060%), and Immigrants from Eritrea (5.3%, a difference of 0.10%).
| Demographics | Rating | Rank | Disability Age 5 to 17 |
| Immigrants | Yemen | 98.2 /100 | #106 | Exceptional 5.3% |
| Russians | 98.2 /100 | #107 | Exceptional 5.3% |
| Immigrants | South Africa | 98.1 /100 | #108 | Exceptional 5.3% |
| Immigrants | Northern Africa | 98.1 /100 | #109 | Exceptional 5.3% |
| Immigrants | Eritrea | 98.0 /100 | #110 | Exceptional 5.3% |
| Ethiopians | 97.9 /100 | #111 | Exceptional 5.3% |
| Immigrants | Latvia | 97.9 /100 | #112 | Exceptional 5.3% |
| Aleuts | 97.8 /100 | #113 | Exceptional 5.3% |
| Immigrants | Northern Europe | 97.8 /100 | #114 | Exceptional 5.3% |
| Cubans | 97.8 /100 | #115 | Exceptional 5.3% |
| Cypriots | 97.7 /100 | #116 | Exceptional 5.3% |
| Immigrants | Afghanistan | 97.4 /100 | #117 | Exceptional 5.3% |
| South Americans | 97.1 /100 | #118 | Exceptional 5.4% |
| Immigrants | South America | 97.1 /100 | #119 | Exceptional 5.4% |
| Immigrants | Immigrants | 97.0 /100 | #120 | Exceptional 5.4% |