Immigrants from Bangladesh vs British Disability Age 5 to 17
COMPARE
Immigrants from Bangladesh
British
Disability Age 5 to 17
Disability Age 5 to 17 Comparison
Immigrants from Bangladesh
British
5.2%
DISABILITY AGE 5 TO 17
99.8/ 100
METRIC RATING
63rd/ 347
METRIC RANK
5.9%
DISABILITY AGE 5 TO 17
1.7/ 100
METRIC RATING
248th/ 347
METRIC RANK
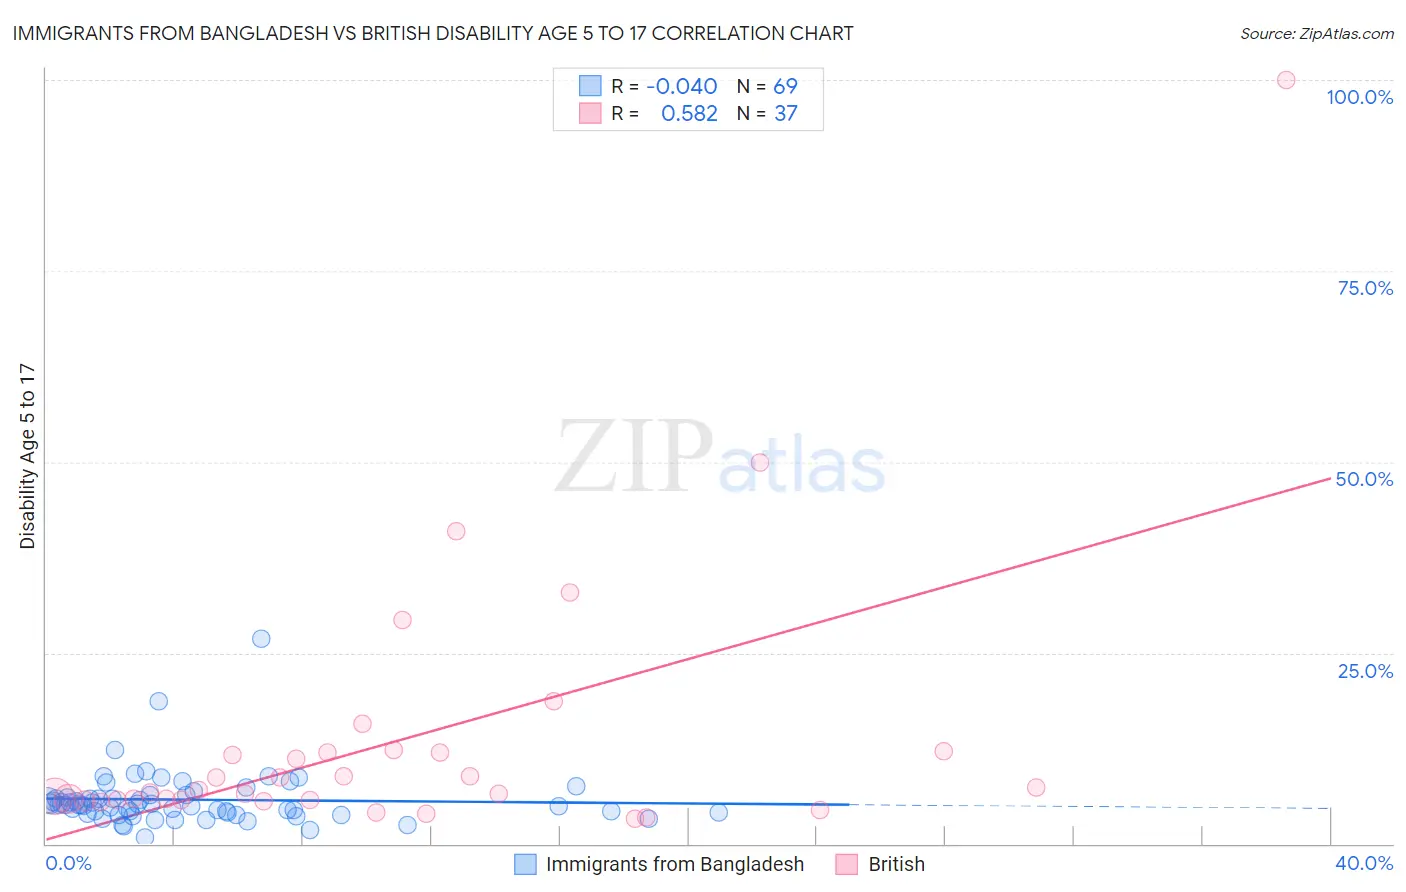
Immigrants from Bangladesh vs British Disability Age 5 to 17 Correlation Chart
The statistical analysis conducted on geographies consisting of 202,959,719 people shows no correlation between the proportion of Immigrants from Bangladesh and percentage of population with a disability between the ages 5 and 17 in the United States with a correlation coefficient (R) of -0.040 and weighted average of 5.2%. Similarly, the statistical analysis conducted on geographies consisting of 522,278,318 people shows a substantial positive correlation between the proportion of British and percentage of population with a disability between the ages 5 and 17 in the United States with a correlation coefficient (R) of 0.582 and weighted average of 5.9%, a difference of 13.6%.
Disability Age 5 to 17 Correlation Summary
| Measurement | Immigrants from Bangladesh | British |
| Minimum | 0.80% | 3.2% |
| Maximum | 26.8% | 100.0% |
| Range | 26.0% | 96.8% |
| Mean | 5.8% | 13.6% |
| Median | 5.1% | 7.0% |
| Interquartile 25% (IQ1) | 4.0% | 5.7% |
| Interquartile 75% (IQ3) | 6.2% | 12.0% |
| Interquartile Range (IQR) | 2.2% | 6.2% |
| Standard Deviation (Sample) | 3.7% | 18.0% |
| Standard Deviation (Population) | 3.6% | 17.7% |
Similar Demographics by Disability Age 5 to 17
Demographics Similar to Immigrants from Bangladesh by Disability Age 5 to 17
In terms of disability age 5 to 17, the demographic groups most similar to Immigrants from Bangladesh are Immigrants from South Eastern Asia (5.2%, a difference of 0.030%), Immigrants from Greece (5.2%, a difference of 0.040%), Palestinian (5.2%, a difference of 0.090%), Immigrants from Ireland (5.2%, a difference of 0.11%), and Macedonian (5.2%, a difference of 0.11%).
| Demographics | Rating | Rank | Disability Age 5 to 17 |
| Immigrants | Turkey | 99.9 /100 | #56 | Exceptional 5.1% |
| Immigrants | Poland | 99.9 /100 | #57 | Exceptional 5.1% |
| Immigrants | Ukraine | 99.9 /100 | #58 | Exceptional 5.1% |
| Immigrants | North Macedonia | 99.9 /100 | #59 | Exceptional 5.1% |
| Immigrants | Eastern Europe | 99.9 /100 | #60 | Exceptional 5.1% |
| Immigrants | Switzerland | 99.8 /100 | #61 | Exceptional 5.2% |
| Immigrants | Ireland | 99.8 /100 | #62 | Exceptional 5.2% |
| Immigrants | Bangladesh | 99.8 /100 | #63 | Exceptional 5.2% |
| Immigrants | South Eastern Asia | 99.8 /100 | #64 | Exceptional 5.2% |
| Immigrants | Greece | 99.8 /100 | #65 | Exceptional 5.2% |
| Palestinians | 99.8 /100 | #66 | Exceptional 5.2% |
| Macedonians | 99.8 /100 | #67 | Exceptional 5.2% |
| Immigrants | Syria | 99.7 /100 | #68 | Exceptional 5.2% |
| Guyanese | 99.7 /100 | #69 | Exceptional 5.2% |
| Immigrants | Belgium | 99.7 /100 | #70 | Exceptional 5.2% |
Demographics Similar to British by Disability Age 5 to 17
In terms of disability age 5 to 17, the demographic groups most similar to British are Immigrants from Ghana (5.9%, a difference of 0.010%), Immigrants from Honduras (5.9%, a difference of 0.070%), Immigrants from Micronesia (5.9%, a difference of 0.10%), Tlingit-Haida (5.9%, a difference of 0.10%), and Immigrants from Germany (5.9%, a difference of 0.11%).
| Demographics | Rating | Rank | Disability Age 5 to 17 |
| Immigrants | Caribbean | 2.1 /100 | #241 | Tragic 5.9% |
| Spaniards | 2.0 /100 | #242 | Tragic 5.9% |
| Indonesians | 2.0 /100 | #243 | Tragic 5.9% |
| Immigrants | Germany | 1.9 /100 | #244 | Tragic 5.9% |
| Immigrants | Micronesia | 1.9 /100 | #245 | Tragic 5.9% |
| Tlingit-Haida | 1.9 /100 | #246 | Tragic 5.9% |
| Immigrants | Honduras | 1.8 /100 | #247 | Tragic 5.9% |
| British | 1.7 /100 | #248 | Tragic 5.9% |
| Immigrants | Ghana | 1.7 /100 | #249 | Tragic 5.9% |
| Poles | 1.5 /100 | #250 | Tragic 5.9% |
| Immigrants | Cambodia | 1.5 /100 | #251 | Tragic 5.9% |
| Hondurans | 1.5 /100 | #252 | Tragic 5.9% |
| Scandinavians | 1.4 /100 | #253 | Tragic 5.9% |
| Barbadians | 1.3 /100 | #254 | Tragic 5.9% |
| Italians | 1.2 /100 | #255 | Tragic 5.9% |