Greek Male Disability
COMPARE
Greek
Select to Compare
Male Disability
Greek Male Disability
11.4%
DISABILITY | MALES
22.2/ 100
METRIC RATING
193rd/ 347
METRIC RANK
Greek Male Disability Correlation Chart
The statistical analysis conducted on geographies consisting of 482,664,692 people shows a mild positive correlation between the proportion of Greeks and percentage of males with a disability in the United States with a correlation coefficient (R) of 0.350 and weighted average of 11.4%. On average, for every 1% (one percent) increase in Greeks within a typical geography, there is an increase of 0.23% in percentage of males with a disability.
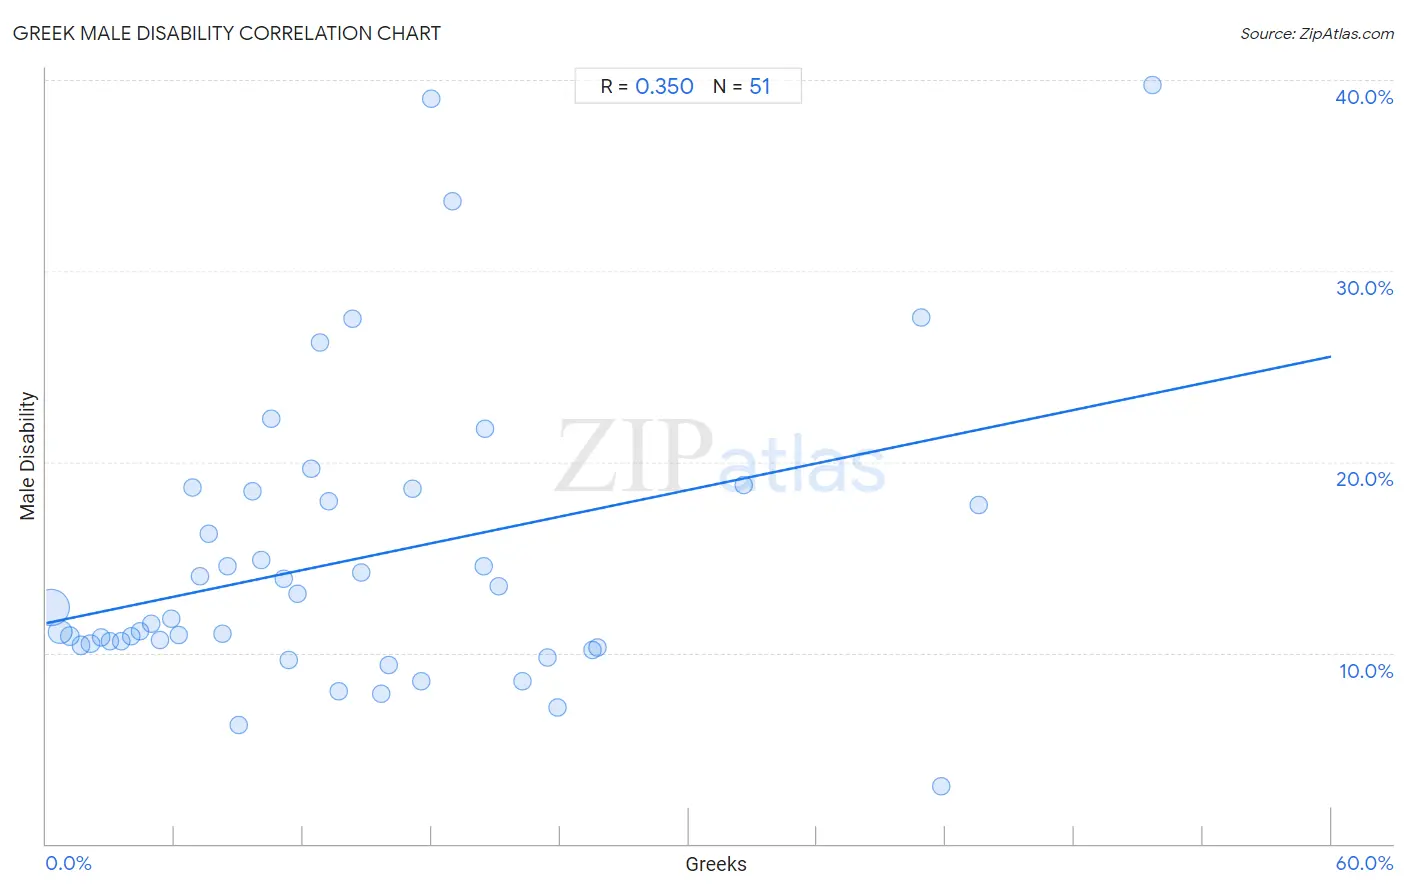
It is essential to understand that the correlation between the percentage of Greeks and percentage of males with a disability does not imply a direct cause-and-effect relationship. It remains uncertain whether the presence of Greeks influences an upward or downward trend in the level of percentage of males with a disability within an area, or if Greeks simply ended up residing in those areas with higher or lower levels of percentage of males with a disability due to other factors.
Demographics Similar to Greeks by Male Disability
In terms of male disability, the demographic groups most similar to Greeks are Assyrian/Chaldean/Syriac (11.4%, a difference of 0.070%), Senegalese (11.4%, a difference of 0.080%), Belizean (11.4%, a difference of 0.080%), Immigrants from Oceania (11.4%, a difference of 0.11%), and Immigrants from Bosnia and Herzegovina (11.4%, a difference of 0.24%).
| Demographics | Rating | Rank | Male Disability |
| Immigrants from Zaire | 27.6 /100 | #186 | Fair 11.4% |
| Immigrants from Austria | 27.3 /100 | #187 | Fair 11.4% |
| Estonians | 26.8 /100 | #188 | Fair 11.4% |
| Immigrants from Netherlands | 25.9 /100 | #189 | Fair 11.4% |
| Immigrants from Bosnia and Herzegovina | 25.4 /100 | #190 | Fair 11.4% |
| Senegalese | 23.2 /100 | #191 | Fair 11.4% |
| Assyrians/Chaldeans/Syriacs | 23.2 /100 | #192 | Fair 11.4% |
| Greeks | 22.2 /100 | #193 | Fair 11.4% |
| Belizeans | 21.2 /100 | #194 | Fair 11.4% |
| Immigrants from Oceania | 20.9 /100 | #195 | Fair 11.4% |
| West Indians | 18.4 /100 | #196 | Poor 11.4% |
| Somalis | 18.2 /100 | #197 | Poor 11.4% |
| Immigrants from Jamaica | 16.3 /100 | #198 | Poor 11.5% |
| Lebanese | 15.4 /100 | #199 | Poor 11.5% |
| Immigrants from Iraq | 13.0 /100 | #200 | Poor 11.5% |
Greek Male Disability Correlation Summary
| Measurement | Greek Data | Male Disability Data |
| Minimum | 0.21% | 3.0% |
| Maximum | 51.6% | 39.7% |
| Range | 51.4% | 36.7% |
| Mean | 14.4% | 14.9% |
| Median | 11.7% | 11.8% |
| Interquartile 25% (IQ1) | 5.8% | 10.4% |
| Interquartile 75% (IQ3) | 20.4% | 18.5% |
| Interquartile Range (IQR) | 14.6% | 8.1% |
| Standard Deviation (Sample) | 11.7% | 7.8% |
| Standard Deviation (Population) | 11.6% | 7.7% |
Correlation Details
| Greek Percentile | Sample Size | Male Disability |
[ 0.0% - 0.5% ] 0.21% | 330,042,341 | 12.4% |
[ 0.5% - 1.0% ] 0.65% | 103,164,387 | 11.1% |
[ 1.0% - 1.5% ] 1.11% | 27,147,635 | 10.9% |
[ 1.5% - 2.0% ] 1.61% | 11,028,329 | 10.4% |
[ 2.0% - 2.5% ] 2.06% | 4,393,710 | 10.5% |
[ 2.5% - 3.0% ] 2.55% | 2,864,042 | 10.8% |
[ 2.5% - 3.0% ] 3.00% | 1,535,707 | 10.6% |
[ 3.0% - 3.5% ] 3.50% | 787,984 | 10.6% |
[ 3.5% - 4.0% ] 3.95% | 350,647 | 10.9% |
[ 4.0% - 4.5% ] 4.40% | 504,599 | 11.1% |
[ 4.5% - 5.0% ] 4.91% | 153,907 | 11.6% |
[ 5.0% - 5.5% ] 5.29% | 165,136 | 10.7% |
[ 5.5% - 6.0% ] 5.82% | 132,391 | 11.8% |
[ 6.0% - 6.5% ] 6.20% | 103,717 | 11.0% |
[ 6.5% - 7.0% ] 6.80% | 60,511 | 18.7% |
[ 7.0% - 7.5% ] 7.17% | 86,613 | 14.0% |
[ 7.5% - 8.0% ] 7.60% | 31,256 | 16.2% |
[ 8.0% - 8.5% ] 8.24% | 3,848 | 11.0% |
[ 8.0% - 8.5% ] 8.49% | 2,416 | 14.6% |
[ 8.5% - 9.0% ] 8.98% | 958 | 6.2% |
[ 9.5% - 10.0% ] 9.63% | 8,390 | 18.5% |
[ 10.0% - 10.5% ] 10.01% | 7,410 | 14.9% |
[ 10.5% - 11.0% ] 10.50% | 1,019 | 22.3% |
[ 11.0% - 11.5% ] 11.11% | 12,103 | 13.8% |
[ 11.0% - 11.5% ] 11.31% | 50,577 | 9.6% |
[ 11.5% - 12.0% ] 11.72% | 2,612 | 13.1% |
[ 12.0% - 12.5% ] 12.35% | 2,833 | 19.6% |
[ 12.5% - 13.0% ] 12.79% | 1,267 | 26.3% |
[ 13.0% - 13.5% ] 13.17% | 463 | 17.9% |
[ 13.5% - 14.0% ] 13.68% | 665 | 8.0% |
[ 14.0% - 14.5% ] 14.29% | 525 | 27.5% |
[ 14.5% - 15.0% ] 14.71% | 3,692 | 14.2% |
[ 15.5% - 16.0% ] 15.62% | 4,226 | 7.9% |
[ 16.0% - 16.5% ] 16.01% | 1,443 | 9.4% |
[ 17.0% - 17.5% ] 17.07% | 943 | 18.6% |
[ 17.5% - 18.0% ] 17.53% | 753 | 8.5% |
[ 17.5% - 18.0% ] 17.95% | 234 | 39.0% |
[ 18.5% - 19.0% ] 18.95% | 438 | 33.6% |
[ 20.0% - 20.5% ] 20.43% | 421 | 14.5% |
[ 20.0% - 20.5% ] 20.48% | 83 | 21.7% |
[ 21.0% - 21.5% ] 21.15% | 2,151 | 13.5% |
[ 22.0% - 22.5% ] 22.22% | 72 | 8.5% |
[ 23.0% - 23.5% ] 23.43% | 700 | 9.8% |
[ 23.5% - 24.0% ] 23.86% | 88 | 7.1% |
[ 25.5% - 26.0% ] 25.51% | 396 | 10.2% |
[ 25.5% - 26.0% ] 25.77% | 392 | 10.3% |
[ 32.5% - 33.0% ] 32.59% | 313 | 18.8% |
[ 40.5% - 41.0% ] 40.85% | 71 | 27.6% |
[ 41.5% - 42.0% ] 41.77% | 79 | 3.0% |
[ 43.5% - 44.0% ] 43.52% | 108 | 17.7% |
[ 51.5% - 52.0% ] 51.65% | 91 | 39.7% |