Greek vs Yup'ik Disability Age 5 to 17
COMPARE
Greek
Yup'ik
Disability Age 5 to 17
Disability Age 5 to 17 Comparison
Greeks
Yup'ik
5.6%
DISABILITY AGE 5 TO 17
60.6/ 100
METRIC RATING
166th/ 347
METRIC RANK
4.8%
DISABILITY AGE 5 TO 17
100.0/ 100
METRIC RATING
21st/ 347
METRIC RANK
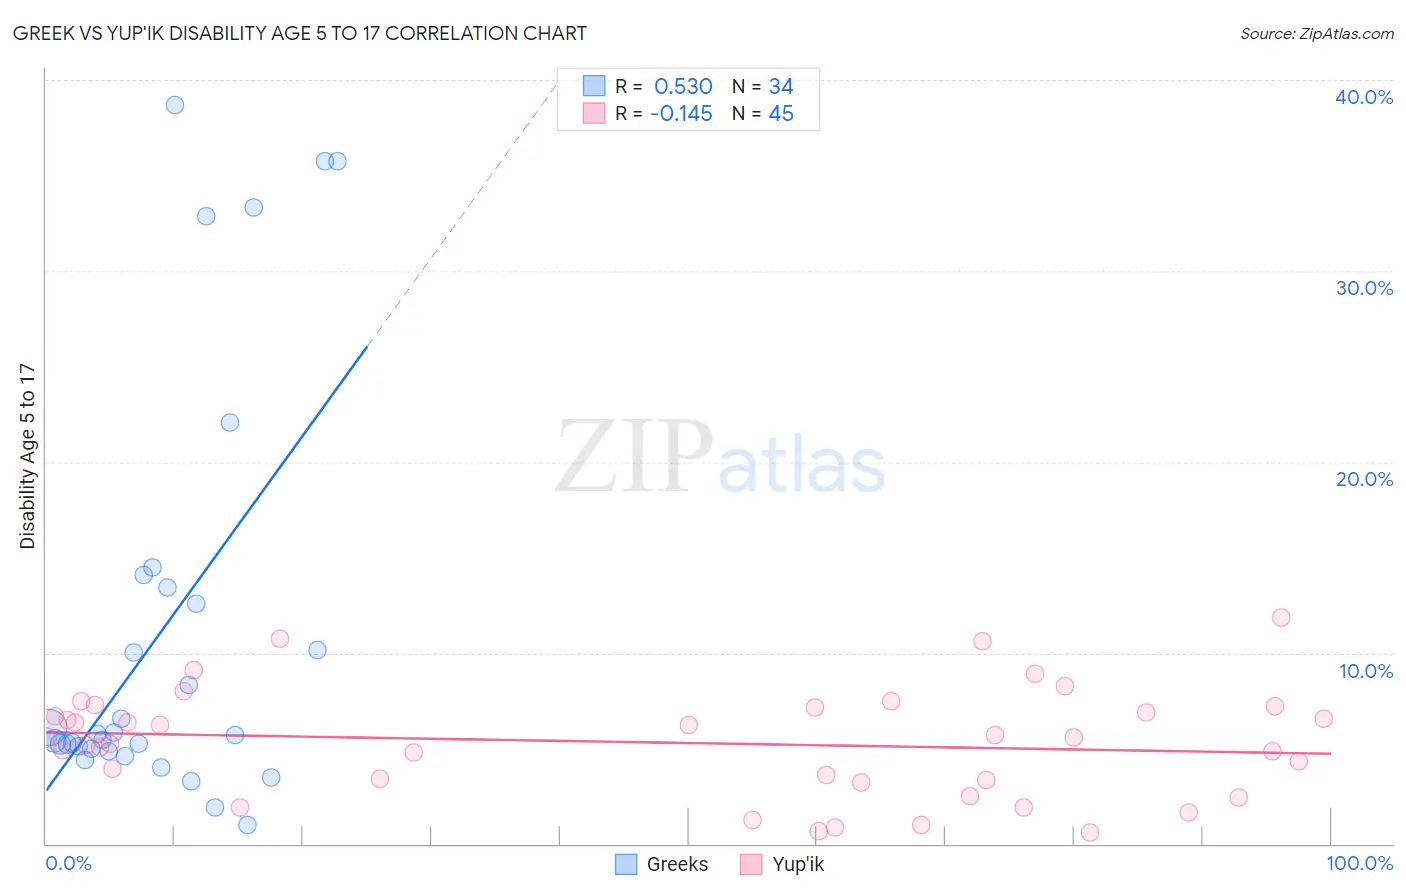
Greek vs Yup'ik Disability Age 5 to 17 Correlation Chart
The statistical analysis conducted on geographies consisting of 476,363,974 people shows a substantial positive correlation between the proportion of Greeks and percentage of population with a disability between the ages 5 and 17 in the United States with a correlation coefficient (R) of 0.530 and weighted average of 5.6%. Similarly, the statistical analysis conducted on geographies consisting of 39,814,891 people shows a poor negative correlation between the proportion of Yup'ik and percentage of population with a disability between the ages 5 and 17 in the United States with a correlation coefficient (R) of -0.145 and weighted average of 4.8%, a difference of 16.3%.
Disability Age 5 to 17 Correlation Summary
| Measurement | Greek | Yup'ik |
| Minimum | 0.96% | 0.58% |
| Maximum | 38.7% | 11.9% |
| Range | 37.7% | 11.3% |
| Mean | 11.2% | 5.3% |
| Median | 5.7% | 5.6% |
| Interquartile 25% (IQ1) | 5.0% | 3.3% |
| Interquartile 75% (IQ3) | 13.4% | 7.2% |
| Interquartile Range (IQR) | 8.5% | 3.9% |
| Standard Deviation (Sample) | 11.0% | 2.8% |
| Standard Deviation (Population) | 10.8% | 2.8% |
Similar Demographics by Disability Age 5 to 17
Demographics Similar to Greeks by Disability Age 5 to 17
In terms of disability age 5 to 17, the demographic groups most similar to Greeks are Lebanese (5.6%, a difference of 0.040%), Immigrants from Scotland (5.6%, a difference of 0.070%), Immigrants from Burma/Myanmar (5.6%, a difference of 0.070%), Immigrants from Southern Europe (5.6%, a difference of 0.18%), and Iraqi (5.6%, a difference of 0.23%).
| Demographics | Rating | Rank | Disability Age 5 to 17 |
| Immigrants | Zimbabwe | 75.3 /100 | #159 | Good 5.5% |
| South Africans | 73.3 /100 | #160 | Good 5.5% |
| Immigrants | Saudi Arabia | 69.1 /100 | #161 | Good 5.5% |
| Zimbabweans | 67.2 /100 | #162 | Good 5.5% |
| Immigrants | Southern Europe | 64.0 /100 | #163 | Good 5.6% |
| Immigrants | Scotland | 61.9 /100 | #164 | Good 5.6% |
| Lebanese | 61.4 /100 | #165 | Good 5.6% |
| Greeks | 60.6 /100 | #166 | Good 5.6% |
| Immigrants | Burma/Myanmar | 59.3 /100 | #167 | Average 5.6% |
| Iraqis | 56.0 /100 | #168 | Average 5.6% |
| Immigrants | Norway | 55.7 /100 | #169 | Average 5.6% |
| Serbians | 54.0 /100 | #170 | Average 5.6% |
| Immigrants | Iraq | 53.9 /100 | #171 | Average 5.6% |
| Ukrainians | 51.5 /100 | #172 | Average 5.6% |
| Uruguayans | 51.0 /100 | #173 | Average 5.6% |
Demographics Similar to Yup'ik by Disability Age 5 to 17
In terms of disability age 5 to 17, the demographic groups most similar to Yup'ik are Burmese (4.8%, a difference of 0.22%), Asian (4.8%, a difference of 0.34%), Immigrants from Uzbekistan (4.8%, a difference of 0.60%), Immigrants from Bolivia (4.8%, a difference of 1.0%), and Immigrants from South Central Asia (4.7%, a difference of 1.1%).
| Demographics | Rating | Rank | Disability Age 5 to 17 |
| Immigrants | Korea | 100.0 /100 | #14 | Exceptional 4.7% |
| Chinese | 100.0 /100 | #15 | Exceptional 4.7% |
| Immigrants | Singapore | 100.0 /100 | #16 | Exceptional 4.7% |
| Arapaho | 100.0 /100 | #17 | Exceptional 4.7% |
| Immigrants | South Central Asia | 100.0 /100 | #18 | Exceptional 4.7% |
| Immigrants | Uzbekistan | 100.0 /100 | #19 | Exceptional 4.8% |
| Burmese | 100.0 /100 | #20 | Exceptional 4.8% |
| Yup'ik | 100.0 /100 | #21 | Exceptional 4.8% |
| Asians | 100.0 /100 | #22 | Exceptional 4.8% |
| Immigrants | Bolivia | 100.0 /100 | #23 | Exceptional 4.8% |
| Immigrants | Lebanon | 100.0 /100 | #24 | Exceptional 4.8% |
| Immigrants | Asia | 100.0 /100 | #25 | Exceptional 4.8% |
| Bhutanese | 100.0 /100 | #26 | Exceptional 4.9% |
| Taiwanese | 100.0 /100 | #27 | Exceptional 4.9% |
| Immigrants | Japan | 100.0 /100 | #28 | Exceptional 4.9% |