Greek vs Alaska Native Disability Age 5 to 17
COMPARE
Greek
Alaska Native
Disability Age 5 to 17
Disability Age 5 to 17 Comparison
Greeks
Alaska Natives
5.6%
DISABILITY AGE 5 TO 17
60.6/ 100
METRIC RATING
166th/ 347
METRIC RANK
6.0%
DISABILITY AGE 5 TO 17
0.2/ 100
METRIC RATING
273rd/ 347
METRIC RANK
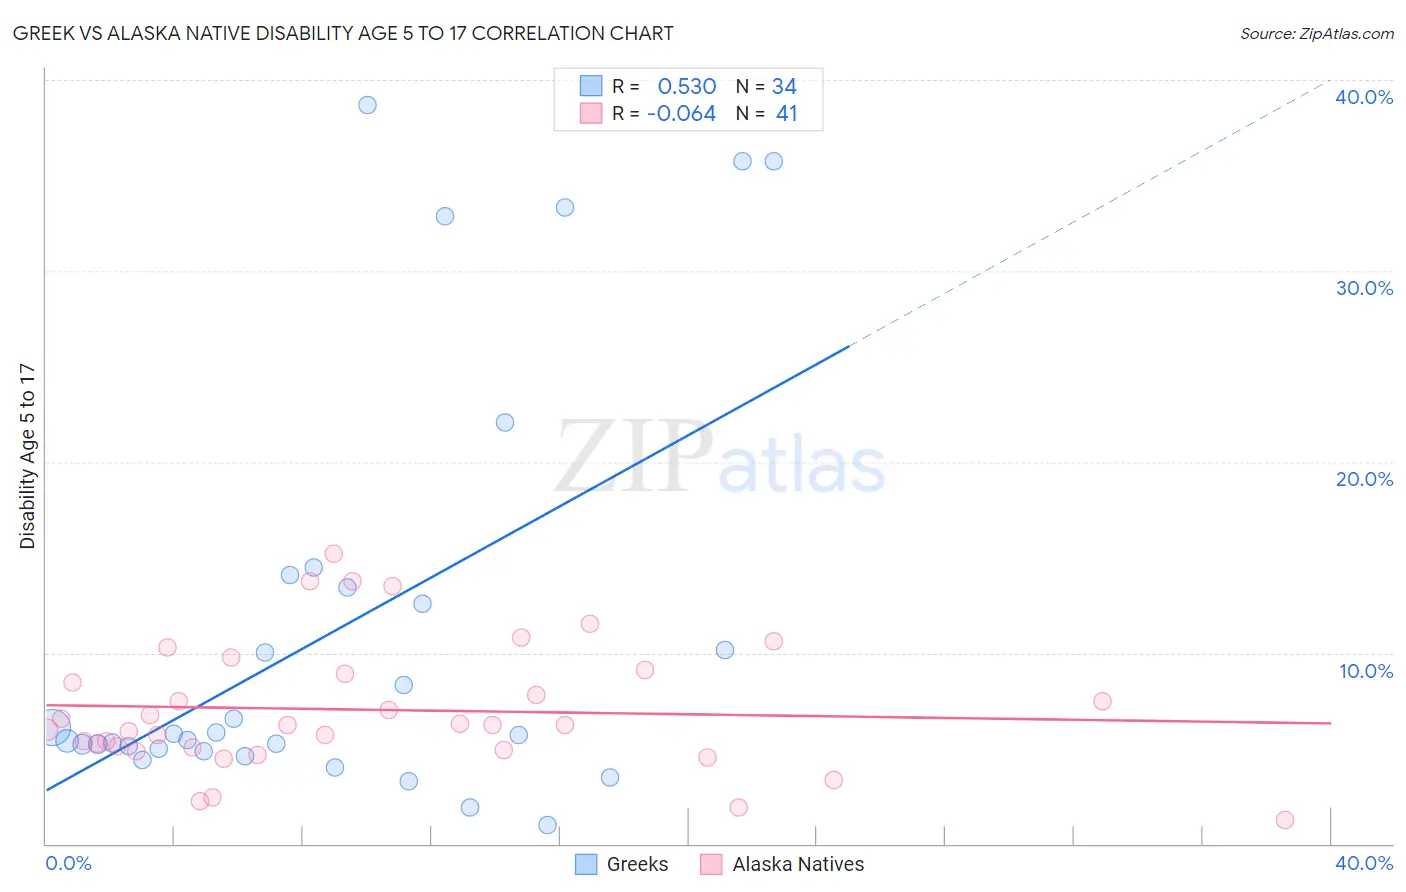
Greek vs Alaska Native Disability Age 5 to 17 Correlation Chart
The statistical analysis conducted on geographies consisting of 476,363,974 people shows a substantial positive correlation between the proportion of Greeks and percentage of population with a disability between the ages 5 and 17 in the United States with a correlation coefficient (R) of 0.530 and weighted average of 5.6%. Similarly, the statistical analysis conducted on geographies consisting of 76,612,507 people shows a slight negative correlation between the proportion of Alaska Natives and percentage of population with a disability between the ages 5 and 17 in the United States with a correlation coefficient (R) of -0.064 and weighted average of 6.0%, a difference of 8.3%.
Disability Age 5 to 17 Correlation Summary
| Measurement | Greek | Alaska Native |
| Minimum | 0.96% | 1.3% |
| Maximum | 38.7% | 15.2% |
| Range | 37.7% | 13.9% |
| Mean | 11.2% | 7.0% |
| Median | 5.7% | 6.2% |
| Interquartile 25% (IQ1) | 5.0% | 5.0% |
| Interquartile 75% (IQ3) | 13.4% | 9.0% |
| Interquartile Range (IQR) | 8.5% | 4.0% |
| Standard Deviation (Sample) | 11.0% | 3.3% |
| Standard Deviation (Population) | 10.8% | 3.3% |
Similar Demographics by Disability Age 5 to 17
Demographics Similar to Greeks by Disability Age 5 to 17
In terms of disability age 5 to 17, the demographic groups most similar to Greeks are Lebanese (5.6%, a difference of 0.040%), Immigrants from Scotland (5.6%, a difference of 0.070%), Immigrants from Burma/Myanmar (5.6%, a difference of 0.070%), Immigrants from Southern Europe (5.6%, a difference of 0.18%), and Iraqi (5.6%, a difference of 0.23%).
| Demographics | Rating | Rank | Disability Age 5 to 17 |
| Immigrants | Zimbabwe | 75.3 /100 | #159 | Good 5.5% |
| South Africans | 73.3 /100 | #160 | Good 5.5% |
| Immigrants | Saudi Arabia | 69.1 /100 | #161 | Good 5.5% |
| Zimbabweans | 67.2 /100 | #162 | Good 5.5% |
| Immigrants | Southern Europe | 64.0 /100 | #163 | Good 5.6% |
| Immigrants | Scotland | 61.9 /100 | #164 | Good 5.6% |
| Lebanese | 61.4 /100 | #165 | Good 5.6% |
| Greeks | 60.6 /100 | #166 | Good 5.6% |
| Immigrants | Burma/Myanmar | 59.3 /100 | #167 | Average 5.6% |
| Iraqis | 56.0 /100 | #168 | Average 5.6% |
| Immigrants | Norway | 55.7 /100 | #169 | Average 5.6% |
| Serbians | 54.0 /100 | #170 | Average 5.6% |
| Immigrants | Iraq | 53.9 /100 | #171 | Average 5.6% |
| Ukrainians | 51.5 /100 | #172 | Average 5.6% |
| Uruguayans | 51.0 /100 | #173 | Average 5.6% |
Demographics Similar to Alaska Natives by Disability Age 5 to 17
In terms of disability age 5 to 17, the demographic groups most similar to Alaska Natives are Finnish (6.0%, a difference of 0.050%), Immigrants from Zaire (6.0%, a difference of 0.080%), Cheyenne (6.0%, a difference of 0.11%), Dutch (6.0%, a difference of 0.22%), and Japanese (6.1%, a difference of 0.33%).
| Demographics | Rating | Rank | Disability Age 5 to 17 |
| Slovenes | 0.6 /100 | #266 | Tragic 6.0% |
| Spanish | 0.5 /100 | #267 | Tragic 6.0% |
| Sioux | 0.4 /100 | #268 | Tragic 6.0% |
| Liberians | 0.4 /100 | #269 | Tragic 6.0% |
| Immigrants | Somalia | 0.4 /100 | #270 | Tragic 6.0% |
| Immigrants | Zaire | 0.2 /100 | #271 | Tragic 6.0% |
| Finns | 0.2 /100 | #272 | Tragic 6.0% |
| Alaska Natives | 0.2 /100 | #273 | Tragic 6.0% |
| Cheyenne | 0.2 /100 | #274 | Tragic 6.0% |
| Dutch | 0.2 /100 | #275 | Tragic 6.0% |
| Japanese | 0.1 /100 | #276 | Tragic 6.1% |
| Puget Sound Salish | 0.1 /100 | #277 | Tragic 6.1% |
| Immigrants | Liberia | 0.1 /100 | #278 | Tragic 6.1% |
| Immigrants | Jamaica | 0.1 /100 | #279 | Tragic 6.1% |
| Portuguese | 0.1 /100 | #280 | Tragic 6.1% |