Greek 2 or more Vehicles in Household
COMPARE
Greek
Select to Compare
2 or more Vehicles in Household
Greek 2 or more Vehicles in Household
57.5%
2+ VEHICLES AVAILABLE
98.0/ 100
METRIC RATING
111th/ 347
METRIC RANK
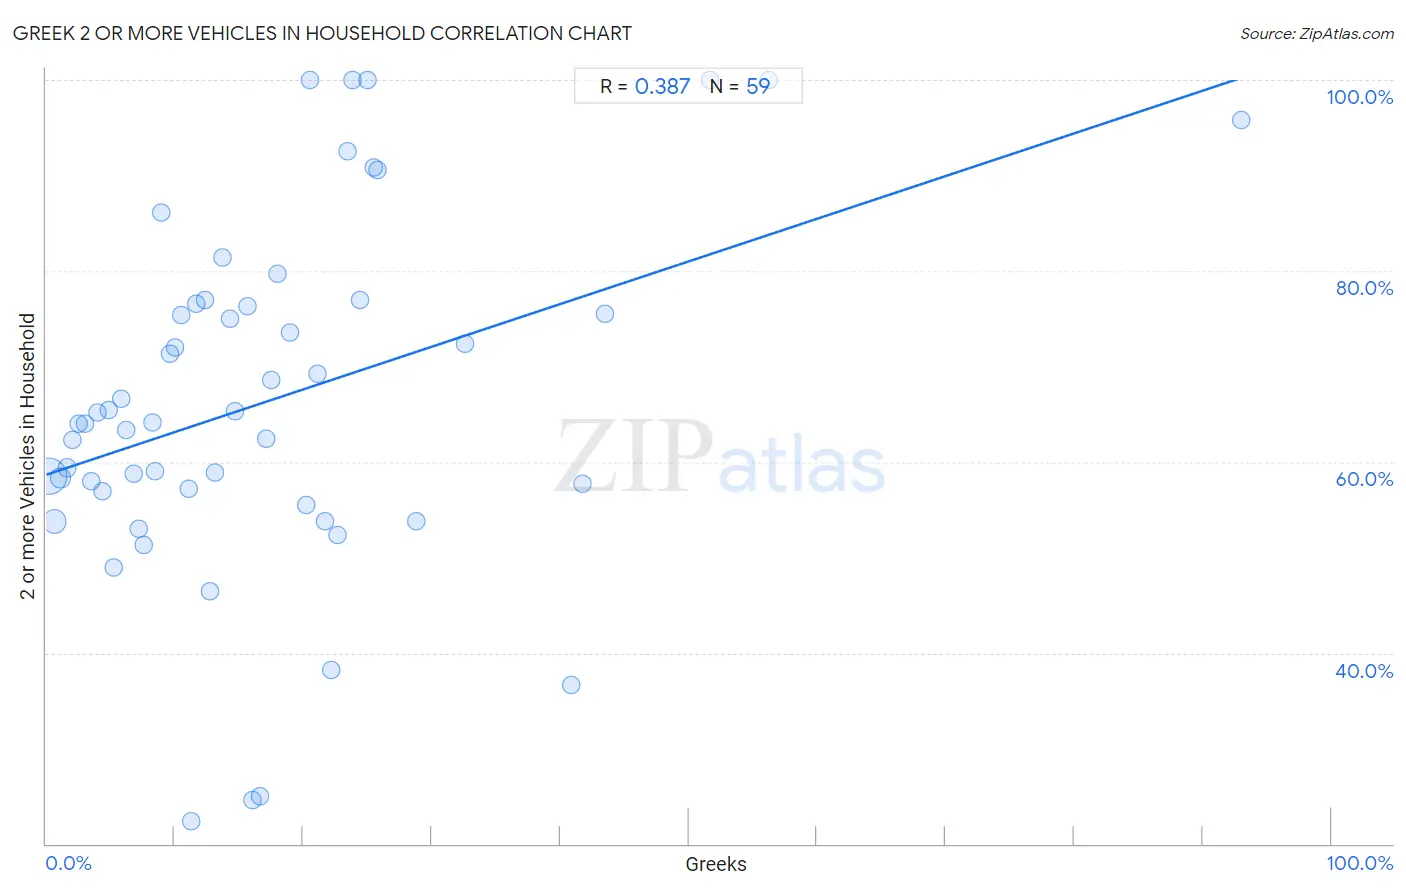
Greek 2 or more Vehicles in Household Correlation Chart
The statistical analysis conducted on geographies consisting of 482,397,984 people shows a mild positive correlation between the proportion of Greeks and percentage of households with 2 or more vehicles available in the United States with a correlation coefficient (R) of 0.387 and weighted average of 57.5%. On average, for every 1% (one percent) increase in Greeks within a typical geography, there is an increase of 0.45% in percentage of households with 2 or more vehicles available.
It is essential to understand that the correlation between the percentage of Greeks and percentage of households with 2 or more vehicles available does not imply a direct cause-and-effect relationship. It remains uncertain whether the presence of Greeks influences an upward or downward trend in the level of percentage of households with 2 or more vehicles available within an area, or if Greeks simply ended up residing in those areas with higher or lower levels of percentage of households with 2 or more vehicles available due to other factors.
Demographics Similar to Greeks by 2 or more Vehicles in Household
In terms of 2 or more vehicles in household, the demographic groups most similar to Greeks are Pueblo (57.5%, a difference of 0.0%), Japanese (57.5%, a difference of 0.030%), Immigrants from North America (57.5%, a difference of 0.050%), Immigrants from Canada (57.5%, a difference of 0.080%), and Immigrants from Netherlands (57.5%, a difference of 0.10%).
| Demographics | Rating | Rank | 2 or more Vehicles in Household |
| Immigrants from Indonesia | 98.2 /100 | #104 | Exceptional 57.6% |
| Immigrants from Korea | 98.2 /100 | #105 | Exceptional 57.6% |
| Immigrants from Oceania | 98.2 /100 | #106 | Exceptional 57.5% |
| Immigrants from Netherlands | 98.2 /100 | #107 | Exceptional 57.5% |
| Immigrants from Canada | 98.1 /100 | #108 | Exceptional 57.5% |
| Immigrants from North America | 98.1 /100 | #109 | Exceptional 57.5% |
| Japanese | 98.0 /100 | #110 | Exceptional 57.5% |
| Greeks | 98.0 /100 | #111 | Exceptional 57.5% |
| Pueblo | 98.0 /100 | #112 | Exceptional 57.5% |
| Zimbabweans | 96.9 /100 | #113 | Exceptional 57.2% |
| Immigrants from Lebanon | 96.8 /100 | #114 | Exceptional 57.2% |
| Chippewa | 96.6 /100 | #115 | Exceptional 57.2% |
| Immigrants from Jordan | 96.6 /100 | #116 | Exceptional 57.2% |
| Iraqis | 95.8 /100 | #117 | Exceptional 57.1% |
| Asians | 95.1 /100 | #118 | Exceptional 57.0% |
Greek 2 or more Vehicles in Household Correlation Summary
| Measurement | Greek Data | 2 or more Vehicles in Household Data |
| Minimum | 0.21% | 22.4% |
| Maximum | 93.0% | 100.0% |
| Range | 92.8% | 77.6% |
| Mean | 17.3% | 66.4% |
| Median | 13.7% | 64.1% |
| Interquartile 25% (IQ1) | 6.8% | 56.9% |
| Interquartile 75% (IQ3) | 22.6% | 76.6% |
| Interquartile Range (IQR) | 15.8% | 19.7% |
| Standard Deviation (Sample) | 16.0% | 18.4% |
| Standard Deviation (Population) | 15.8% | 18.3% |
Correlation Details
| Greek Percentile | Sample Size | 2 or more Vehicles in Household |
[ 0.0% - 0.5% ] 0.21% | 329,920,916 | 58.4% |
[ 0.5% - 1.0% ] 0.65% | 103,092,703 | 53.7% |
[ 1.0% - 1.5% ] 1.11% | 27,107,869 | 58.3% |
[ 1.5% - 2.0% ] 1.61% | 11,000,452 | 59.4% |
[ 2.0% - 2.5% ] 2.06% | 4,389,534 | 62.3% |
[ 2.5% - 3.0% ] 2.55% | 2,860,817 | 64.0% |
[ 2.5% - 3.0% ] 3.00% | 1,535,840 | 64.0% |
[ 3.0% - 3.5% ] 3.50% | 787,222 | 57.9% |
[ 3.5% - 4.0% ] 3.95% | 346,651 | 65.1% |
[ 4.0% - 4.5% ] 4.40% | 504,599 | 56.9% |
[ 4.5% - 5.0% ] 4.91% | 154,577 | 65.5% |
[ 5.0% - 5.5% ] 5.29% | 165,642 | 48.9% |
[ 5.5% - 6.0% ] 5.82% | 133,894 | 66.6% |
[ 6.0% - 6.5% ] 6.20% | 103,717 | 63.4% |
[ 6.5% - 7.0% ] 6.80% | 60,642 | 58.8% |
[ 7.0% - 7.5% ] 7.17% | 86,850 | 53.0% |
[ 7.5% - 8.0% ] 7.60% | 31,375 | 51.3% |
[ 8.0% - 8.5% ] 8.24% | 3,848 | 64.1% |
[ 8.0% - 8.5% ] 8.48% | 2,499 | 59.0% |
[ 8.5% - 9.0% ] 8.93% | 1,534 | 86.1% |
[ 9.5% - 10.0% ] 9.63% | 8,433 | 71.3% |
[ 10.0% - 10.5% ] 10.01% | 7,410 | 72.0% |
[ 10.5% - 11.0% ] 10.50% | 1,019 | 75.3% |
[ 11.0% - 11.5% ] 11.10% | 13,147 | 57.2% |
[ 11.0% - 11.5% ] 11.31% | 50,577 | 22.4% |
[ 11.5% - 12.0% ] 11.72% | 2,612 | 76.6% |
[ 12.0% - 12.5% ] 12.35% | 2,833 | 77.0% |
[ 12.5% - 13.0% ] 12.79% | 1,267 | 46.5% |
[ 13.0% - 13.5% ] 13.17% | 463 | 58.9% |
[ 13.5% - 14.0% ] 13.68% | 665 | 81.4% |
[ 14.0% - 14.5% ] 14.29% | 525 | 75.0% |
[ 14.5% - 15.0% ] 14.71% | 3,773 | 65.3% |
[ 15.5% - 16.0% ] 15.61% | 4,374 | 76.3% |
[ 16.0% - 16.5% ] 16.01% | 1,443 | 24.6% |
[ 16.5% - 17.0% ] 16.67% | 60 | 25.0% |
[ 17.0% - 17.5% ] 17.07% | 943 | 62.4% |
[ 17.5% - 18.0% ] 17.53% | 753 | 68.6% |
[ 17.5% - 18.0% ] 17.95% | 234 | 79.7% |
[ 18.5% - 19.0% ] 18.95% | 438 | 73.6% |
[ 20.0% - 20.5% ] 20.28% | 646 | 55.4% |
[ 20.0% - 20.5% ] 20.48% | 83 | 100.0% |
[ 21.0% - 21.5% ] 21.15% | 2,151 | 69.3% |
[ 21.5% - 22.0% ] 21.68% | 143 | 53.7% |
[ 22.0% - 22.5% ] 22.22% | 72 | 38.2% |
[ 22.5% - 23.0% ] 22.63% | 137 | 52.3% |
[ 23.0% - 23.5% ] 23.43% | 700 | 92.6% |
[ 23.5% - 24.0% ] 23.86% | 88 | 100.0% |
[ 24.0% - 24.5% ] 24.42% | 86 | 76.9% |
[ 25.0% - 25.5% ] 25.00% | 8 | 100.0% |
[ 25.5% - 26.0% ] 25.51% | 396 | 90.8% |
[ 25.5% - 26.0% ] 25.77% | 392 | 90.6% |
[ 28.5% - 29.0% ] 28.83% | 111 | 53.8% |
[ 32.5% - 33.0% ] 32.59% | 313 | 72.3% |
[ 40.5% - 41.0% ] 40.85% | 71 | 36.6% |
[ 41.5% - 42.0% ] 41.77% | 79 | 57.7% |
[ 43.5% - 44.0% ] 43.52% | 108 | 75.6% |
[ 51.5% - 52.0% ] 51.65% | 91 | 100.0% |
[ 56.0% - 56.5% ] 56.25% | 16 | 100.0% |
[ 93.0% - 93.5% ] 93.01% | 143 | 95.8% |