Greek vs Nigerian Disability Age 5 to 17
COMPARE
Greek
Nigerian
Disability Age 5 to 17
Disability Age 5 to 17 Comparison
Greeks
Nigerians
5.6%
DISABILITY AGE 5 TO 17
60.6/ 100
METRIC RATING
166th/ 347
METRIC RANK
5.8%
DISABILITY AGE 5 TO 17
7.5/ 100
METRIC RATING
216th/ 347
METRIC RANK
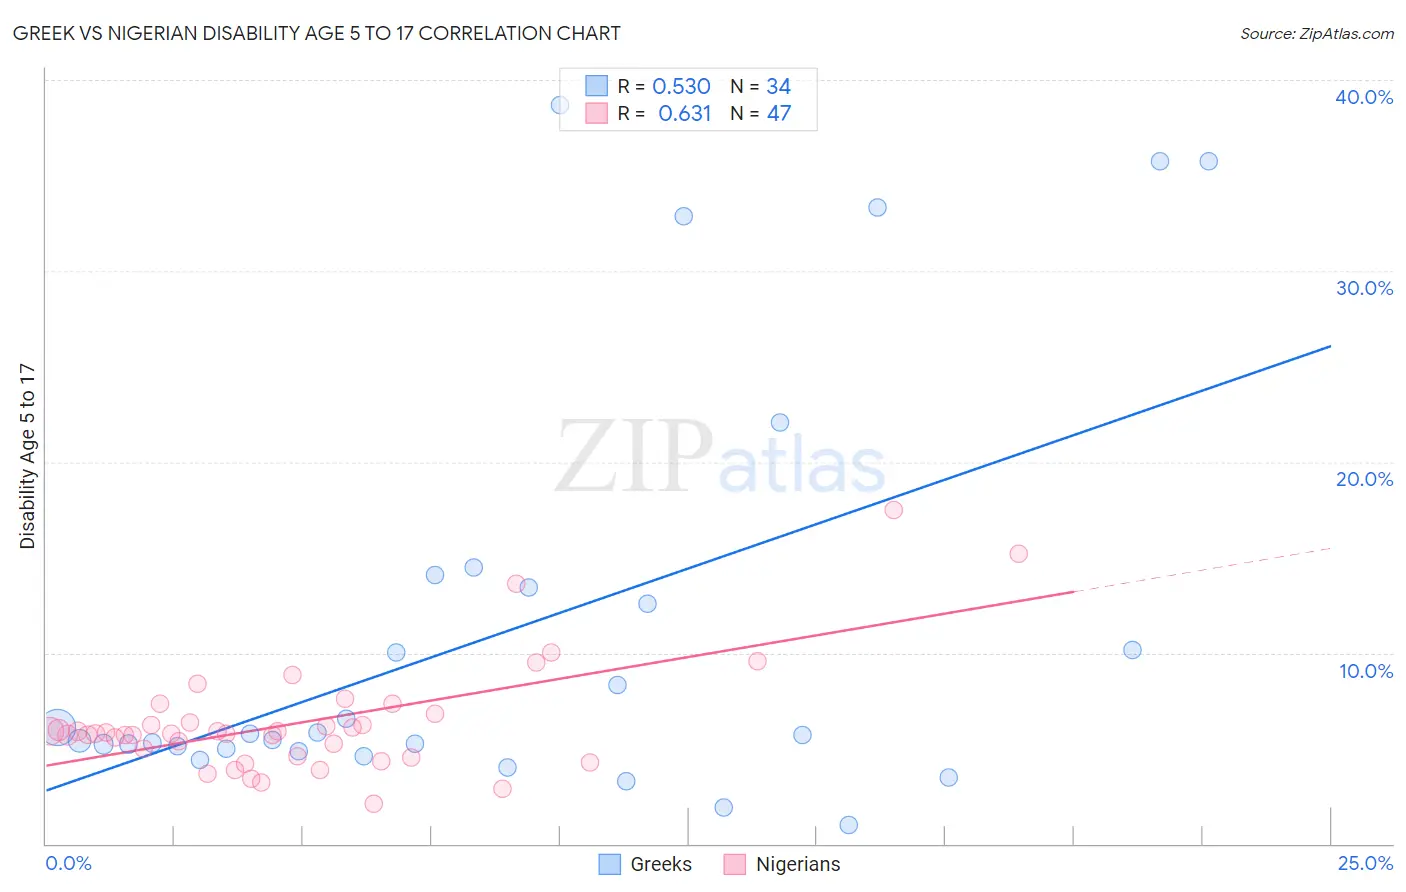
Greek vs Nigerian Disability Age 5 to 17 Correlation Chart
The statistical analysis conducted on geographies consisting of 476,363,974 people shows a substantial positive correlation between the proportion of Greeks and percentage of population with a disability between the ages 5 and 17 in the United States with a correlation coefficient (R) of 0.530 and weighted average of 5.6%. Similarly, the statistical analysis conducted on geographies consisting of 330,899,838 people shows a significant positive correlation between the proportion of Nigerians and percentage of population with a disability between the ages 5 and 17 in the United States with a correlation coefficient (R) of 0.631 and weighted average of 5.8%, a difference of 3.6%.
Disability Age 5 to 17 Correlation Summary
| Measurement | Greek | Nigerian |
| Minimum | 0.96% | 2.1% |
| Maximum | 38.7% | 17.5% |
| Range | 37.7% | 15.4% |
| Mean | 11.2% | 6.4% |
| Median | 5.7% | 5.8% |
| Interquartile 25% (IQ1) | 5.0% | 4.6% |
| Interquartile 75% (IQ3) | 13.4% | 6.8% |
| Interquartile Range (IQR) | 8.5% | 2.2% |
| Standard Deviation (Sample) | 11.0% | 2.9% |
| Standard Deviation (Population) | 10.8% | 2.9% |
Similar Demographics by Disability Age 5 to 17
Demographics Similar to Greeks by Disability Age 5 to 17
In terms of disability age 5 to 17, the demographic groups most similar to Greeks are Lebanese (5.6%, a difference of 0.040%), Immigrants from Scotland (5.6%, a difference of 0.070%), Immigrants from Burma/Myanmar (5.6%, a difference of 0.070%), Immigrants from Southern Europe (5.6%, a difference of 0.18%), and Iraqi (5.6%, a difference of 0.23%).
| Demographics | Rating | Rank | Disability Age 5 to 17 |
| Immigrants | Zimbabwe | 75.3 /100 | #159 | Good 5.5% |
| South Africans | 73.3 /100 | #160 | Good 5.5% |
| Immigrants | Saudi Arabia | 69.1 /100 | #161 | Good 5.5% |
| Zimbabweans | 67.2 /100 | #162 | Good 5.5% |
| Immigrants | Southern Europe | 64.0 /100 | #163 | Good 5.6% |
| Immigrants | Scotland | 61.9 /100 | #164 | Good 5.6% |
| Lebanese | 61.4 /100 | #165 | Good 5.6% |
| Greeks | 60.6 /100 | #166 | Good 5.6% |
| Immigrants | Burma/Myanmar | 59.3 /100 | #167 | Average 5.6% |
| Iraqis | 56.0 /100 | #168 | Average 5.6% |
| Immigrants | Norway | 55.7 /100 | #169 | Average 5.6% |
| Serbians | 54.0 /100 | #170 | Average 5.6% |
| Immigrants | Iraq | 53.9 /100 | #171 | Average 5.6% |
| Ukrainians | 51.5 /100 | #172 | Average 5.6% |
| Uruguayans | 51.0 /100 | #173 | Average 5.6% |
Demographics Similar to Nigerians by Disability Age 5 to 17
In terms of disability age 5 to 17, the demographic groups most similar to Nigerians are Czech (5.8%, a difference of 0.030%), Immigrants from Sierra Leone (5.8%, a difference of 0.080%), Swedish (5.8%, a difference of 0.090%), Sierra Leonean (5.8%, a difference of 0.090%), and Belgian (5.8%, a difference of 0.10%).
| Demographics | Rating | Rank | Disability Age 5 to 17 |
| Immigrants | Uganda | 9.7 /100 | #209 | Tragic 5.8% |
| Immigrants | Haiti | 9.5 /100 | #210 | Tragic 5.8% |
| Yugoslavians | 9.1 /100 | #211 | Tragic 5.8% |
| Immigrants | Panama | 8.7 /100 | #212 | Tragic 5.8% |
| Immigrants | Cameroon | 8.3 /100 | #213 | Tragic 5.8% |
| Immigrants | Morocco | 8.3 /100 | #214 | Tragic 5.8% |
| Swedes | 8.1 /100 | #215 | Tragic 5.8% |
| Nigerians | 7.5 /100 | #216 | Tragic 5.8% |
| Czechs | 7.4 /100 | #217 | Tragic 5.8% |
| Immigrants | Sierra Leone | 7.1 /100 | #218 | Tragic 5.8% |
| Sierra Leoneans | 7.0 /100 | #219 | Tragic 5.8% |
| Belgians | 6.9 /100 | #220 | Tragic 5.8% |
| Lithuanians | 6.7 /100 | #221 | Tragic 5.8% |
| Immigrants | Sudan | 6.7 /100 | #222 | Tragic 5.8% |
| Alsatians | 6.0 /100 | #223 | Tragic 5.8% |