Greek Disability
COMPARE
Greek
Select to Compare
Disability
Greek Disability
11.7%
DISABILITY
46.2/ 100
METRIC RATING
178th/ 347
METRIC RANK
Greek Disability Correlation Chart
The statistical analysis conducted on geographies consisting of 482,714,083 people shows a moderate positive correlation between the proportion of Greeks and percentage of population with a disability in the United States with a correlation coefficient (R) of 0.454 and weighted average of 11.7%. On average, for every 1% (one percent) increase in Greeks within a typical geography, there is an increase of 0.38% in percentage of population with a disability.
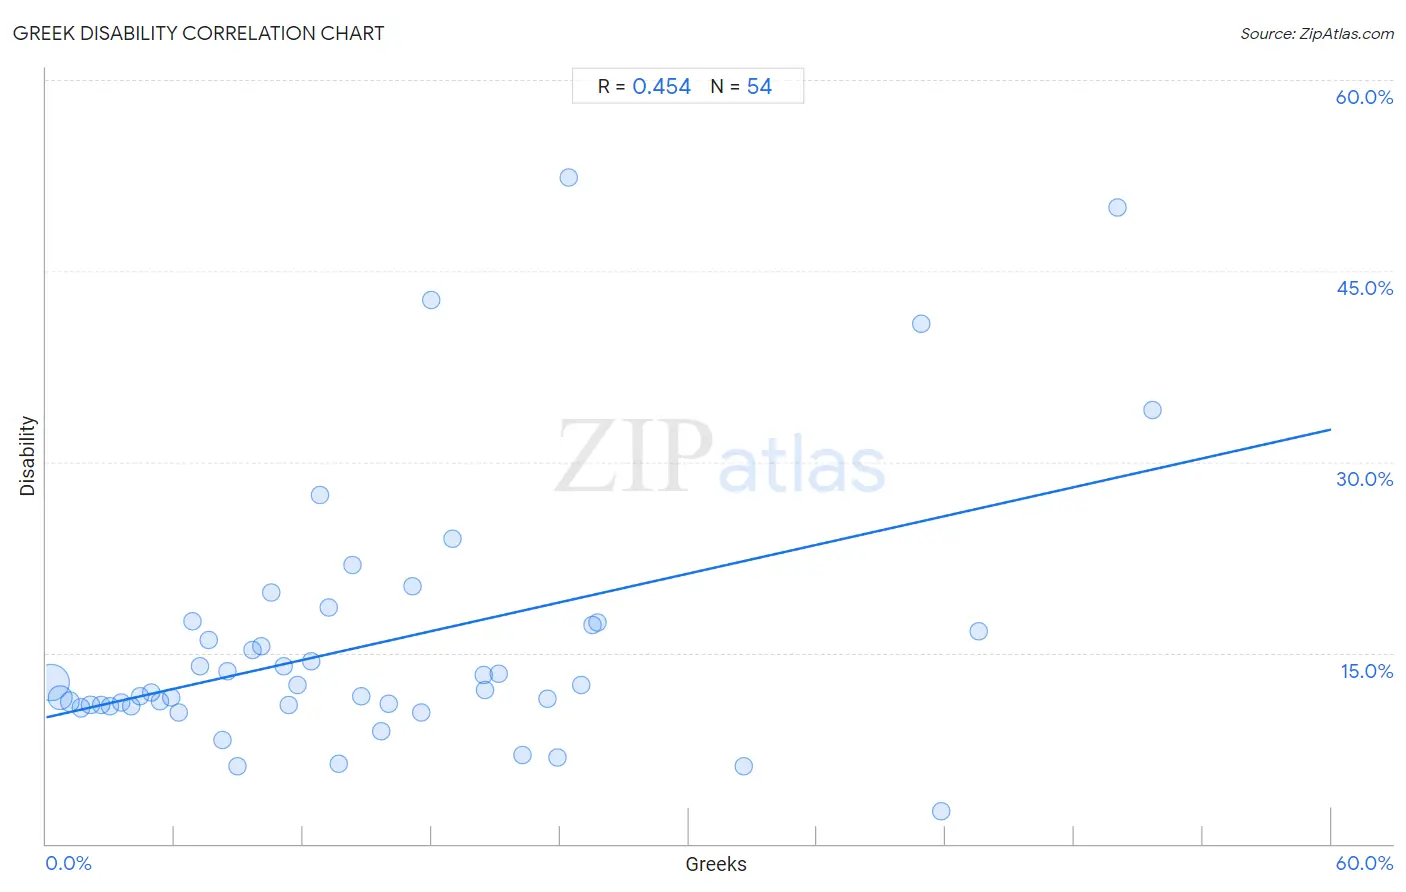
It is essential to understand that the correlation between the percentage of Greeks and percentage of population with a disability does not imply a direct cause-and-effect relationship. It remains uncertain whether the presence of Greeks influences an upward or downward trend in the level of percentage of population with a disability within an area, or if Greeks simply ended up residing in those areas with higher or lower levels of percentage of population with a disability due to other factors.
Demographics Similar to Greeks by Disability
In terms of disability, the demographic groups most similar to Greeks are Immigrants from Central America (11.7%, a difference of 0.020%), Immigrants from Western Africa (11.7%, a difference of 0.060%), Haitian (11.7%, a difference of 0.11%), Albanian (11.7%, a difference of 0.17%), and Immigrants from Armenia (11.7%, a difference of 0.19%).
| Demographics | Rating | Rank | Disability |
| Immigrants from Southern Europe | 52.8 /100 | #171 | Average 11.7% |
| Trinidadians and Tobagonians | 52.7 /100 | #172 | Average 11.7% |
| Maltese | 50.6 /100 | #173 | Average 11.7% |
| Albanians | 50.0 /100 | #174 | Average 11.7% |
| Haitians | 48.6 /100 | #175 | Average 11.7% |
| Immigrants from Western Africa | 47.5 /100 | #176 | Average 11.7% |
| Immigrants from Central America | 46.6 /100 | #177 | Average 11.7% |
| Greeks | 46.2 /100 | #178 | Average 11.7% |
| Immigrants from Armenia | 41.9 /100 | #179 | Average 11.7% |
| Immigrants from Honduras | 37.8 /100 | #180 | Fair 11.8% |
| Immigrants from Oceania | 34.3 /100 | #181 | Fair 11.8% |
| Icelanders | 34.0 /100 | #182 | Fair 11.8% |
| Hondurans | 31.2 /100 | #183 | Fair 11.8% |
| Iraqis | 30.0 /100 | #184 | Fair 11.8% |
| Immigrants from Burma/Myanmar | 28.5 /100 | #185 | Fair 11.8% |
Greek Disability Correlation Summary
| Measurement | Greek Data | Disability Data |
| Minimum | 0.21% | 2.5% |
| Maximum | 51.6% | 52.3% |
| Range | 51.4% | 49.8% |
| Mean | 15.4% | 15.7% |
| Median | 12.6% | 12.2% |
| Interquartile 25% (IQ1) | 6.2% | 10.9% |
| Interquartile 75% (IQ3) | 21.2% | 17.2% |
| Interquartile Range (IQR) | 15.0% | 6.3% |
| Standard Deviation (Sample) | 12.5% | 10.4% |
| Standard Deviation (Population) | 12.4% | 10.3% |
Correlation Details
| Greek Percentile | Sample Size | Disability |
[ 0.0% - 0.5% ] 0.21% | 330,065,429 | 12.7% |
[ 0.5% - 1.0% ] 0.65% | 103,176,254 | 11.4% |
[ 1.0% - 1.5% ] 1.11% | 27,152,678 | 11.2% |
[ 1.5% - 2.0% ] 1.61% | 11,029,533 | 10.7% |
[ 2.0% - 2.5% ] 2.06% | 4,394,762 | 10.9% |
[ 2.5% - 3.0% ] 2.55% | 2,864,673 | 10.9% |
[ 2.5% - 3.0% ] 3.00% | 1,536,366 | 10.8% |
[ 3.0% - 3.5% ] 3.50% | 788,946 | 11.1% |
[ 3.5% - 4.0% ] 3.95% | 350,647 | 10.8% |
[ 4.0% - 4.5% ] 4.40% | 504,599 | 11.6% |
[ 4.5% - 5.0% ] 4.91% | 154,577 | 11.9% |
[ 5.0% - 5.5% ] 5.29% | 165,642 | 11.2% |
[ 5.5% - 6.0% ] 5.82% | 133,471 | 11.5% |
[ 6.0% - 6.5% ] 6.20% | 103,717 | 10.3% |
[ 6.5% - 7.0% ] 6.80% | 60,642 | 17.5% |
[ 7.0% - 7.5% ] 7.17% | 86,850 | 14.0% |
[ 7.5% - 8.0% ] 7.60% | 31,375 | 16.0% |
[ 8.0% - 8.5% ] 8.24% | 3,848 | 8.1% |
[ 8.0% - 8.5% ] 8.49% | 2,416 | 13.5% |
[ 8.5% - 9.0% ] 8.96% | 1,686 | 6.0% |
[ 9.5% - 10.0% ] 9.63% | 8,433 | 15.2% |
[ 10.0% - 10.5% ] 10.01% | 7,410 | 15.5% |
[ 10.5% - 11.0% ] 10.50% | 1,019 | 19.7% |
[ 11.0% - 11.5% ] 11.10% | 13,147 | 13.9% |
[ 11.0% - 11.5% ] 11.31% | 50,577 | 10.9% |
[ 11.5% - 12.0% ] 11.72% | 2,612 | 12.4% |
[ 12.0% - 12.5% ] 12.35% | 2,833 | 14.3% |
[ 12.5% - 13.0% ] 12.79% | 1,267 | 27.4% |
[ 13.0% - 13.5% ] 13.17% | 463 | 18.6% |
[ 13.5% - 14.0% ] 13.68% | 665 | 6.3% |
[ 14.0% - 14.5% ] 14.29% | 525 | 21.9% |
[ 14.5% - 15.0% ] 14.71% | 3,773 | 11.6% |
[ 15.5% - 16.0% ] 15.61% | 4,374 | 8.8% |
[ 16.0% - 16.5% ] 16.01% | 1,443 | 10.9% |
[ 17.0% - 17.5% ] 17.07% | 943 | 20.3% |
[ 17.5% - 18.0% ] 17.53% | 753 | 10.4% |
[ 17.5% - 18.0% ] 17.95% | 234 | 42.7% |
[ 18.5% - 19.0% ] 18.95% | 438 | 24.0% |
[ 20.0% - 20.5% ] 20.43% | 421 | 13.3% |
[ 20.0% - 20.5% ] 20.48% | 83 | 12.0% |
[ 21.0% - 21.5% ] 21.15% | 2,151 | 13.4% |
[ 22.0% - 22.5% ] 22.22% | 72 | 6.9% |
[ 23.0% - 23.5% ] 23.43% | 700 | 11.4% |
[ 23.5% - 24.0% ] 23.86% | 88 | 6.8% |
[ 24.0% - 24.5% ] 24.42% | 86 | 52.3% |
[ 25.0% - 25.5% ] 25.00% | 8 | 12.5% |
[ 25.5% - 26.0% ] 25.51% | 396 | 17.2% |
[ 25.5% - 26.0% ] 25.77% | 392 | 17.3% |
[ 32.5% - 33.0% ] 32.59% | 313 | 6.1% |
[ 40.5% - 41.0% ] 40.85% | 71 | 40.8% |
[ 41.5% - 42.0% ] 41.77% | 79 | 2.5% |
[ 43.5% - 44.0% ] 43.52% | 108 | 16.7% |
[ 50.0% - 50.5% ] 50.00% | 4 | 50.0% |
[ 51.5% - 52.0% ] 51.65% | 91 | 34.1% |