Greek vs Alaskan Athabascan Disability Age 5 to 17
COMPARE
Greek
Alaskan Athabascan
Disability Age 5 to 17
Disability Age 5 to 17 Comparison
Greeks
Alaskan Athabascans
5.6%
DISABILITY AGE 5 TO 17
60.6/ 100
METRIC RATING
166th/ 347
METRIC RANK
6.3%
DISABILITY AGE 5 TO 17
0.0/ 100
METRIC RATING
310th/ 347
METRIC RANK
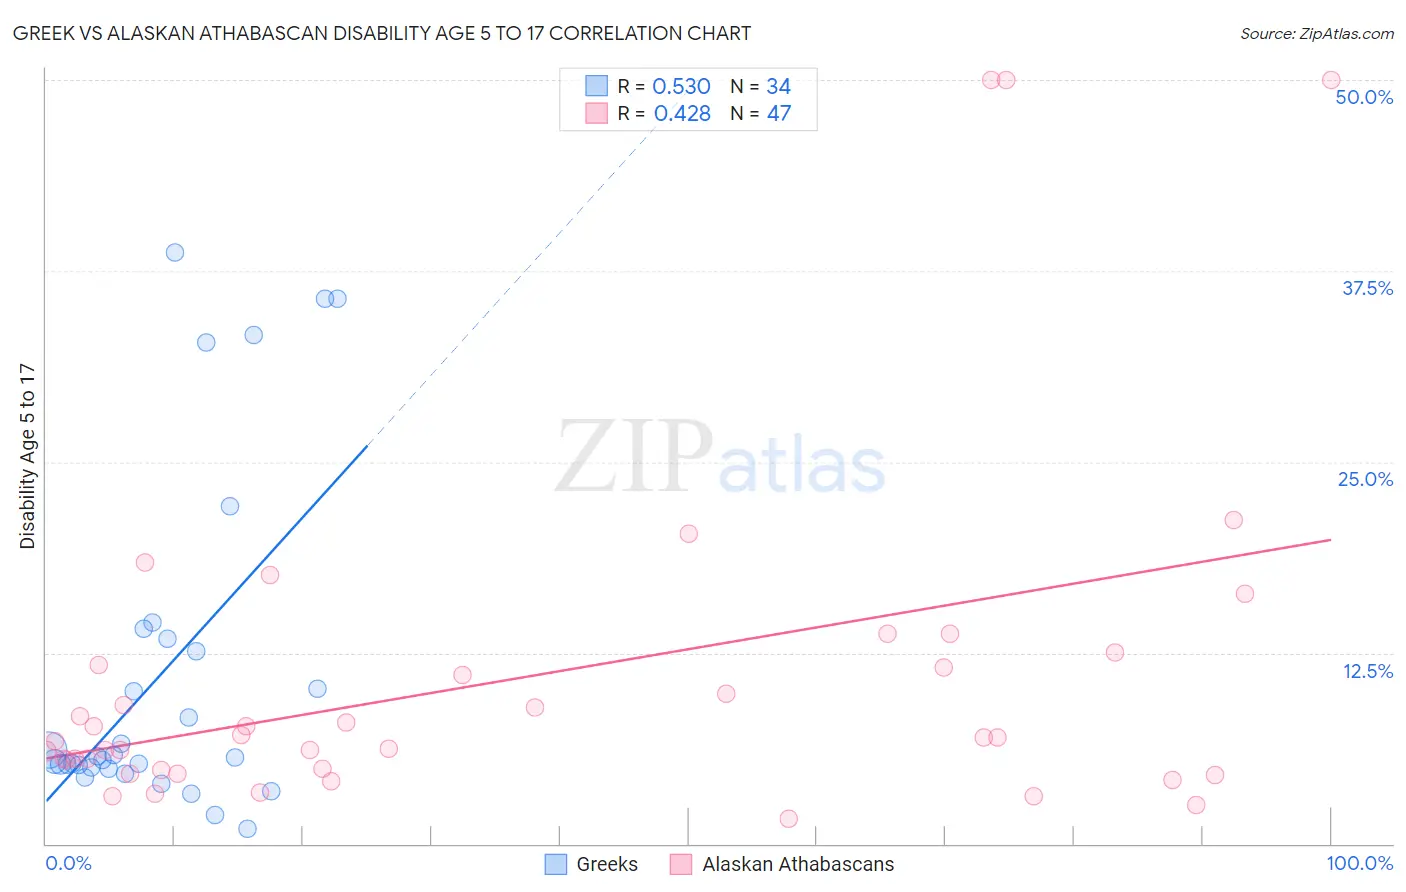
Greek vs Alaskan Athabascan Disability Age 5 to 17 Correlation Chart
The statistical analysis conducted on geographies consisting of 476,363,974 people shows a substantial positive correlation between the proportion of Greeks and percentage of population with a disability between the ages 5 and 17 in the United States with a correlation coefficient (R) of 0.530 and weighted average of 5.6%. Similarly, the statistical analysis conducted on geographies consisting of 45,771,406 people shows a moderate positive correlation between the proportion of Alaskan Athabascans and percentage of population with a disability between the ages 5 and 17 in the United States with a correlation coefficient (R) of 0.428 and weighted average of 6.3%, a difference of 13.9%.
Disability Age 5 to 17 Correlation Summary
| Measurement | Greek | Alaskan Athabascan |
| Minimum | 0.96% | 1.7% |
| Maximum | 38.7% | 50.0% |
| Range | 37.7% | 48.3% |
| Mean | 11.2% | 10.8% |
| Median | 5.7% | 7.0% |
| Interquartile 25% (IQ1) | 5.0% | 4.8% |
| Interquartile 75% (IQ3) | 13.4% | 11.7% |
| Interquartile Range (IQR) | 8.5% | 6.9% |
| Standard Deviation (Sample) | 11.0% | 11.4% |
| Standard Deviation (Population) | 10.8% | 11.2% |
Similar Demographics by Disability Age 5 to 17
Demographics Similar to Greeks by Disability Age 5 to 17
In terms of disability age 5 to 17, the demographic groups most similar to Greeks are Lebanese (5.6%, a difference of 0.040%), Immigrants from Scotland (5.6%, a difference of 0.070%), Immigrants from Burma/Myanmar (5.6%, a difference of 0.070%), Immigrants from Southern Europe (5.6%, a difference of 0.18%), and Iraqi (5.6%, a difference of 0.23%).
| Demographics | Rating | Rank | Disability Age 5 to 17 |
| Immigrants | Zimbabwe | 75.3 /100 | #159 | Good 5.5% |
| South Africans | 73.3 /100 | #160 | Good 5.5% |
| Immigrants | Saudi Arabia | 69.1 /100 | #161 | Good 5.5% |
| Zimbabweans | 67.2 /100 | #162 | Good 5.5% |
| Immigrants | Southern Europe | 64.0 /100 | #163 | Good 5.6% |
| Immigrants | Scotland | 61.9 /100 | #164 | Good 5.6% |
| Lebanese | 61.4 /100 | #165 | Good 5.6% |
| Greeks | 60.6 /100 | #166 | Good 5.6% |
| Immigrants | Burma/Myanmar | 59.3 /100 | #167 | Average 5.6% |
| Iraqis | 56.0 /100 | #168 | Average 5.6% |
| Immigrants | Norway | 55.7 /100 | #169 | Average 5.6% |
| Serbians | 54.0 /100 | #170 | Average 5.6% |
| Immigrants | Iraq | 53.9 /100 | #171 | Average 5.6% |
| Ukrainians | 51.5 /100 | #172 | Average 5.6% |
| Uruguayans | 51.0 /100 | #173 | Average 5.6% |
Demographics Similar to Alaskan Athabascans by Disability Age 5 to 17
In terms of disability age 5 to 17, the demographic groups most similar to Alaskan Athabascans are Immigrants from Dominica (6.3%, a difference of 0.040%), Hmong (6.3%, a difference of 0.13%), Scotch-Irish (6.3%, a difference of 0.16%), Bermudan (6.4%, a difference of 0.16%), and Bahamian (6.3%, a difference of 0.39%).
| Demographics | Rating | Rank | Disability Age 5 to 17 |
| Yakama | 0.0 /100 | #303 | Tragic 6.3% |
| Senegalese | 0.0 /100 | #304 | Tragic 6.3% |
| Natives/Alaskans | 0.0 /100 | #305 | Tragic 6.3% |
| Immigrants | Nonimmigrants | 0.0 /100 | #306 | Tragic 6.3% |
| Bahamians | 0.0 /100 | #307 | Tragic 6.3% |
| Scotch-Irish | 0.0 /100 | #308 | Tragic 6.3% |
| Hmong | 0.0 /100 | #309 | Tragic 6.3% |
| Alaskan Athabascans | 0.0 /100 | #310 | Tragic 6.3% |
| Immigrants | Dominica | 0.0 /100 | #311 | Tragic 6.3% |
| Bermudans | 0.0 /100 | #312 | Tragic 6.4% |
| Apache | 0.0 /100 | #313 | Tragic 6.4% |
| French | 0.0 /100 | #314 | Tragic 6.4% |
| Immigrants | Portugal | 0.0 /100 | #315 | Tragic 6.4% |
| Immigrants | Dominican Republic | 0.0 /100 | #316 | Tragic 6.4% |
| Kiowa | 0.0 /100 | #317 | Tragic 6.4% |