Greek vs Immigrants from Honduras Disability Age 5 to 17
COMPARE
Greek
Immigrants from Honduras
Disability Age 5 to 17
Disability Age 5 to 17 Comparison
Greeks
Immigrants from Honduras
5.6%
DISABILITY AGE 5 TO 17
60.6/ 100
METRIC RATING
166th/ 347
METRIC RANK
5.9%
DISABILITY AGE 5 TO 17
1.8/ 100
METRIC RATING
247th/ 347
METRIC RANK
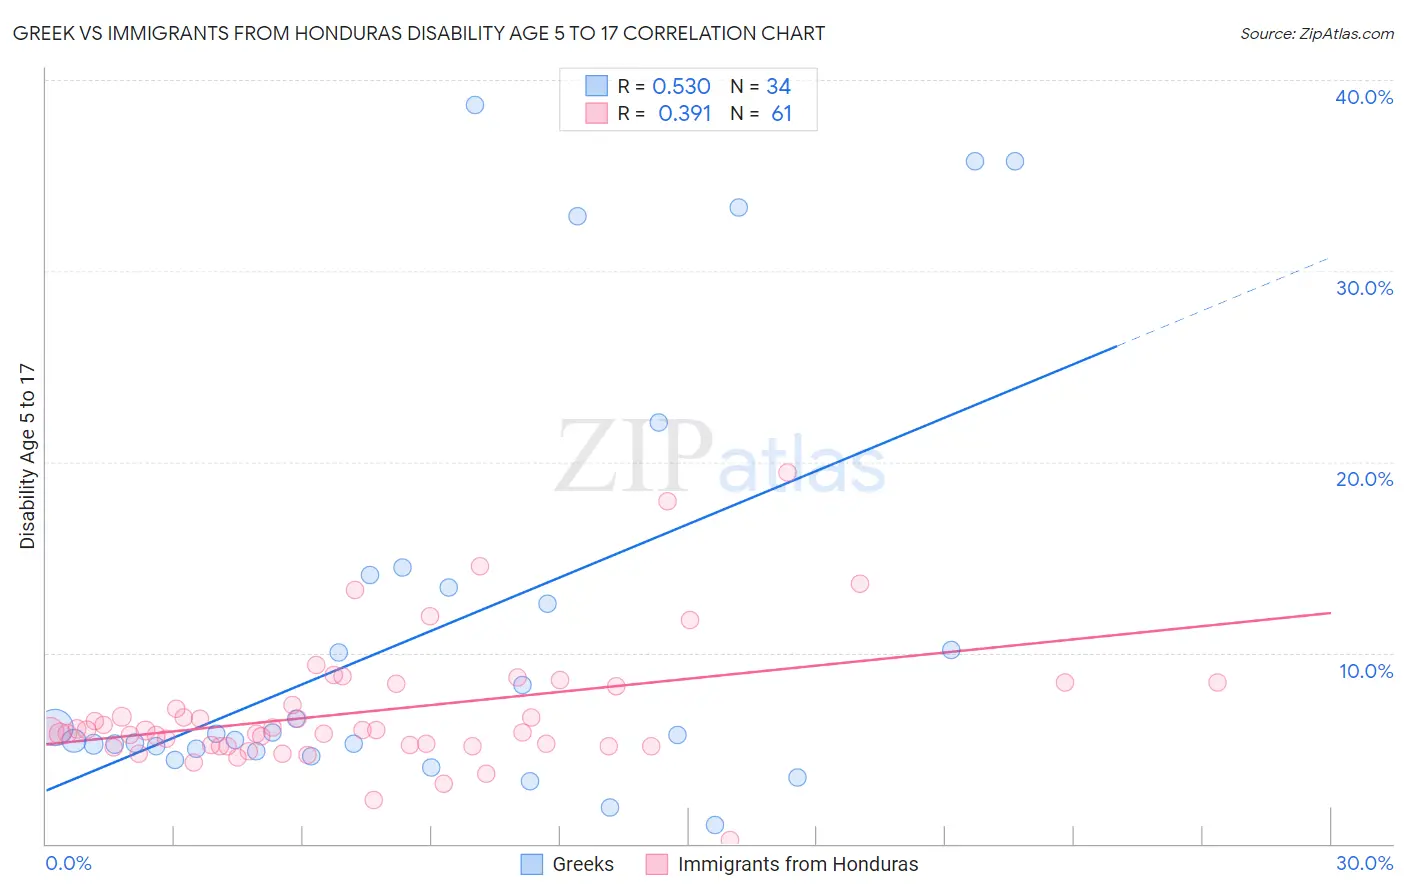
Greek vs Immigrants from Honduras Disability Age 5 to 17 Correlation Chart
The statistical analysis conducted on geographies consisting of 476,363,974 people shows a substantial positive correlation between the proportion of Greeks and percentage of population with a disability between the ages 5 and 17 in the United States with a correlation coefficient (R) of 0.530 and weighted average of 5.6%. Similarly, the statistical analysis conducted on geographies consisting of 321,075,572 people shows a mild positive correlation between the proportion of Immigrants from Honduras and percentage of population with a disability between the ages 5 and 17 in the United States with a correlation coefficient (R) of 0.391 and weighted average of 5.9%, a difference of 5.5%.
Disability Age 5 to 17 Correlation Summary
| Measurement | Greek | Immigrants from Honduras |
| Minimum | 0.96% | 0.17% |
| Maximum | 38.7% | 19.4% |
| Range | 37.7% | 19.3% |
| Mean | 11.2% | 6.9% |
| Median | 5.7% | 5.9% |
| Interquartile 25% (IQ1) | 5.0% | 5.1% |
| Interquartile 75% (IQ3) | 13.4% | 8.3% |
| Interquartile Range (IQR) | 8.5% | 3.2% |
| Standard Deviation (Sample) | 11.0% | 3.4% |
| Standard Deviation (Population) | 10.8% | 3.3% |
Similar Demographics by Disability Age 5 to 17
Demographics Similar to Greeks by Disability Age 5 to 17
In terms of disability age 5 to 17, the demographic groups most similar to Greeks are Lebanese (5.6%, a difference of 0.040%), Immigrants from Scotland (5.6%, a difference of 0.070%), Immigrants from Burma/Myanmar (5.6%, a difference of 0.070%), Immigrants from Southern Europe (5.6%, a difference of 0.18%), and Iraqi (5.6%, a difference of 0.23%).
| Demographics | Rating | Rank | Disability Age 5 to 17 |
| Immigrants | Zimbabwe | 75.3 /100 | #159 | Good 5.5% |
| South Africans | 73.3 /100 | #160 | Good 5.5% |
| Immigrants | Saudi Arabia | 69.1 /100 | #161 | Good 5.5% |
| Zimbabweans | 67.2 /100 | #162 | Good 5.5% |
| Immigrants | Southern Europe | 64.0 /100 | #163 | Good 5.6% |
| Immigrants | Scotland | 61.9 /100 | #164 | Good 5.6% |
| Lebanese | 61.4 /100 | #165 | Good 5.6% |
| Greeks | 60.6 /100 | #166 | Good 5.6% |
| Immigrants | Burma/Myanmar | 59.3 /100 | #167 | Average 5.6% |
| Iraqis | 56.0 /100 | #168 | Average 5.6% |
| Immigrants | Norway | 55.7 /100 | #169 | Average 5.6% |
| Serbians | 54.0 /100 | #170 | Average 5.6% |
| Immigrants | Iraq | 53.9 /100 | #171 | Average 5.6% |
| Ukrainians | 51.5 /100 | #172 | Average 5.6% |
| Uruguayans | 51.0 /100 | #173 | Average 5.6% |
Demographics Similar to Immigrants from Honduras by Disability Age 5 to 17
In terms of disability age 5 to 17, the demographic groups most similar to Immigrants from Honduras are Immigrants from Germany (5.9%, a difference of 0.030%), Immigrants from Micronesia (5.9%, a difference of 0.030%), Tlingit-Haida (5.9%, a difference of 0.030%), British (5.9%, a difference of 0.070%), and Indonesian (5.9%, a difference of 0.090%).
| Demographics | Rating | Rank | Disability Age 5 to 17 |
| West Indians | 2.4 /100 | #240 | Tragic 5.9% |
| Immigrants | Caribbean | 2.1 /100 | #241 | Tragic 5.9% |
| Spaniards | 2.0 /100 | #242 | Tragic 5.9% |
| Indonesians | 2.0 /100 | #243 | Tragic 5.9% |
| Immigrants | Germany | 1.9 /100 | #244 | Tragic 5.9% |
| Immigrants | Micronesia | 1.9 /100 | #245 | Tragic 5.9% |
| Tlingit-Haida | 1.9 /100 | #246 | Tragic 5.9% |
| Immigrants | Honduras | 1.8 /100 | #247 | Tragic 5.9% |
| British | 1.7 /100 | #248 | Tragic 5.9% |
| Immigrants | Ghana | 1.7 /100 | #249 | Tragic 5.9% |
| Poles | 1.5 /100 | #250 | Tragic 5.9% |
| Immigrants | Cambodia | 1.5 /100 | #251 | Tragic 5.9% |
| Hondurans | 1.5 /100 | #252 | Tragic 5.9% |
| Scandinavians | 1.4 /100 | #253 | Tragic 5.9% |
| Barbadians | 1.3 /100 | #254 | Tragic 5.9% |