Dutch vs Immigrants from Ireland Disability Age 5 to 17

COMPARE

Dutch
Race
Ancestry
AfghanAfricanAlaska NativeAlaskan AthabascanAlbanianAleutAlsatianAmericanApacheArabArapahoArgentineanArmenianAssyrian/Chaldean/SyriacAustralianAustrianBahamianBangladeshiBarbadianBasqueBelgianBelizeanBermudanBhutaneseBlackfeetBolivianBrazilianBritishBritish West IndianBulgarianBurmeseCajunCambodianCanadianCape VerdeanCarpatho RusynCelticCentral AmericanCentral American IndianCherokeeCheyenneChickasawChileanChineseChippewaChoctawColombianColvilleComancheCosta RicanCreeCreekCroatianCrowCubanCypriotCzechCzechoslovakianDanishDelawareDominicanDutchDutch West IndianEastern EuropeanEcuadorianEgyptianEnglishEstonianEthiopianEuropeanFijianFilipinoFinnishFrenchFrench American IndianFrench CanadianGermanGerman RussianGhanaianGreekGuamanian/ChamorroGuatemalanGuyaneseHaitianHmongHonduranHopiHoumaHungarianIcelanderIndian (Asian)IndonesianInupiatIranianIraqiIrishIroquoisIsraeliItalianJamaicanJapaneseJordanianKenyanKiowaKoreanLaotianLatvianLebaneseLiberianLithuanianLumbeeLuxembourgerMacedonianMalaysianMalteseMarshalleseMenomineeMexicanMexican American IndianMongolianMoroccanNative HawaiianNavajoNepaleseNew ZealanderNicaraguanNigerianNorthern EuropeanNorwegianOkinawanOsageOttawaPaiutePakistaniPalestinianPanamanianParaguayanPennsylvania GermanPeruvianPimaPolishPortuguesePotawatomiPuebloPuerto RicanPuget Sound SalishRomanianRussianSalvadoranSamoanScandinavianScotch-IrishScottishSeminoleSenegaleseSerbianShoshoneSierra LeoneanSiouxSlavicSlovakSloveneSomaliSouth AfricanSouth AmericanSouth American IndianSoviet UnionSpaniardSpanishSpanish AmericanSpanish American IndianSri LankanSubsaharan AfricanSudaneseSwedishSwissSyrianTaiwaneseThaiTlingit-HaidaTohono O'OdhamTonganTrinidadian and TobagonianTsimshianTurkishU.S. Virgin IslanderUgandanUkrainianUruguayanUteVenezuelanVietnameseWelshWest IndianYakamaYaquiYugoslavianYumanYup'ikZimbabwean
Immigration
NonimmigrantsImmigrantsAfghanistanAfricaAlbaniaArgentinaArmeniaAsiaAustraliaAustriaBahamasBangladeshBarbadosBelarusBelgiumBelizeBoliviaBosnia and HerzegovinaBrazilBulgariaBurma/MyanmarCabo VerdeCambodiaCameroonCanadaCaribbeanCentral AmericaChileChinaColombiaCongoCosta RicaCroatiaCubaCzechoslovakiaDenmarkDominicaDominican RepublicEastern AfricaEastern AsiaEastern EuropeEcuadorEgyptEl SalvadorEnglandEritreaEthiopiaEuropeFijiFranceGermanyGhanaGreeceGrenadaGuatemalaGuyanaHaitiHondurasHong KongHungaryIndiaIndonesiaIranIraqIsraelItalyJamaicaJapanJordanKazakhstanKenyaKoreaKuwaitLaosLatin AmericaLatviaLebanonLiberiaLithuaniaMalaysiaMexicoMicronesiaMiddle AfricaMoldovaMoroccoNepalNetherlandsNicaraguaNigeriaNorth AmericaNorth MacedoniaNorthern AfricaNorthern EuropeNorwayOceaniaPakistanPanamaPeruPhilippinesPolandPortugalRomaniaRussiaSaudi ArabiaScotlandSenegalSerbiaSierra LeoneSingaporeSomaliaSouth AfricaSouth AmericaSouth Central AsiaSouth Eastern AsiaSouthern EuropeSpainSri LankaSt. Vincent and the GrenadinesSudanSwedenSwitzerlandSyriaTaiwanThailandTrinidad and TobagoTurkeyUgandaUkraineUruguayUzbekistanVenezuelaVietnamWest IndiesWestern AfricaWestern AsiaWestern EuropeYemenZaireZimbabweAzores
Immigrants from Ireland
Race
Ancestry
AfghanAfricanAlaska NativeAlaskan AthabascanAlbanianAleutAlsatianAmericanApacheArabArapahoArgentineanArmenianAssyrian/Chaldean/SyriacAustralianAustrianBahamianBangladeshiBarbadianBasqueBelgianBelizeanBermudanBhutaneseBlackfeetBolivianBrazilianBritishBritish West IndianBulgarianBurmeseCajunCambodianCanadianCape VerdeanCarpatho RusynCelticCentral AmericanCentral American IndianCherokeeCheyenneChickasawChileanChineseChippewaChoctawColombianColvilleComancheCosta RicanCreeCreekCroatianCrowCubanCypriotCzechCzechoslovakianDanishDelawareDominicanDutch West IndianEastern EuropeanEcuadorianEgyptianEnglishEstonianEthiopianEuropeanFijianFilipinoFinnishFrenchFrench American IndianFrench CanadianGermanGerman RussianGhanaianGreekGuamanian/ChamorroGuatemalanGuyaneseHaitianHmongHonduranHopiHoumaHungarianIcelanderIndian (Asian)IndonesianInupiatIranianIraqiIrishIroquoisIsraeliItalianJamaicanJapaneseJordanianKenyanKiowaKoreanLaotianLatvianLebaneseLiberianLithuanianLumbeeLuxembourgerMacedonianMalaysianMalteseMarshalleseMenomineeMexicanMexican American IndianMongolianMoroccanNative HawaiianNavajoNepaleseNew ZealanderNicaraguanNigerianNorthern EuropeanNorwegianOkinawanOsageOttawaPaiutePakistaniPalestinianPanamanianParaguayanPennsylvania GermanPeruvianPimaPolishPortuguesePotawatomiPuebloPuerto RicanPuget Sound SalishRomanianRussianSalvadoranSamoanScandinavianScotch-IrishScottishSeminoleSenegaleseSerbianShoshoneSierra LeoneanSiouxSlavicSlovakSloveneSomaliSouth AfricanSouth AmericanSouth American IndianSoviet UnionSpaniardSpanishSpanish AmericanSpanish American IndianSri LankanSubsaharan AfricanSudaneseSwedishSwissSyrianTaiwaneseThaiTlingit-HaidaTohono O'OdhamTonganTrinidadian and TobagonianTsimshianTurkishU.S. Virgin IslanderUgandanUkrainianUruguayanUteVenezuelanVietnameseWelshWest IndianYakamaYaquiYugoslavianYumanYup'ikZimbabwean
Immigration
NonimmigrantsImmigrantsAfghanistanAfricaAlbaniaArgentinaArmeniaAsiaAustraliaAustriaBahamasBangladeshBarbadosBelarusBelgiumBelizeBoliviaBosnia and HerzegovinaBrazilBulgariaBurma/MyanmarCabo VerdeCambodiaCameroonCanadaCaribbeanCentral AmericaChileChinaColombiaCongoCosta RicaCroatiaCubaCzechoslovakiaDenmarkDominicaDominican RepublicEastern AfricaEastern AsiaEastern EuropeEcuadorEgyptEl SalvadorEnglandEritreaEthiopiaEuropeFijiFranceGermanyGhanaGreeceGrenadaGuatemalaGuyanaHaitiHondurasHong KongHungaryIndiaIndonesiaIranIraqIrelandIsraelItalyJamaicaJapanJordanKazakhstanKenyaKoreaKuwaitLaosLatin AmericaLatviaLebanonLiberiaLithuaniaMalaysiaMexicoMicronesiaMiddle AfricaMoldovaMoroccoNepalNetherlandsNicaraguaNigeriaNorth AmericaNorth MacedoniaNorthern AfricaNorthern EuropeNorwayOceaniaPakistanPanamaPeruPhilippinesPolandPortugalRomaniaRussiaSaudi ArabiaScotlandSenegalSerbiaSierra LeoneSingaporeSomaliaSouth AfricaSouth AmericaSouth Central AsiaSouth Eastern AsiaSouthern EuropeSpainSri LankaSt. Vincent and the GrenadinesSudanSwedenSwitzerlandSyriaTaiwanThailandTrinidad and TobagoTurkeyUgandaUkraineUruguayUzbekistanVenezuelaVietnamWest IndiesWestern AfricaWestern AsiaWestern EuropeYemenZaireZimbabweAzores
Disability Age 5 to 17
Income
Poverty
Unemployment
Labor Participation
Family Structure
Vehicle Availability
Education Level
Disability

Disability Age 5 to 17 Comparison

Dutch

Immigrants from Ireland

Tragic
Exceptional
6.0%
DISABILITY AGE 5 TO 17
0.2/ 100
METRIC RATING
275th/ 347
METRIC RANK
5.2%
DISABILITY AGE 5 TO 17
99.8/ 100
METRIC RATING
62nd/ 347
METRIC RANK

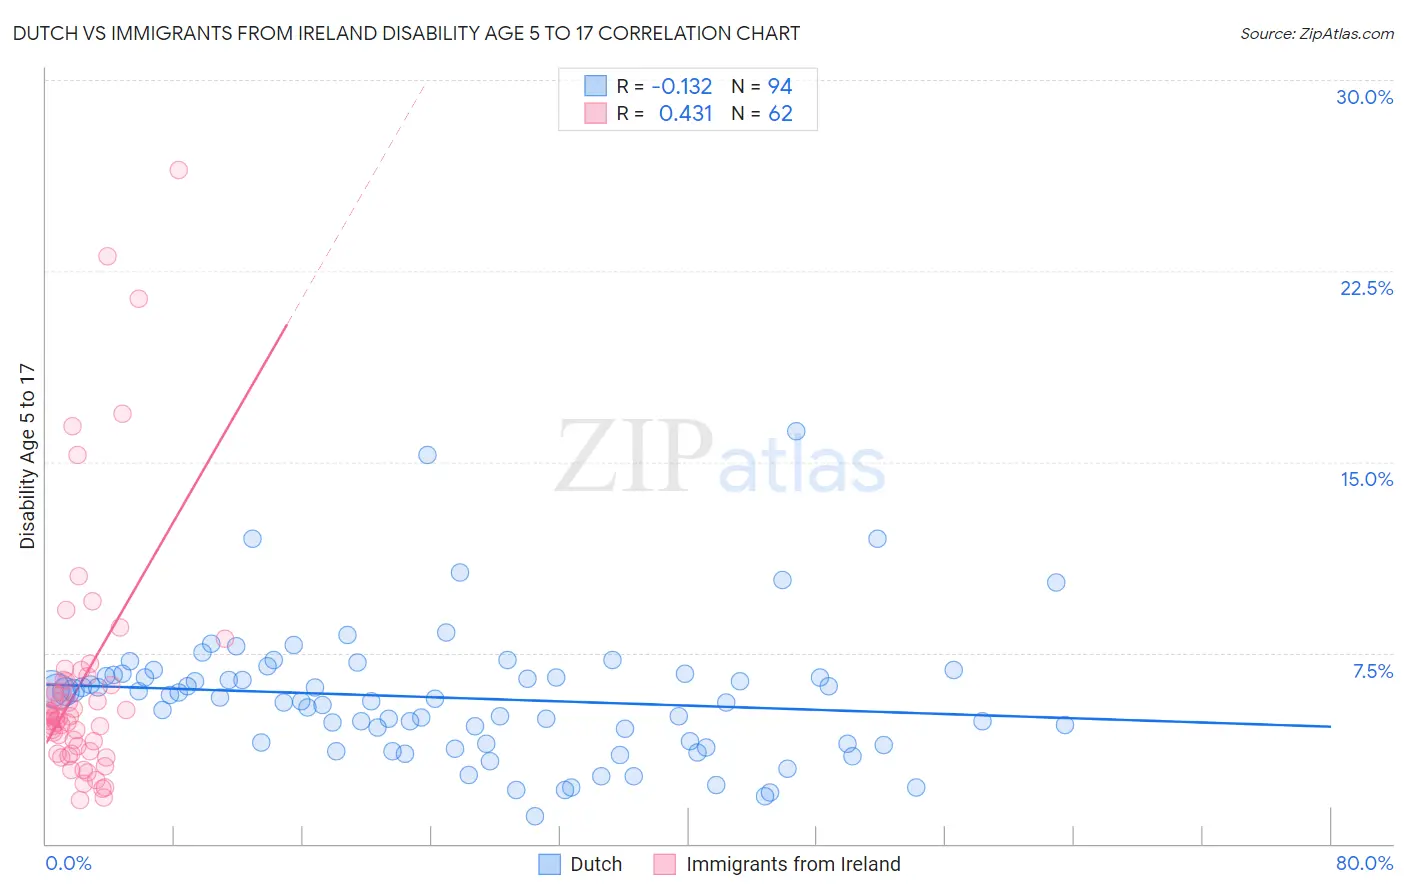
Dutch vs Immigrants from Ireland Disability Age 5 to 17 Correlation Chart

The statistical analysis conducted on geographies consisting of 542,324,990 people shows a poor negative correlation between the proportion of Dutch and percentage of population with a disability between the ages 5 and 17 in the United States with a correlation coefficient (R) of -0.132 and weighted average of 6.0%. Similarly, the statistical analysis conducted on geographies consisting of 239,046,676 people shows a moderate positive correlation between the proportion of Immigrants from Ireland and percentage of population with a disability between the ages 5 and 17 in the United States with a correlation coefficient (R) of 0.431 and weighted average of 5.2%, a difference of 17.0%.
Dutch vs Immigrants from Ireland Disability Age 5 to 17

Disability Age 5 to 17 Correlation Summary

MeasurementDutchImmigrants from Ireland
Minimum1.1%1.7%
Maximum16.2%26.5%
Range15.1%24.8%
Mean5.7%6.4%
Median5.7%5.0%
Interquartile 25% (IQ1)3.9%3.6%
Interquartile 75% (IQ3)6.6%6.4%
Interquartile Range (IQR)2.7%2.8%
Standard Deviation (Sample)2.6%5.0%
Standard Deviation (Population)2.6%4.9%

Similar Demographics by Disability Age 5 to 17

Demographics Similar to Dutch by Disability Age 5 to 17

In terms of disability age 5 to 17, the demographic groups most similar to Dutch are Cheyenne (6.0%, a difference of 0.11%), Japanese (6.1%, a difference of 0.11%), Alaska Native (6.0%, a difference of 0.22%), Finnish (6.0%, a difference of 0.27%), and Immigrants from Zaire (6.0%, a difference of 0.30%).
DemographicsRating | RankDisability Age 5 to 17
Sioux
0.4
/100
|
#268
Tragic
6.0%
Liberians
0.4
/100
|
#269
Tragic
6.0%
Immigrants | Somalia
0.4
/100
|
#270
Tragic
6.0%
Immigrants | Zaire
0.2
/100
|
#271
Tragic
6.0%
Finns
0.2
/100
|
#272
Tragic
6.0%
Alaska Natives
0.2
/100
|
#273
Tragic
6.0%
Cheyenne
0.2
/100
|
#274
Tragic
6.0%
Dutch
0.2
/100
|
#275
Tragic
6.0%
Japanese
0.1
/100
|
#276
Tragic
6.1%
Puget Sound Salish
0.1
/100
|
#277
Tragic
6.1%
Immigrants | Liberia
0.1
/100
|
#278
Tragic
6.1%
Immigrants | Jamaica
0.1
/100
|
#279
Tragic
6.1%
Portuguese
0.1
/100
|
#280
Tragic
6.1%
Scottish
0.0
/100
|
#281
Tragic
6.1%
Germans
0.0
/100
|
#282
Tragic
6.1%

Demographics Similar to Immigrants from Ireland by Disability Age 5 to 17

In terms of disability age 5 to 17, the demographic groups most similar to Immigrants from Ireland are Immigrants from Switzerland (5.2%, a difference of 0.090%), Immigrants from Bangladesh (5.2%, a difference of 0.11%), Immigrants from South Eastern Asia (5.2%, a difference of 0.14%), Immigrants from Greece (5.2%, a difference of 0.15%), and Palestinian (5.2%, a difference of 0.19%).
DemographicsRating | RankDisability Age 5 to 17
Laotians
99.9
/100
|
#55
Exceptional
5.1%
Immigrants | Turkey
99.9
/100
|
#56
Exceptional
5.1%
Immigrants | Poland
99.9
/100
|
#57
Exceptional
5.1%
Immigrants | Ukraine
99.9
/100
|
#58
Exceptional
5.1%
Immigrants | North Macedonia
99.9
/100
|
#59
Exceptional
5.1%
Immigrants | Eastern Europe
99.9
/100
|
#60
Exceptional
5.1%
Immigrants | Switzerland
99.8
/100
|
#61
Exceptional
5.2%
Immigrants | Ireland
99.8
/100
|
#62
Exceptional
5.2%
Immigrants | Bangladesh
99.8
/100
|
#63
Exceptional
5.2%
Immigrants | South Eastern Asia
99.8
/100
|
#64
Exceptional
5.2%
Immigrants | Greece
99.8
/100
|
#65
Exceptional
5.2%
Palestinians
99.8
/100
|
#66
Exceptional
5.2%
Macedonians
99.8
/100
|
#67
Exceptional
5.2%
Immigrants | Syria
99.7
/100
|
#68
Exceptional
5.2%
Guyanese
99.7
/100
|
#69
Exceptional
5.2%