Celtic Disability Age Under 5
COMPARE
Celtic
Select to Compare
Disability Age Under 5
Celtic Disability Age Under 5
1.7%
DISABILITY | AGE UNDER 5
0.0/ 100
METRIC RATING
313th/ 347
METRIC RANK
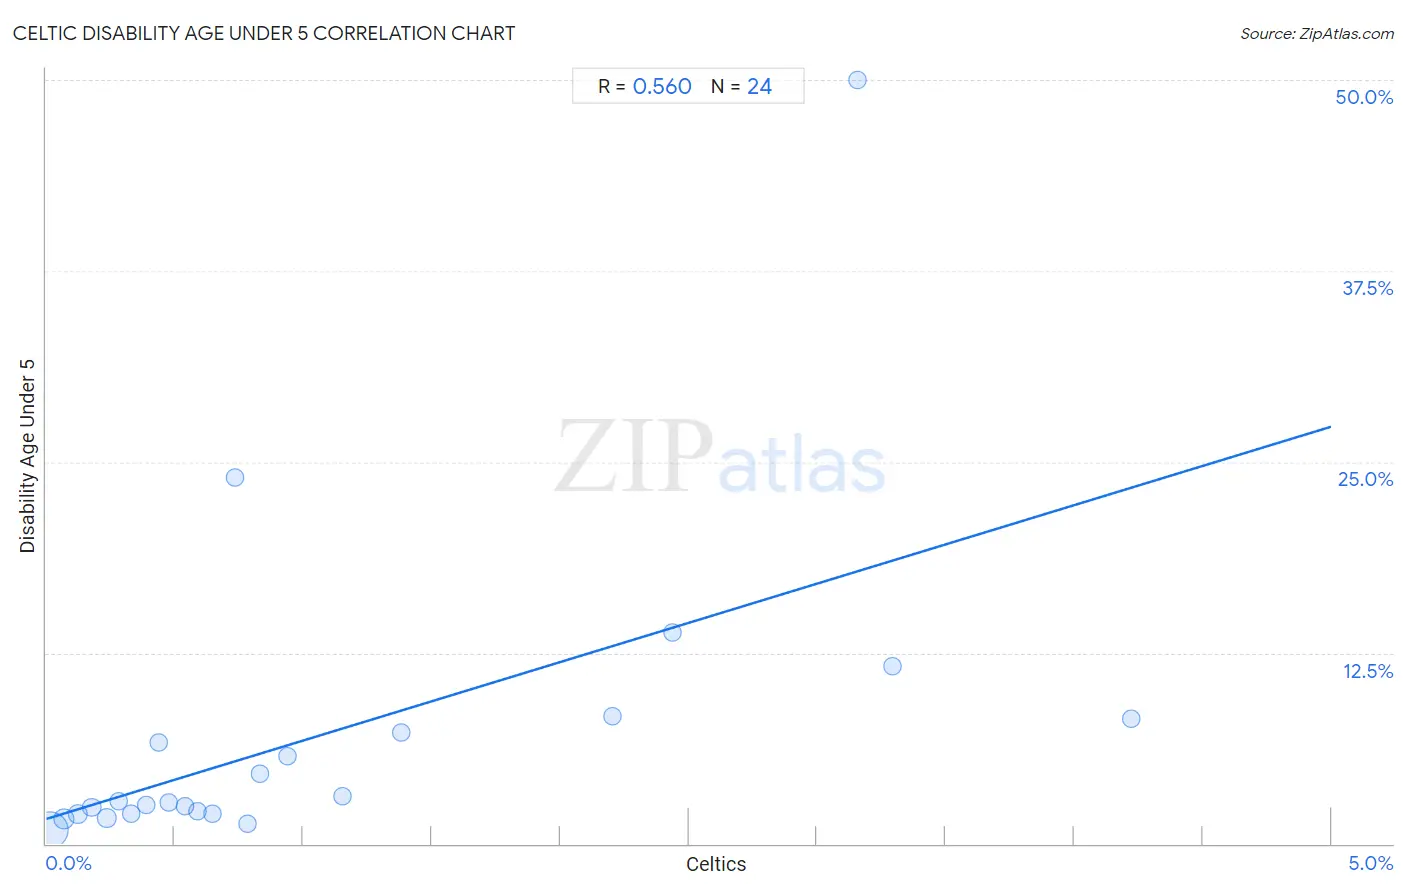
Celtic Disability Age Under 5 Correlation Chart
The statistical analysis conducted on geographies consisting of 116,047,957 people shows a substantial positive correlation between the proportion of Celtics and percentage of population with a disability under the age of 5 in the United States with a correlation coefficient (R) of 0.560 and weighted average of 1.7%. On average, for every 1% (one percent) increase in Celtics within a typical geography, there is an increase of 5.1% in percentage of population with a disability under the age of 5.
It is essential to understand that the correlation between the percentage of Celtics and percentage of population with a disability under the age of 5 does not imply a direct cause-and-effect relationship. It remains uncertain whether the presence of Celtics influences an upward or downward trend in the level of percentage of population with a disability under the age of 5 within an area, or if Celtics simply ended up residing in those areas with higher or lower levels of percentage of population with a disability under the age of 5 due to other factors.
Demographics Similar to Celtics by Disability Age Under 5
In terms of disability age under 5, the demographic groups most similar to Celtics are Puerto Rican (1.7%, a difference of 0.16%), Norwegian (1.7%, a difference of 0.16%), English (1.7%, a difference of 0.20%), Dutch (1.7%, a difference of 0.42%), and Immigrants from Cabo Verde (1.7%, a difference of 0.60%).
| Demographics | Rating | Rank | Disability Age Under 5 |
| Creek | 0.0 /100 | #306 | Tragic 1.6% |
| Scottish | 0.0 /100 | #307 | Tragic 1.6% |
| Navajo | 0.0 /100 | #308 | Tragic 1.6% |
| Cape Verdeans | 0.0 /100 | #309 | Tragic 1.7% |
| Whites/Caucasians | 0.0 /100 | #310 | Tragic 1.7% |
| English | 0.0 /100 | #311 | Tragic 1.7% |
| Puerto Ricans | 0.0 /100 | #312 | Tragic 1.7% |
| Celtics | 0.0 /100 | #313 | Tragic 1.7% |
| Norwegians | 0.0 /100 | #314 | Tragic 1.7% |
| Dutch | 0.0 /100 | #315 | Tragic 1.7% |
| Immigrants from Cabo Verde | 0.0 /100 | #316 | Tragic 1.7% |
| French | 0.0 /100 | #317 | Tragic 1.7% |
| Irish | 0.0 /100 | #318 | Tragic 1.7% |
| Slovaks | 0.0 /100 | #319 | Tragic 1.7% |
| Scotch-Irish | 0.0 /100 | #320 | Tragic 1.7% |
Celtic Disability Age Under 5 Correlation Summary
| Measurement | Celtic Data | Disability Age Under 5 Data |
| Minimum | 0.016% | 0.88% |
| Maximum | 4.2% | 50.0% |
| Range | 4.2% | 49.1% |
| Mean | 1.1% | 7.1% |
| Median | 0.62% | 2.8% |
| Interquartile 25% (IQ1) | 0.31% | 2.0% |
| Interquartile 75% (IQ3) | 1.3% | 7.7% |
| Interquartile Range (IQR) | 0.96% | 5.7% |
| Standard Deviation (Sample) | 1.1% | 10.5% |
| Standard Deviation (Population) | 1.1% | 10.3% |
Correlation Details
| Celtic Percentile | Sample Size | Disability Age Under 5 |
[ 0.0% - 0.5% ] 0.016% | 98,607,679 | 0.88% |
[ 0.0% - 0.5% ] 0.070% | 11,206,353 | 1.6% |
[ 0.0% - 0.5% ] 0.12% | 2,940,855 | 1.9% |
[ 0.0% - 0.5% ] 0.18% | 1,255,242 | 2.4% |
[ 0.0% - 0.5% ] 0.24% | 838,336 | 1.7% |
[ 0.0% - 0.5% ] 0.28% | 353,096 | 2.8% |
[ 0.0% - 0.5% ] 0.33% | 327,332 | 2.0% |
[ 0.0% - 0.5% ] 0.39% | 171,644 | 2.6% |
[ 0.0% - 0.5% ] 0.44% | 22,929 | 6.7% |
[ 0.0% - 0.5% ] 0.48% | 34,763 | 2.7% |
[ 0.5% - 1.0% ] 0.54% | 38,749 | 2.4% |
[ 0.5% - 1.0% ] 0.59% | 15,101 | 2.1% |
[ 0.5% - 1.0% ] 0.65% | 59,156 | 2.0% |
[ 0.5% - 1.0% ] 0.73% | 9,253 | 24.0% |
[ 0.5% - 1.0% ] 0.78% | 96,896 | 1.3% |
[ 0.5% - 1.0% ] 0.83% | 7,941 | 4.6% |
[ 0.5% - 1.0% ] 0.94% | 25,753 | 5.7% |
[ 1.0% - 1.5% ] 1.16% | 22,075 | 3.1% |
[ 1.0% - 1.5% ] 1.38% | 3,255 | 7.3% |
[ 2.0% - 2.5% ] 2.20% | 1,270 | 8.3% |
[ 2.0% - 2.5% ] 2.44% | 4,597 | 13.8% |
[ 3.0% - 3.5% ] 3.16% | 729 | 50.0% |
[ 3.0% - 3.5% ] 3.29% | 2,702 | 11.6% |
[ 4.0% - 4.5% ] 4.22% | 2,251 | 8.2% |