Celtic vs South American Disability Age 5 to 17
COMPARE
Celtic
South American
Disability Age 5 to 17
Disability Age 5 to 17 Comparison
Celtics
South Americans
6.3%
DISABILITY AGE 5 TO 17
0.0/ 100
METRIC RATING
302nd/ 347
METRIC RANK
5.4%
DISABILITY AGE 5 TO 17
97.1/ 100
METRIC RATING
118th/ 347
METRIC RANK
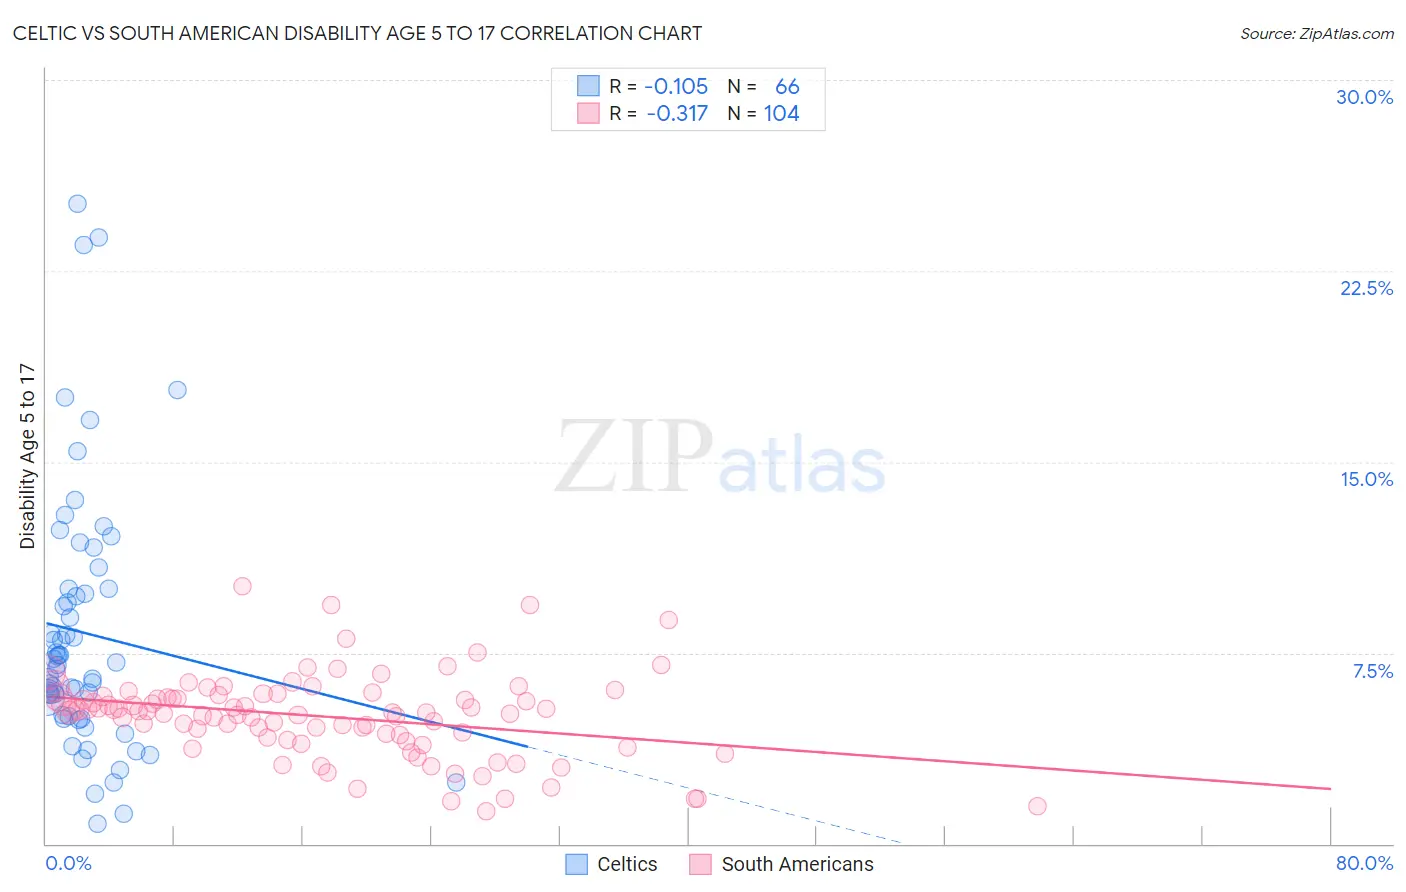
Celtic vs South American Disability Age 5 to 17 Correlation Chart
The statistical analysis conducted on geographies consisting of 168,097,292 people shows a poor negative correlation between the proportion of Celtics and percentage of population with a disability between the ages 5 and 17 in the United States with a correlation coefficient (R) of -0.105 and weighted average of 6.3%. Similarly, the statistical analysis conducted on geographies consisting of 487,738,327 people shows a mild negative correlation between the proportion of South Americans and percentage of population with a disability between the ages 5 and 17 in the United States with a correlation coefficient (R) of -0.317 and weighted average of 5.4%, a difference of 17.3%.
Disability Age 5 to 17 Correlation Summary
| Measurement | Celtic | South American |
| Minimum | 0.80% | 1.3% |
| Maximum | 25.1% | 10.1% |
| Range | 24.3% | 8.8% |
| Mean | 8.3% | 5.0% |
| Median | 7.1% | 5.2% |
| Interquartile 25% (IQ1) | 5.0% | 4.1% |
| Interquartile 75% (IQ3) | 10.0% | 5.8% |
| Interquartile Range (IQR) | 5.0% | 1.7% |
| Standard Deviation (Sample) | 5.1% | 1.6% |
| Standard Deviation (Population) | 5.1% | 1.6% |
Similar Demographics by Disability Age 5 to 17
Demographics Similar to Celtics by Disability Age 5 to 17
In terms of disability age 5 to 17, the demographic groups most similar to Celtics are Yakama (6.3%, a difference of 0.10%), Senegalese (6.3%, a difference of 0.18%), U.S. Virgin Islander (6.3%, a difference of 0.33%), Native/Alaskan (6.3%, a difference of 0.33%), and Carpatho Rusyn (6.3%, a difference of 0.35%).
| Demographics | Rating | Rank | Disability Age 5 to 17 |
| Cree | 0.0 /100 | #295 | Tragic 6.2% |
| Spanish Americans | 0.0 /100 | #296 | Tragic 6.2% |
| Immigrants | Bahamas | 0.0 /100 | #297 | Tragic 6.2% |
| Lumbee | 0.0 /100 | #298 | Tragic 6.2% |
| Welsh | 0.0 /100 | #299 | Tragic 6.3% |
| Carpatho Rusyns | 0.0 /100 | #300 | Tragic 6.3% |
| U.S. Virgin Islanders | 0.0 /100 | #301 | Tragic 6.3% |
| Celtics | 0.0 /100 | #302 | Tragic 6.3% |
| Yakama | 0.0 /100 | #303 | Tragic 6.3% |
| Senegalese | 0.0 /100 | #304 | Tragic 6.3% |
| Natives/Alaskans | 0.0 /100 | #305 | Tragic 6.3% |
| Immigrants | Nonimmigrants | 0.0 /100 | #306 | Tragic 6.3% |
| Bahamians | 0.0 /100 | #307 | Tragic 6.3% |
| Scotch-Irish | 0.0 /100 | #308 | Tragic 6.3% |
| Hmong | 0.0 /100 | #309 | Tragic 6.3% |
Demographics Similar to South Americans by Disability Age 5 to 17
In terms of disability age 5 to 17, the demographic groups most similar to South Americans are Immigrants from South America (5.4%, a difference of 0.010%), Immigrants (5.4%, a difference of 0.060%), Immigrants from Afghanistan (5.3%, a difference of 0.11%), Cypriot (5.3%, a difference of 0.27%), and Cuban (5.3%, a difference of 0.33%).
| Demographics | Rating | Rank | Disability Age 5 to 17 |
| Ethiopians | 97.9 /100 | #111 | Exceptional 5.3% |
| Immigrants | Latvia | 97.9 /100 | #112 | Exceptional 5.3% |
| Aleuts | 97.8 /100 | #113 | Exceptional 5.3% |
| Immigrants | Northern Europe | 97.8 /100 | #114 | Exceptional 5.3% |
| Cubans | 97.8 /100 | #115 | Exceptional 5.3% |
| Cypriots | 97.7 /100 | #116 | Exceptional 5.3% |
| Immigrants | Afghanistan | 97.4 /100 | #117 | Exceptional 5.3% |
| South Americans | 97.1 /100 | #118 | Exceptional 5.4% |
| Immigrants | South America | 97.1 /100 | #119 | Exceptional 5.4% |
| Immigrants | Immigrants | 97.0 /100 | #120 | Exceptional 5.4% |
| Maltese | 96.0 /100 | #121 | Exceptional 5.4% |
| Chileans | 95.8 /100 | #122 | Exceptional 5.4% |
| Immigrants | Ethiopia | 95.5 /100 | #123 | Exceptional 5.4% |
| Crow | 95.0 /100 | #124 | Exceptional 5.4% |
| Immigrants | Chile | 95.0 /100 | #125 | Exceptional 5.4% |