Zip Codes with the Highest Percentage of Population Employed in Installation, Maintenance & Repair in Gardnerville, NV
RELATED REPORTS & OPTIONS
Installation, Maintenance & Repair
Gardnerville
Compare Zip Codes
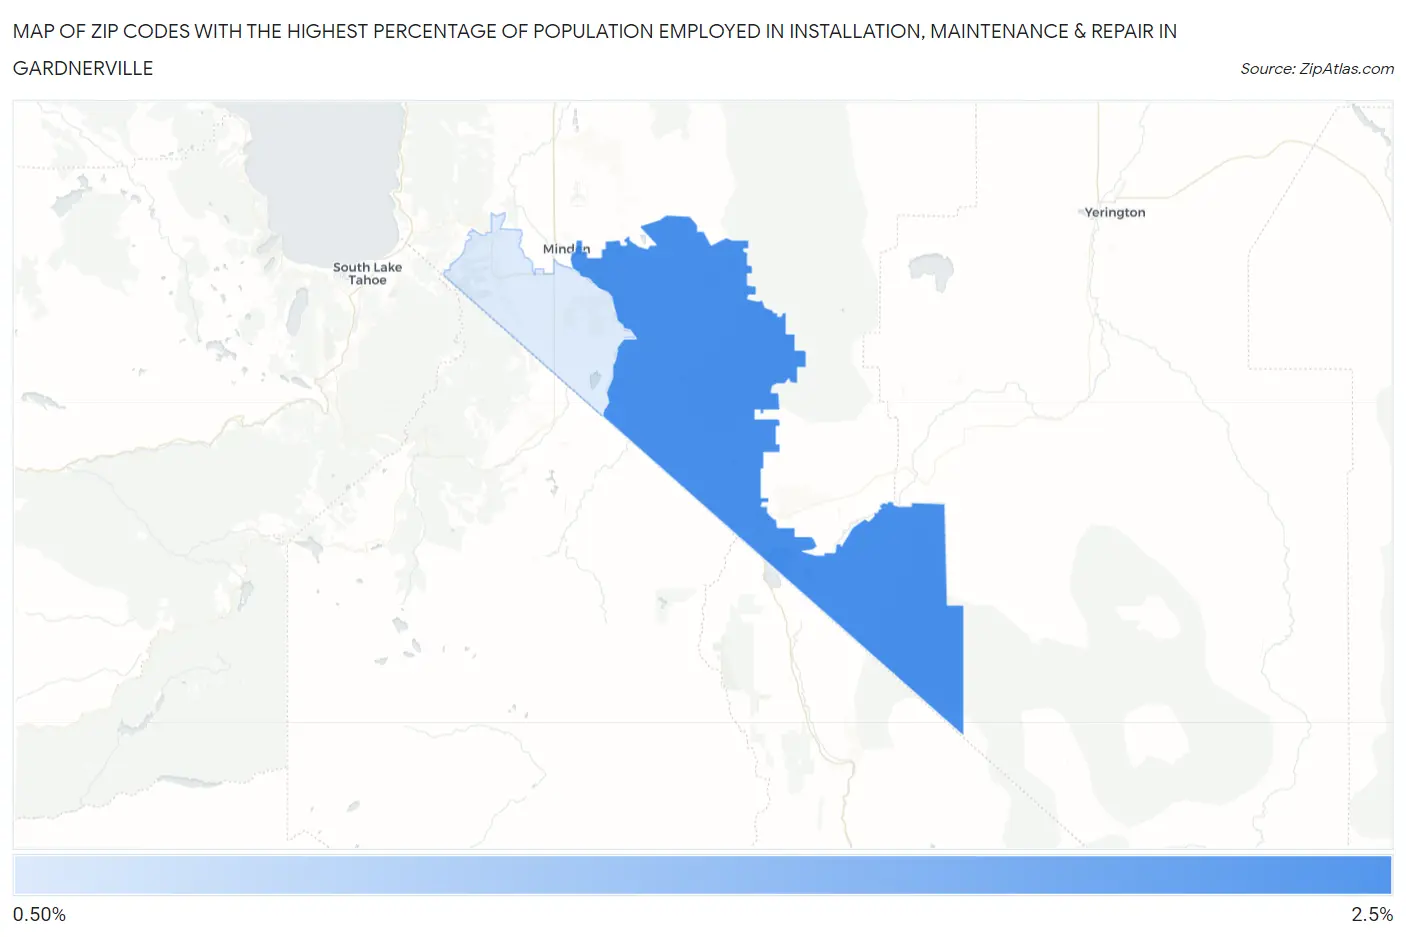
Map of Zip Codes with the Highest Percentage of Population Employed in Installation, Maintenance & Repair in Gardnerville
1.3%
2.2%
Zip Codes with the Highest Percentage of Population Employed in Installation, Maintenance & Repair in Gardnerville, NV
| Zip Code | % Employed | vs State | vs National | |
| 1. | 89410 | 2.2% | 3.2%(-0.984)#98 | 3.1%(-0.835)#20,923 |
| 2. | 89460 | 1.3% | 3.2%(-1.92)#126 | 3.1%(-1.77)#24,904 |
1
Common Questions
What are the Top Zip Codes with the Highest Percentage of Population Employed in Installation, Maintenance & Repair in Gardnerville, NV?
Top Zip Codes with the Highest Percentage of Population Employed in Installation, Maintenance & Repair in Gardnerville, NV are:
What zip code has the Highest Percentage of Population Employed in Installation, Maintenance & Repair in Gardnerville, NV?
89410 has the Highest Percentage of Population Employed in Installation, Maintenance & Repair in Gardnerville, NV with 2.2%.
What is the Percentage of Population Employed in Installation, Maintenance & Repair in Gardnerville, NV?
Percentage of Population Employed in Installation, Maintenance & Repair in Gardnerville is 2.0%.
What is the Percentage of Population Employed in Installation, Maintenance & Repair in Nevada?
Percentage of Population Employed in Installation, Maintenance & Repair in Nevada is 3.2%.
What is the Percentage of Population Employed in Installation, Maintenance & Repair in the United States?
Percentage of Population Employed in Installation, Maintenance & Repair in the United States is 3.1%.