Zip Codes with the Highest Percentage of Population Employed in Architecture & Engineering in Gardnerville, NV
RELATED REPORTS & OPTIONS
Architecture & Engineering
Gardnerville
Compare Zip Codes
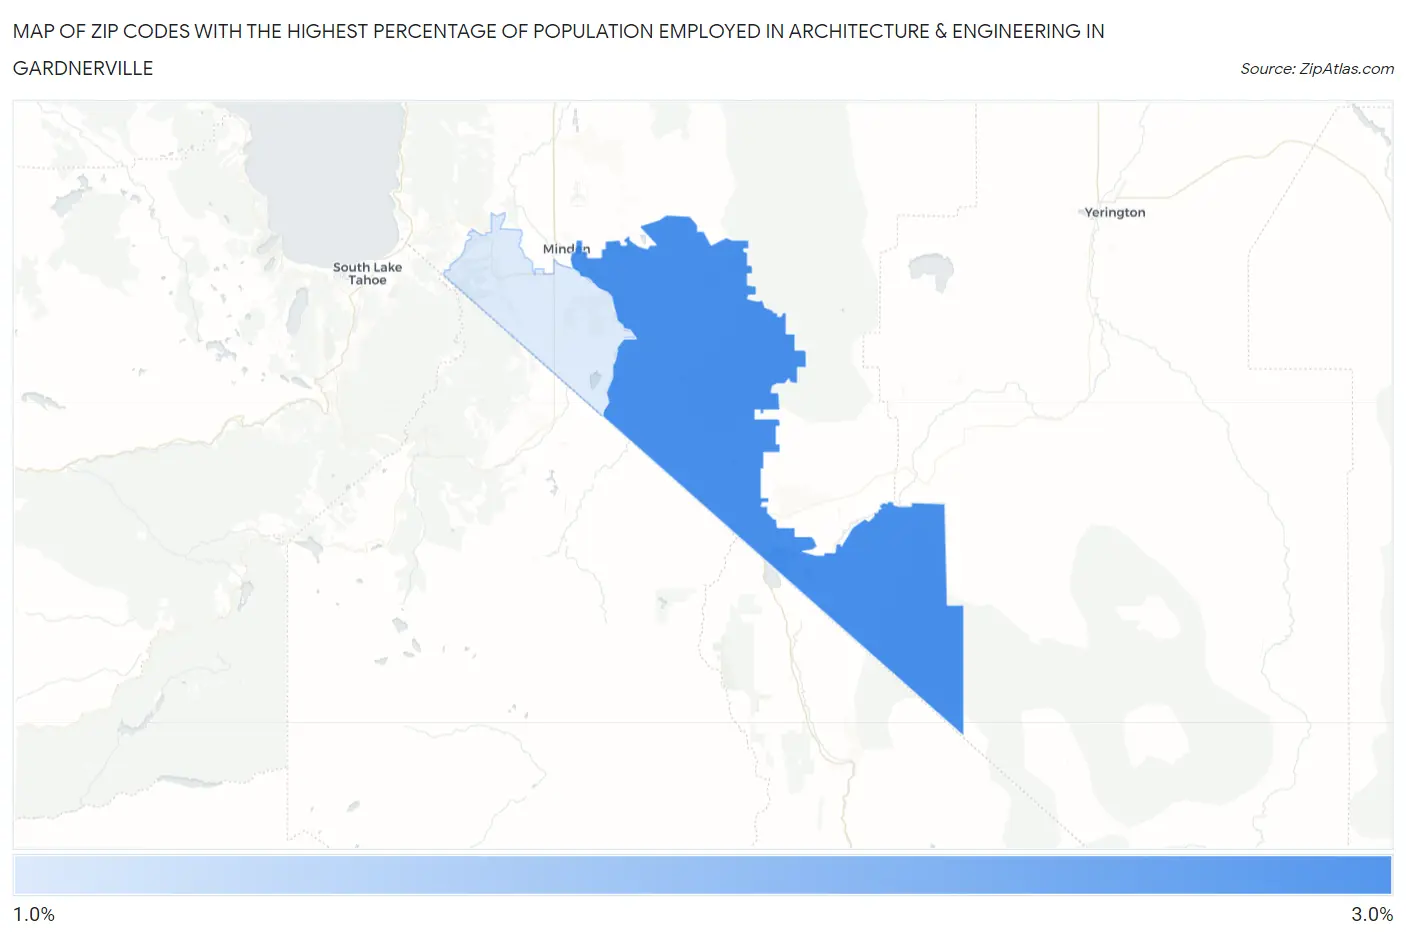
Map of Zip Codes with the Highest Percentage of Population Employed in Architecture & Engineering in Gardnerville
1.4%
2.6%
Zip Codes with the Highest Percentage of Population Employed in Architecture & Engineering in Gardnerville, NV
| Zip Code | % Employed | vs State | vs National | |
| 1. | 89410 | 2.6% | 1.5%(+1.14)#27 | 2.1%(+0.472)#6,483 |
| 2. | 89460 | 1.4% | 1.5%(-0.073)#59 | 2.1%(-0.738)#13,503 |
1
Common Questions
What are the Top Zip Codes with the Highest Percentage of Population Employed in Architecture & Engineering in Gardnerville, NV?
Top Zip Codes with the Highest Percentage of Population Employed in Architecture & Engineering in Gardnerville, NV are:
What zip code has the Highest Percentage of Population Employed in Architecture & Engineering in Gardnerville, NV?
89410 has the Highest Percentage of Population Employed in Architecture & Engineering in Gardnerville, NV with 2.6%.
What is the Percentage of Population Employed in Architecture & Engineering in Gardnerville, NV?
Percentage of Population Employed in Architecture & Engineering in Gardnerville is 3.3%.
What is the Percentage of Population Employed in Architecture & Engineering in Nevada?
Percentage of Population Employed in Architecture & Engineering in Nevada is 1.5%.
What is the Percentage of Population Employed in Architecture & Engineering in the United States?
Percentage of Population Employed in Architecture & Engineering in the United States is 2.1%.