Zip Codes with the Highest Percentage of Population Employed in Architecture & Engineering in Henderson, NV
RELATED REPORTS & OPTIONS
Architecture & Engineering
Henderson
Compare Zip Codes
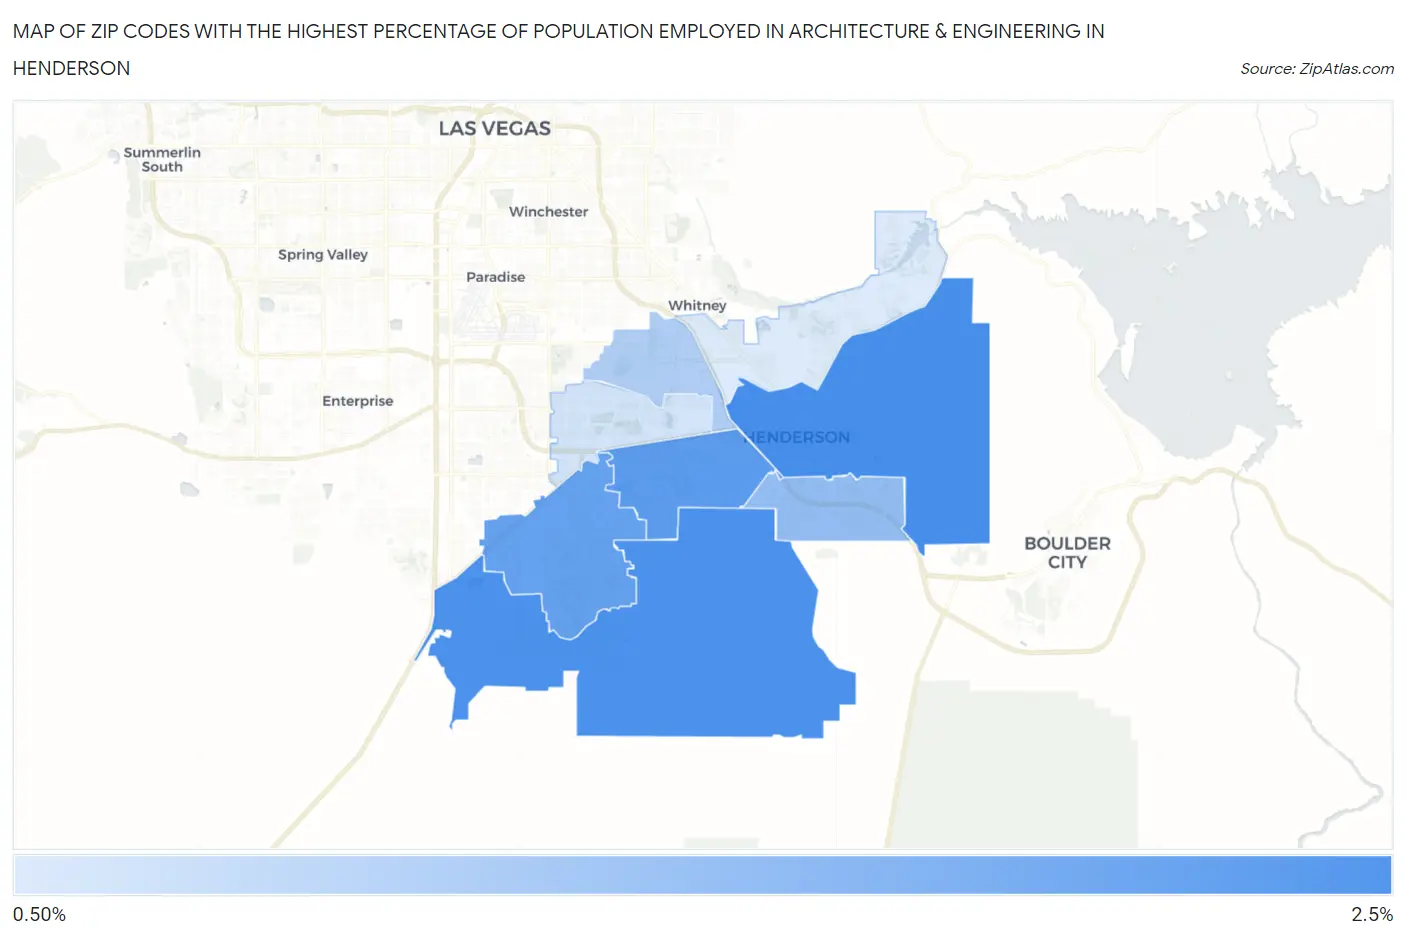
Map of Zip Codes with the Highest Percentage of Population Employed in Architecture & Engineering in Henderson
0.72%
2.4%
Zip Codes with the Highest Percentage of Population Employed in Architecture & Engineering in Henderson, NV
| Zip Code | % Employed | vs State | vs National | |
| 1. | 89015 | 2.4% | 1.5%(+0.882)#30 | 2.1%(+0.217)#7,641 |
| 2. | 89044 | 2.3% | 1.5%(+0.839)#31 | 2.1%(+0.175)#7,831 |
| 3. | 89012 | 2.1% | 1.5%(+0.664)#35 | 2.1%(-0.000)#8,764 |
| 4. | 89052 | 2.0% | 1.5%(+0.561)#38 | 2.1%(-0.103)#9,332 |
| 5. | 89002 | 1.5% | 1.5%(+0.034)#56 | 2.1%(-0.631)#12,748 |
| 6. | 89014 | 1.2% | 1.5%(-0.263)#63 | 2.1%(-0.927)#14,904 |
| 7. | 89074 | 0.83% | 1.5%(-0.659)#81 | 2.1%(-1.32)#17,943 |
| 8. | 89011 | 0.72% | 1.5%(-0.769)#86 | 2.1%(-1.43)#18,787 |
1
Common Questions
What are the Top 5 Zip Codes with the Highest Percentage of Population Employed in Architecture & Engineering in Henderson, NV?
Top 5 Zip Codes with the Highest Percentage of Population Employed in Architecture & Engineering in Henderson, NV are:
What zip code has the Highest Percentage of Population Employed in Architecture & Engineering in Henderson, NV?
89015 has the Highest Percentage of Population Employed in Architecture & Engineering in Henderson, NV with 2.4%.
What is the Percentage of Population Employed in Architecture & Engineering in Henderson, NV?
Percentage of Population Employed in Architecture & Engineering in Henderson is 1.6%.
What is the Percentage of Population Employed in Architecture & Engineering in Nevada?
Percentage of Population Employed in Architecture & Engineering in Nevada is 1.5%.
What is the Percentage of Population Employed in Architecture & Engineering in the United States?
Percentage of Population Employed in Architecture & Engineering in the United States is 2.1%.