Walker Lake, NV Map & Demographics
Walker Lake Map
Walker Lake Overview
$24,945
PER CAPITA INCOME
$46,471
AVG FAMILY INCOME
$40,481
AVG HOUSEHOLD INCOME
17.1%
WAGE / INCOME GAP [ % ]
82.9¢/ $1
WAGE / INCOME GAP [ $ ]
0.40
INEQUALITY / GINI INDEX
385
TOTAL POPULATION
171
MALE POPULATION
214
FEMALE POPULATION
79.91
MALES / 100 FEMALES
125.15
FEMALES / 100 MALES
66.4
MEDIAN AGE
2.7
AVG FAMILY SIZE
1.6
AVG HOUSEHOLD SIZE
95
LABOR FORCE [ PEOPLE ]
28.4%
PERCENT IN LABOR FORCE
12.6%
UNEMPLOYMENT RATE
Walker Lake Area Codes
Income in Walker Lake
Income Overview in Walker Lake
Per Capita Income in Walker Lake is $24,945, while median incomes of families and households are $46,471 and $40,481 respectively.
| Characteristic | Number | Measure |
| Per Capita Income | 385 | $24,945 |
| Median Family Income | 72 | $46,471 |
| Mean Family Income | 72 | $50,740 |
| Median Household Income | 237 | $40,481 |
| Mean Household Income | 237 | $40,066 |
| Income Deficit | 72 | $0 |
| Wage / Income Gap (%) | 385 | 17.05% |
| Wage / Income Gap ($) | 385 | 82.95¢ per $1 |
| Gini / Inequality Index | 385 | 0.40 |
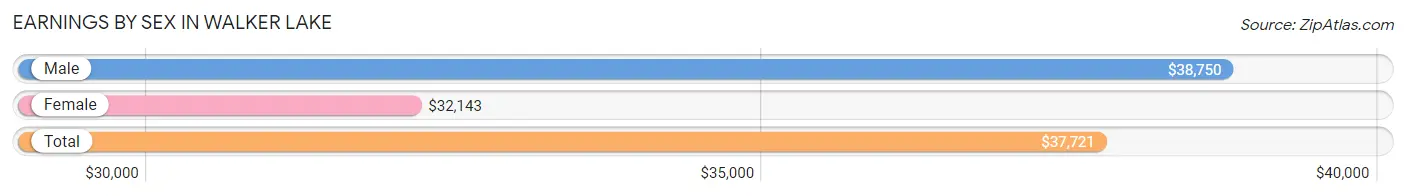
Earnings by Sex in Walker Lake
Average Earnings in Walker Lake are $37,721, $38,750 for men and $32,143 for women, a difference of 17.1%.
| Sex | Number | Average Earnings |
| Male | 65 (73.0%) | $38,750 |
| Female | 24 (27.0%) | $32,143 |
| Total | 89 (100.0%) | $37,721 |
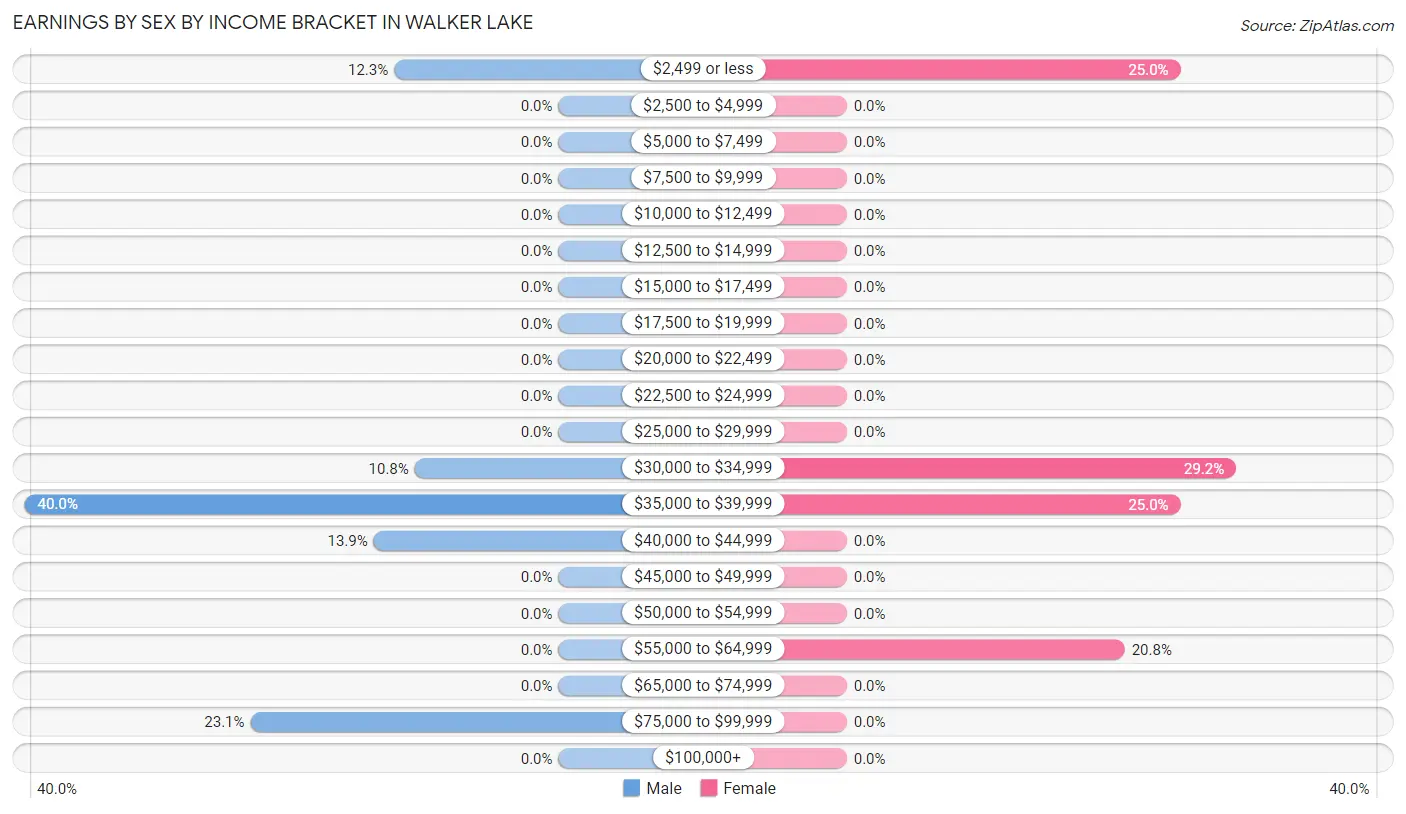
Earnings by Sex by Income Bracket in Walker Lake
The most common earnings brackets in Walker Lake are $35,000 to $39,999 for men (26 | 40.0%) and $30,000 to $34,999 for women (7 | 29.2%).
| Income | Male | Female |
| $2,499 or less | 8 (12.3%) | 6 (25.0%) |
| $2,500 to $4,999 | 0 (0.0%) | 0 (0.0%) |
| $5,000 to $7,499 | 0 (0.0%) | 0 (0.0%) |
| $7,500 to $9,999 | 0 (0.0%) | 0 (0.0%) |
| $10,000 to $12,499 | 0 (0.0%) | 0 (0.0%) |
| $12,500 to $14,999 | 0 (0.0%) | 0 (0.0%) |
| $15,000 to $17,499 | 0 (0.0%) | 0 (0.0%) |
| $17,500 to $19,999 | 0 (0.0%) | 0 (0.0%) |
| $20,000 to $22,499 | 0 (0.0%) | 0 (0.0%) |
| $22,500 to $24,999 | 0 (0.0%) | 0 (0.0%) |
| $25,000 to $29,999 | 0 (0.0%) | 0 (0.0%) |
| $30,000 to $34,999 | 7 (10.8%) | 7 (29.2%) |
| $35,000 to $39,999 | 26 (40.0%) | 6 (25.0%) |
| $40,000 to $44,999 | 9 (13.9%) | 0 (0.0%) |
| $45,000 to $49,999 | 0 (0.0%) | 0 (0.0%) |
| $50,000 to $54,999 | 0 (0.0%) | 0 (0.0%) |
| $55,000 to $64,999 | 0 (0.0%) | 5 (20.8%) |
| $65,000 to $74,999 | 0 (0.0%) | 0 (0.0%) |
| $75,000 to $99,999 | 15 (23.1%) | 0 (0.0%) |
| $100,000+ | 0 (0.0%) | 0 (0.0%) |
| Total | 65 (100.0%) | 24 (100.0%) |
Earnings by Sex by Educational Attainment in Walker Lake
| Educational Attainment | Male Income | Female Income |
| Less than High School | - | - |
| High School Diploma | - | - |
| College or Associate's Degree | - | - |
| Bachelor's Degree | - | - |
| Graduate Degree | - | - |
| Total | $38,750 | $32,143 |
Family Income in Walker Lake
Family Income Brackets in Walker Lake
According to the Walker Lake family income data, there are 28 families falling into the $35,000 to $49,999 income range, which is the most common income bracket and makes up 38.9% of all families.
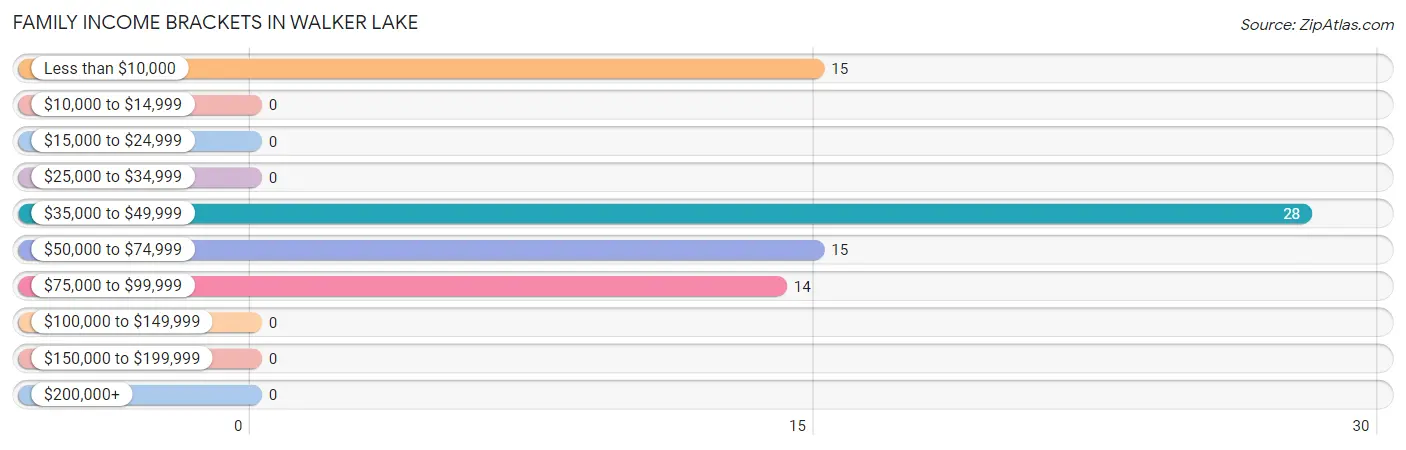
| Income Bracket | # Families | % Families |
| Less than $10,000 | 15 | 20.8% |
| $10,000 to $14,999 | 0 | 0.0% |
| $15,000 to $24,999 | 0 | 0.0% |
| $25,000 to $34,999 | 0 | 0.0% |
| $35,000 to $49,999 | 28 | 38.9% |
| $50,000 to $74,999 | 15 | 20.8% |
| $75,000 to $99,999 | 14 | 19.4% |
| $100,000 to $149,999 | 0 | 0.0% |
| $150,000 to $199,999 | 0 | 0.0% |
| $200,000+ | 0 | 0.0% |
Family Income by Famaliy Size in Walker Lake
2-person families (51 | 70.8%) account for the highest median family income in Walker Lake with $45,809 per family, while 2-person families (51 | 70.8%) have the highest median income of $22,904 per family member.
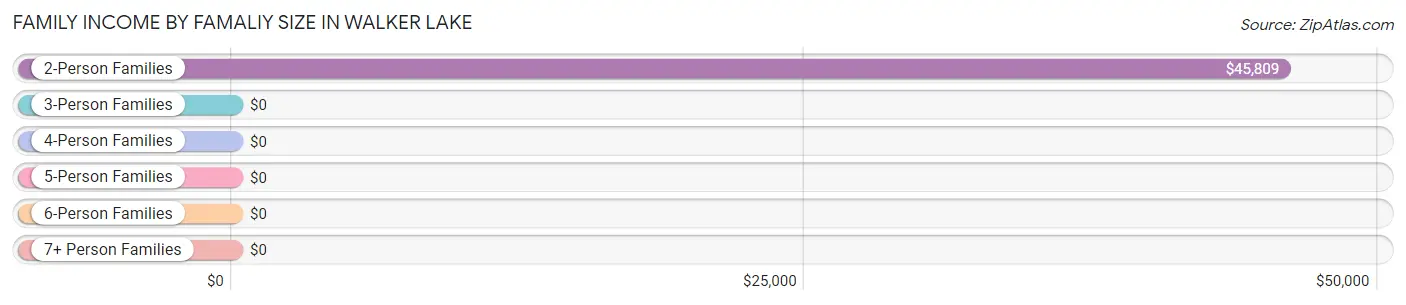
| Income Bracket | # Families | Median Income |
| 2-Person Families | 51 (70.8%) | $45,809 |
| 3-Person Families | 9 (12.5%) | $0 |
| 4-Person Families | 6 (8.3%) | $0 |
| 5-Person Families | 0 (0.0%) | $0 |
| 6-Person Families | 6 (8.3%) | $0 |
| 7+ Person Families | 0 (0.0%) | $0 |
| Total | 72 (100.0%) | $46,471 |
Family Income by Number of Earners in Walker Lake
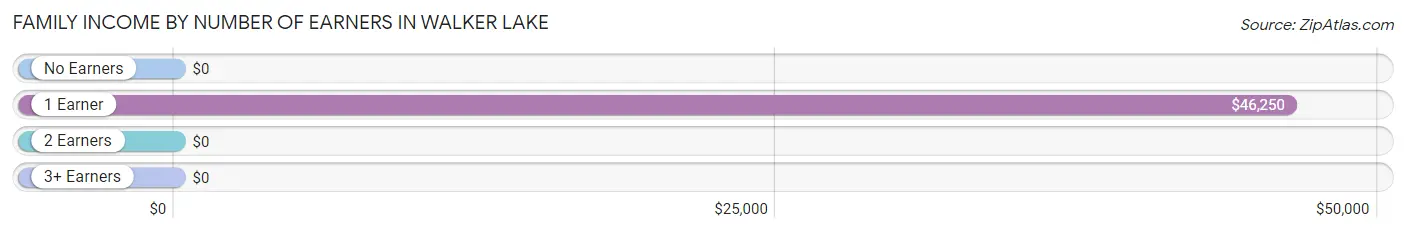
| Number of Earners | # Families | Median Income |
| No Earners | 12 (16.7%) | $0 |
| 1 Earner | 45 (62.5%) | $46,250 |
| 2 Earners | 15 (20.8%) | $0 |
| 3+ Earners | 0 (0.0%) | $0 |
| Total | 72 (100.0%) | $46,471 |
Household Income in Walker Lake
Household Income Brackets in Walker Lake
With 90 households falling in the category, the $35,000 to $49,999 income range is the most frequent in Walker Lake, accounting for 38.0% of all households.
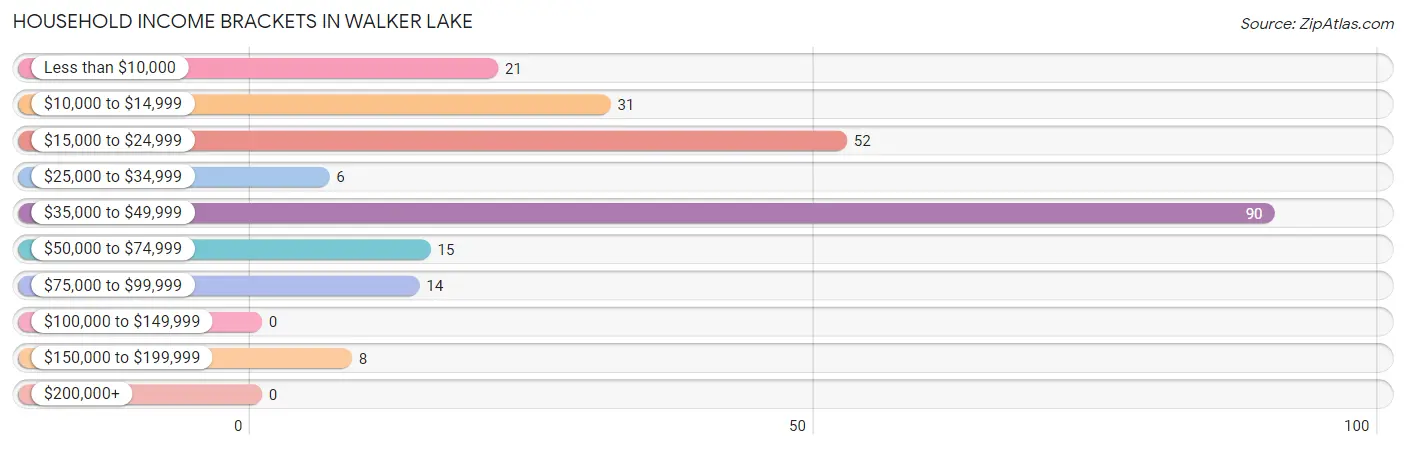
| Income Bracket | # Households | % Households |
| Less than $10,000 | 21 | 8.9% |
| $10,000 to $14,999 | 31 | 13.1% |
| $15,000 to $24,999 | 52 | 21.9% |
| $25,000 to $34,999 | 6 | 2.5% |
| $35,000 to $49,999 | 90 | 38.0% |
| $50,000 to $74,999 | 15 | 6.3% |
| $75,000 to $99,999 | 14 | 5.9% |
| $100,000 to $149,999 | 0 | 0.0% |
| $150,000 to $199,999 | 8 | 3.4% |
| $200,000+ | 0 | 0.0% |
Household Income by Householder Age in Walker Lake
| Income Bracket | # Households | Median Income |
| 15 to 24 Years | 0 (0.0%) | $0 |
| 25 to 44 Years | 29 (12.2%) | $0 |
| 45 to 64 Years | 24 (10.1%) | $0 |
| 65+ Years | 184 (77.6%) | $0 |
| Total | 237 (100.0%) | $40,481 |
Poverty in Walker Lake
Income Below Poverty by Sex and Age in Walker Lake
With 36.3% poverty level for males and 27.1% for females among the residents of Walker Lake, 75 year old and over males and under 5 year old females are the most vulnerable to poverty, with 25 males (80.6%) and 5 females (100.0%) in their respective age groups living below the poverty level.
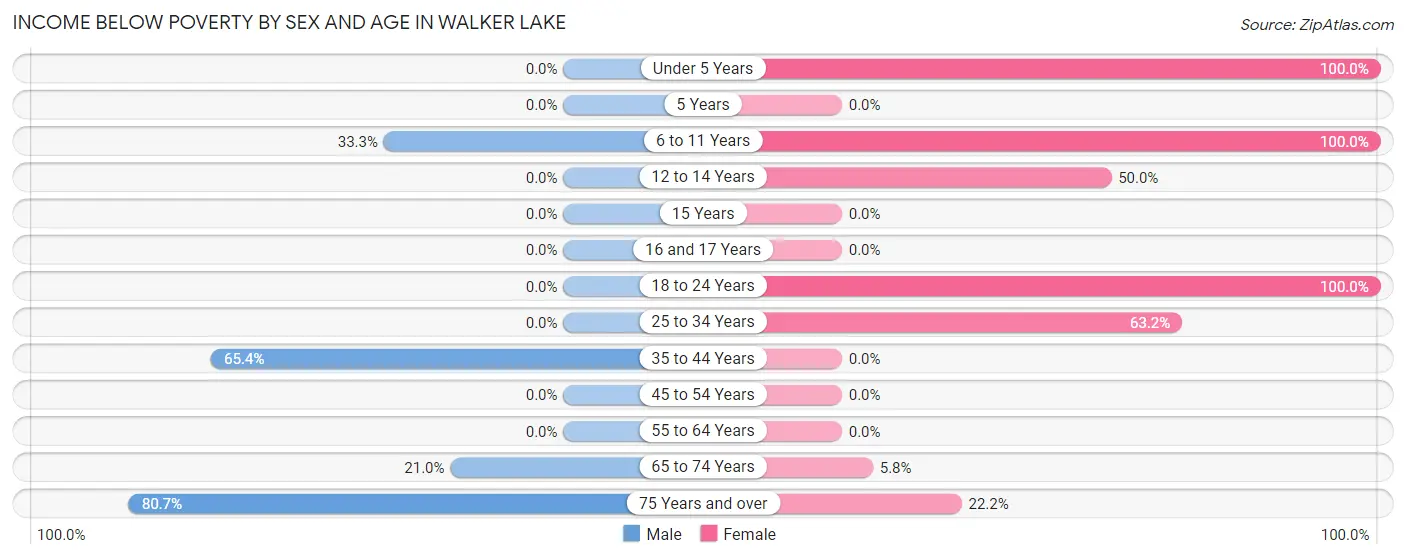
| Age Bracket | Male | Female |
| Under 5 Years | 0 (0.0%) | 5 (100.0%) |
| 5 Years | 0 (0.0%) | 0 (0.0%) |
| 6 to 11 Years | 7 (33.3%) | 12 (100.0%) |
| 12 to 14 Years | 0 (0.0%) | 6 (50.0%) |
| 15 Years | 0 (0.0%) | 0 (0.0%) |
| 16 and 17 Years | 0 (0.0%) | 0 (0.0%) |
| 18 to 24 Years | 0 (0.0%) | 12 (100.0%) |
| 25 to 34 Years | 0 (0.0%) | 12 (63.2%) |
| 35 to 44 Years | 17 (65.4%) | 0 (0.0%) |
| 45 to 54 Years | 0 (0.0%) | 0 (0.0%) |
| 55 to 64 Years | 0 (0.0%) | 0 (0.0%) |
| 65 to 74 Years | 13 (21.0%) | 5 (5.8%) |
| 75 Years and over | 25 (80.6%) | 6 (22.2%) |
| Total | 62 (36.3%) | 58 (27.1%) |
Income Above Poverty by Sex and Age in Walker Lake
According to the poverty statistics in Walker Lake, males aged 55 to 64 years and females aged 35 to 44 years are the age groups that are most secure financially, with 100.0% of males and 100.0% of females in these age groups living above the poverty line.
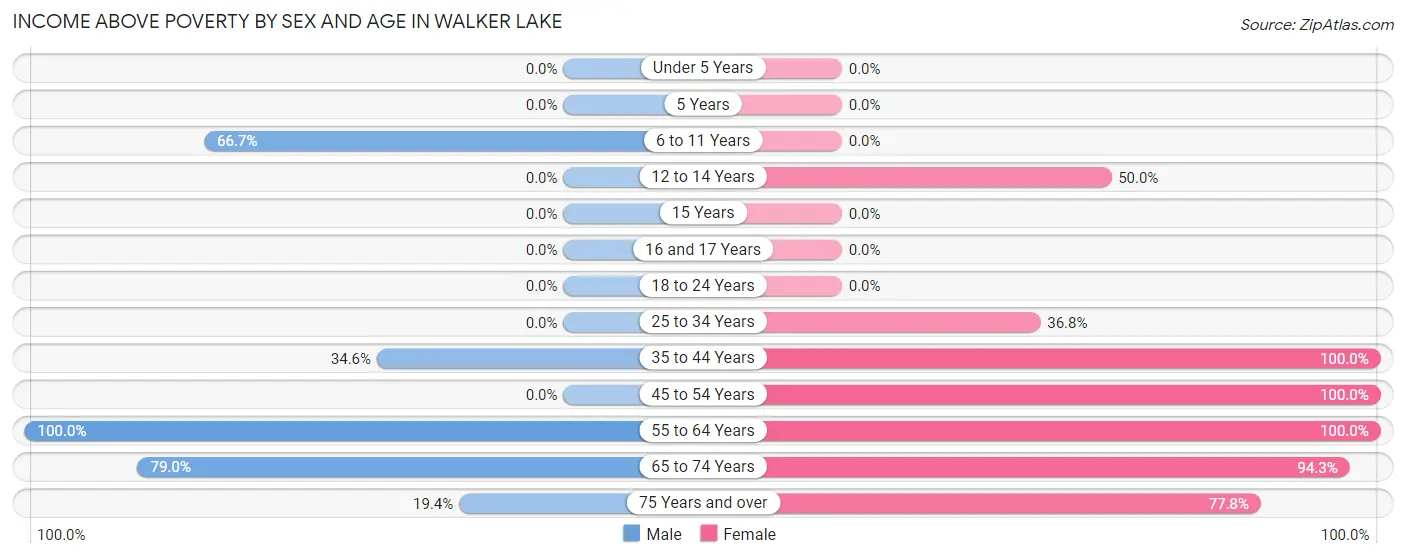
| Age Bracket | Male | Female |
| Under 5 Years | 0 (0.0%) | 0 (0.0%) |
| 5 Years | 0 (0.0%) | 0 (0.0%) |
| 6 to 11 Years | 14 (66.7%) | 0 (0.0%) |
| 12 to 14 Years | 0 (0.0%) | 6 (50.0%) |
| 15 Years | 0 (0.0%) | 0 (0.0%) |
| 16 and 17 Years | 0 (0.0%) | 0 (0.0%) |
| 18 to 24 Years | 0 (0.0%) | 0 (0.0%) |
| 25 to 34 Years | 0 (0.0%) | 7 (36.8%) |
| 35 to 44 Years | 9 (34.6%) | 6 (100.0%) |
| 45 to 54 Years | 0 (0.0%) | 5 (100.0%) |
| 55 to 64 Years | 31 (100.0%) | 29 (100.0%) |
| 65 to 74 Years | 49 (79.0%) | 82 (94.3%) |
| 75 Years and over | 6 (19.4%) | 21 (77.8%) |
| Total | 109 (63.7%) | 156 (72.9%) |
Income Below Poverty Among Married-Couple Families in Walker Lake
The poverty statistics for married-couple families in Walker Lake show that 20.3% or 13 of the total 64 families live below the poverty line. Families with 3 or 4 children have the highest poverty rate of 100.0%, comprising of 6 families. On the other hand, families with 1 or 2 children have the lowest poverty rate of 0.0%, which includes 0 families.
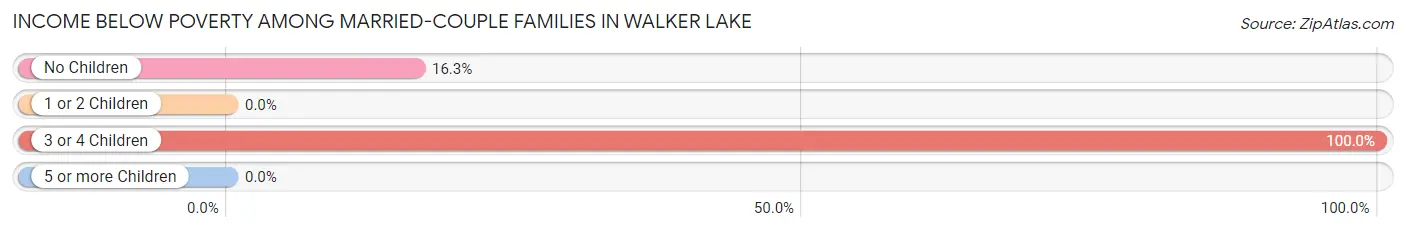
| Children | Above Poverty | Below Poverty |
| No Children | 36 (83.7%) | 7 (16.3%) |
| 1 or 2 Children | 15 (100.0%) | 0 (0.0%) |
| 3 or 4 Children | 0 (0.0%) | 6 (100.0%) |
| 5 or more Children | 0 (0.0%) | 0 (0.0%) |
| Total | 51 (79.7%) | 13 (20.3%) |
Income Below Poverty Among Single-Parent Households in Walker Lake
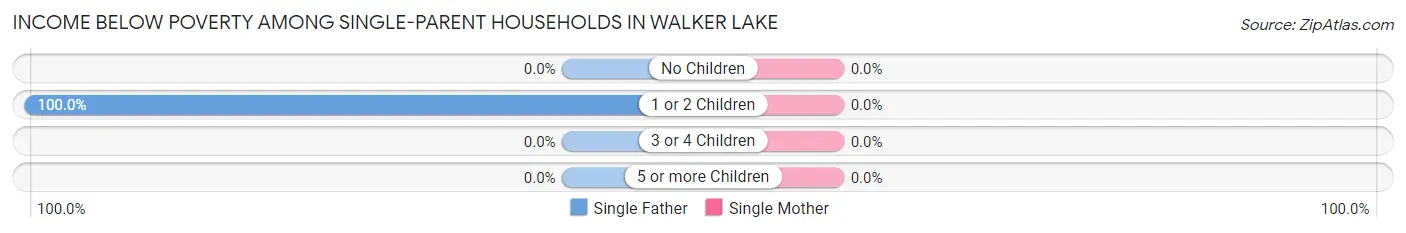
| Children | Single Father | Single Mother |
| No Children | 0 (0.0%) | 0 (0.0%) |
| 1 or 2 Children | 8 (100.0%) | 0 (0.0%) |
| 3 or 4 Children | 0 (0.0%) | 0 (0.0%) |
| 5 or more Children | 0 (0.0%) | 0 (0.0%) |
| Total | 8 (100.0%) | 0 (0.0%) |
Income Below Poverty Among Married-Couple vs Single-Parent Households in Walker Lake
The poverty data for Walker Lake shows that 13 of the married-couple family households (20.3%) and 8 of the single-parent households (100.0%) are living below the poverty level. Within the married-couple family households, those with 3 or 4 children have the highest poverty rate, with 6 households (100.0%) falling below the poverty line. Among the single-parent households, those with 1 or 2 children have the highest poverty rate, with 8 household (100.0%) living below poverty.
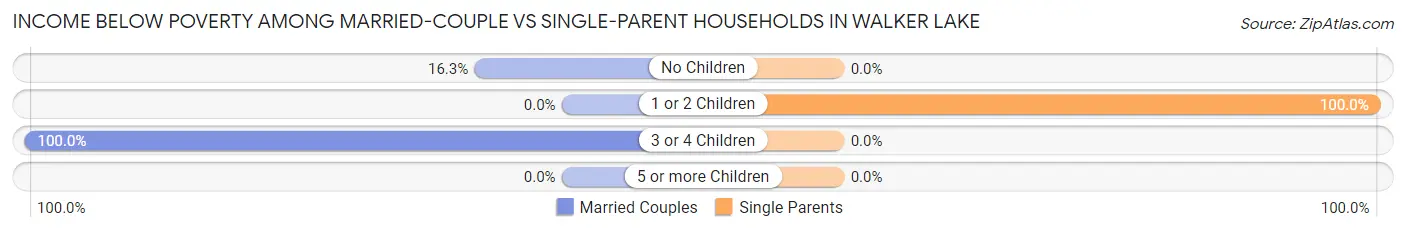
| Children | Married-Couple Families | Single-Parent Households |
| No Children | 7 (16.3%) | 0 (0.0%) |
| 1 or 2 Children | 0 (0.0%) | 8 (100.0%) |
| 3 or 4 Children | 6 (100.0%) | 0 (0.0%) |
| 5 or more Children | 0 (0.0%) | 0 (0.0%) |
| Total | 13 (20.3%) | 8 (100.0%) |
Race in Walker Lake
The most populous races in Walker Lake are White / Caucasian (337 | 87.5%), Hispanic or Latino (48 | 12.5%), and Two or more Races (48 | 12.5%).
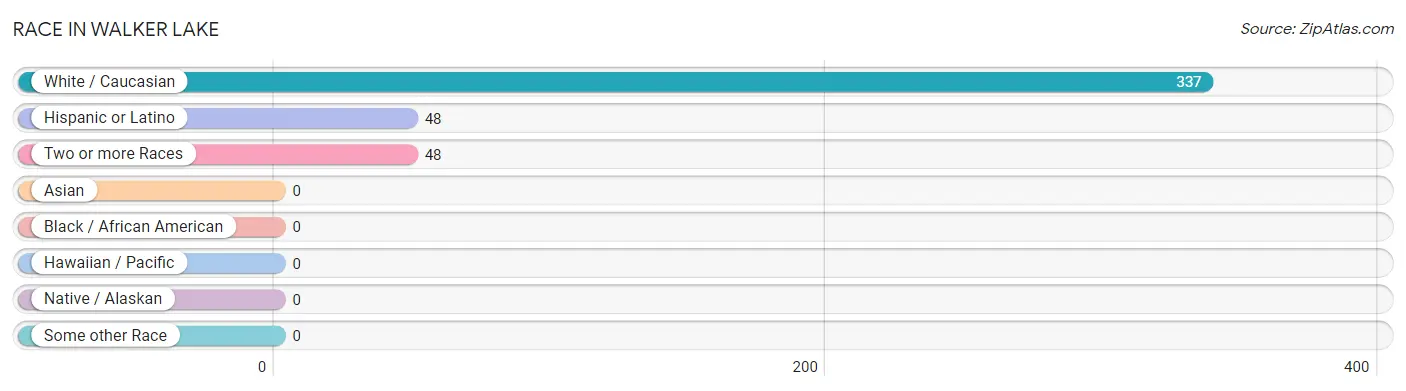
| Race | # Population | % Population |
| Asian | 0 | 0.0% |
| Black / African American | 0 | 0.0% |
| Hawaiian / Pacific | 0 | 0.0% |
| Hispanic or Latino | 48 | 12.5% |
| Native / Alaskan | 0 | 0.0% |
| White / Caucasian | 337 | 87.5% |
| Two or more Races | 48 | 12.5% |
| Some other Race | 0 | 0.0% |
| Total | 385 | 100.0% |
Ancestry in Walker Lake
The most populous ancestries reported in Walker Lake are Italian (105 | 27.3%), English (73 | 19.0%), German (56 | 14.5%), Spanish (48 | 12.5%), and Irish (30 | 7.8%), together accounting for 81.0% of all Walker Lake residents.
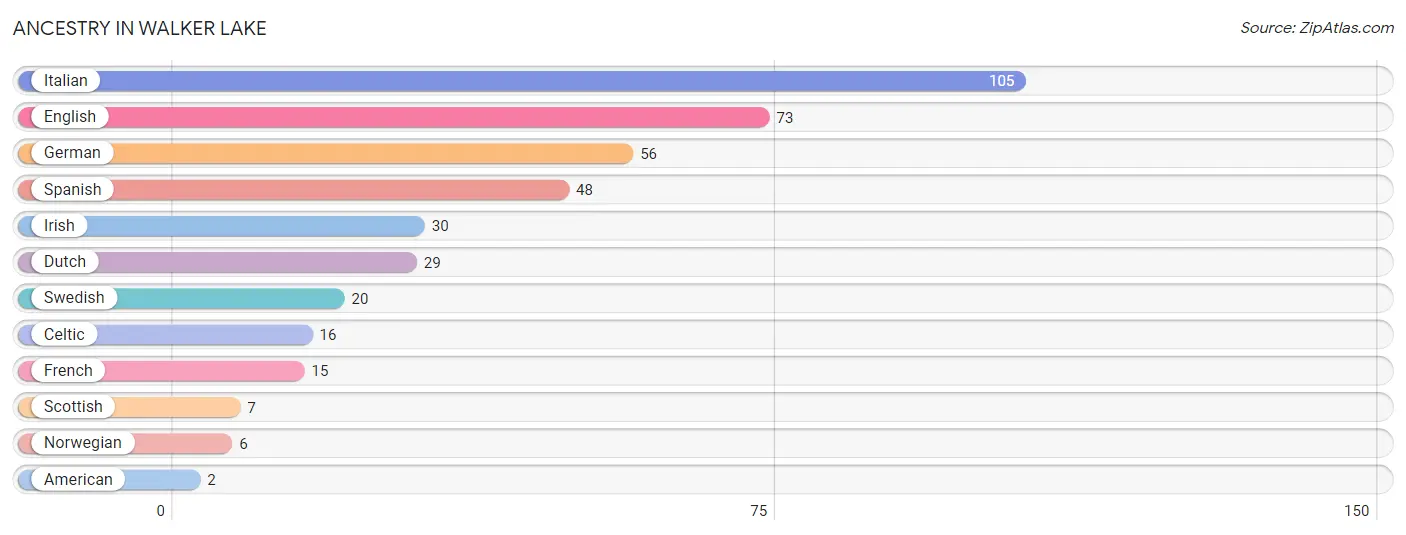
| Ancestry | # Population | % Population |
| American | 2 | 0.5% |
| Celtic | 16 | 4.2% |
| Dutch | 29 | 7.5% |
| English | 73 | 19.0% |
| French | 15 | 3.9% |
| German | 56 | 14.5% |
| Irish | 30 | 7.8% |
| Italian | 105 | 27.3% |
| Norwegian | 6 | 1.6% |
| Scottish | 7 | 1.8% |
| Spanish | 48 | 12.5% |
| Swedish | 20 | 5.2% | View All 12 Rows |
Immigrants in Walker Lake

| Immigration Origin | # Population | % Population | View All 0 Rows |
Sex and Age in Walker Lake
Sex and Age in Walker Lake
The most populous age groups in Walker Lake are 70 to 74 Years (40 | 23.4%) for men and 65 to 69 Years (76 | 35.5%) for women.
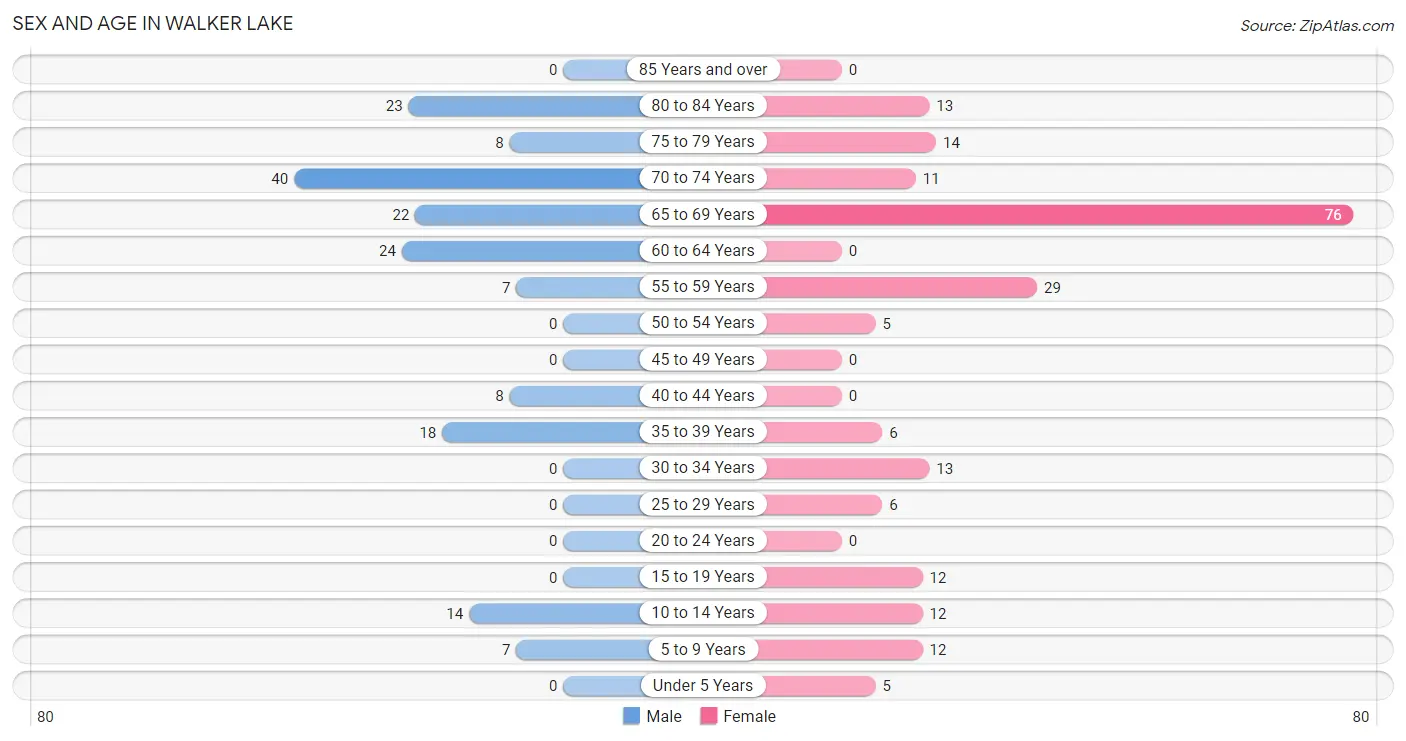
| Age Bracket | Male | Female |
| Under 5 Years | 0 (0.0%) | 5 (2.3%) |
| 5 to 9 Years | 7 (4.1%) | 12 (5.6%) |
| 10 to 14 Years | 14 (8.2%) | 12 (5.6%) |
| 15 to 19 Years | 0 (0.0%) | 12 (5.6%) |
| 20 to 24 Years | 0 (0.0%) | 0 (0.0%) |
| 25 to 29 Years | 0 (0.0%) | 6 (2.8%) |
| 30 to 34 Years | 0 (0.0%) | 13 (6.1%) |
| 35 to 39 Years | 18 (10.5%) | 6 (2.8%) |
| 40 to 44 Years | 8 (4.7%) | 0 (0.0%) |
| 45 to 49 Years | 0 (0.0%) | 0 (0.0%) |
| 50 to 54 Years | 0 (0.0%) | 5 (2.3%) |
| 55 to 59 Years | 7 (4.1%) | 29 (13.6%) |
| 60 to 64 Years | 24 (14.0%) | 0 (0.0%) |
| 65 to 69 Years | 22 (12.9%) | 76 (35.5%) |
| 70 to 74 Years | 40 (23.4%) | 11 (5.1%) |
| 75 to 79 Years | 8 (4.7%) | 14 (6.5%) |
| 80 to 84 Years | 23 (13.5%) | 13 (6.1%) |
| 85 Years and over | 0 (0.0%) | 0 (0.0%) |
| Total | 171 (100.0%) | 214 (100.0%) |
Families and Households in Walker Lake
Median Family Size in Walker Lake
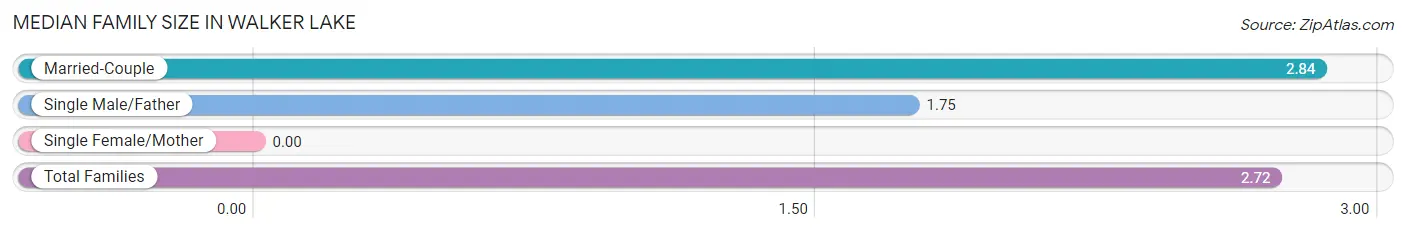
| Family Type | # Families | Family Size |
| Married-Couple | 64 (88.9%) | 2.84 |
| Single Male/Father | 8 (11.1%) | 1.75 |
| Single Female/Mother | 0 (0.0%) | - |
| Total Families | 72 (100.0%) | 2.72 |
Median Household Size in Walker Lake
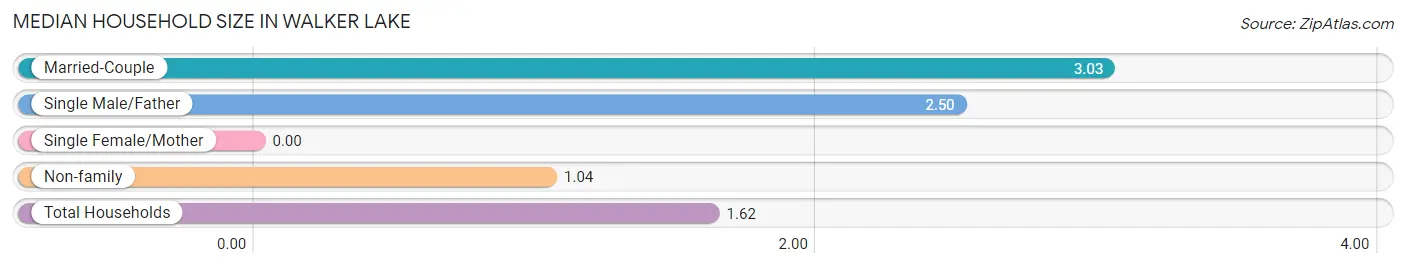
| Household Type | # Households | Household Size |
| Married-Couple | 64 (27.0%) | 3.03 |
| Single Male/Father | 8 (3.4%) | 2.50 |
| Single Female/Mother | 0 (0.0%) | - |
| Non-family | 165 (69.6%) | 1.04 |
| Total Households | 237 (100.0%) | 1.62 |
Household Size by Marriage Status in Walker Lake
Out of a total of 237 households in Walker Lake, 72 (30.4%) are family households, while 165 (69.6%) are nonfamily households. The most numerous type of family households are 2-person households, comprising 43, and the most common type of nonfamily households are 1-person households, comprising 159.
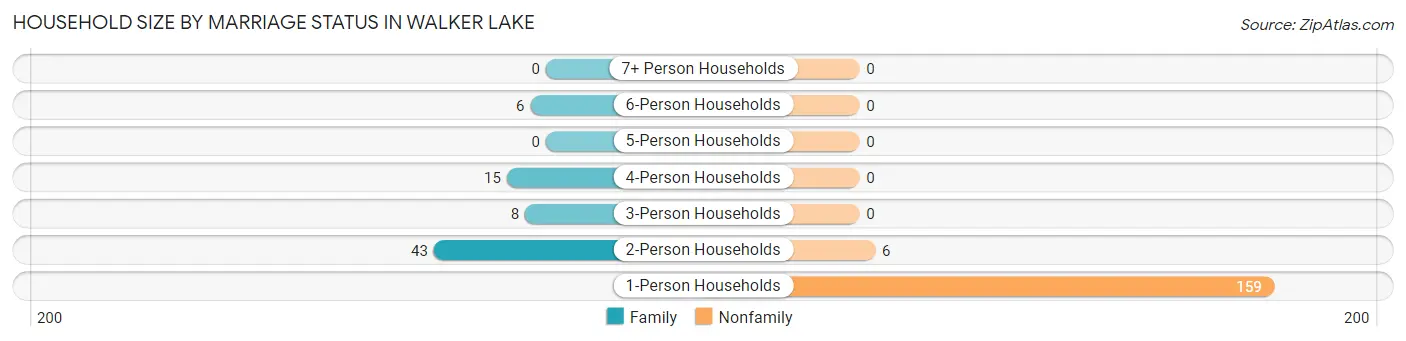
| Household Size | Family Households | Nonfamily Households |
| 1-Person Households | - | 159 (67.1%) |
| 2-Person Households | 43 (18.1%) | 6 (2.5%) |
| 3-Person Households | 8 (3.4%) | 0 (0.0%) |
| 4-Person Households | 15 (6.3%) | 0 (0.0%) |
| 5-Person Households | 0 (0.0%) | 0 (0.0%) |
| 6-Person Households | 6 (2.5%) | 0 (0.0%) |
| 7+ Person Households | 0 (0.0%) | 0 (0.0%) |
| Total | 72 (30.4%) | 165 (69.6%) |
Female Fertility in Walker Lake
Fertility by Age in Walker Lake
| Age Bracket | Women with Births | Births / 1,000 Women |
| 15 to 19 years | 0 (0.0%) | 0.0 |
| 20 to 34 years | 0 (0.0%) | 0.0 |
| 35 to 50 years | 0 (0.0%) | 0.0 |
| Total | 0 (0.0%) | 0.0 |
Fertility by Age by Marriage Status in Walker Lake
| Age Bracket | Married | Unmarried |
| 15 to 19 years | 0 (0.0%) | 0 (0.0%) |
| 20 to 34 years | 0 (0.0%) | 0 (0.0%) |
| 35 to 50 years | 0 (0.0%) | 0 (0.0%) |
| Total | 0 (0.0%) | 0 (0.0%) |
Fertility by Education in Walker Lake
| Educational Attainment | Women with Births | Births / 1,000 Women |
| Less than High School | 0 (0.0%) | 0.0 |
| High School Diploma | 0 (0.0%) | 0.0 |
| College or Associate's Degree | 0 (0.0%) | 0.0 |
| Bachelor's Degree | 0 (0.0%) | 0.0 |
| Graduate Degree | 0 (0.0%) | 0.0 |
| Total | 0 (0.0%) | 0.0 |
Fertility by Education by Marriage Status in Walker Lake
| Educational Attainment | Married | Unmarried |
| Less than High School | 0 (0.0%) | 0 (0.0%) |
| High School Diploma | 0 (0.0%) | 0 (0.0%) |
| College or Associate's Degree | 0 (0.0%) | 0 (0.0%) |
| Bachelor's Degree | 0 (0.0%) | 0 (0.0%) |
| Graduate Degree | 0 (0.0%) | 0 (0.0%) |
| Total | 0 (0.0%) | 0 (0.0%) |
Employment Characteristics in Walker Lake
Employment by Class of Employer in Walker Lake
Among the 83 employed individuals in Walker Lake, private company employees (63 | 75.9%), federal government employees (13 | 15.7%), and not-for-profit organizations (7 | 8.4%) make up the most common classes of employment.
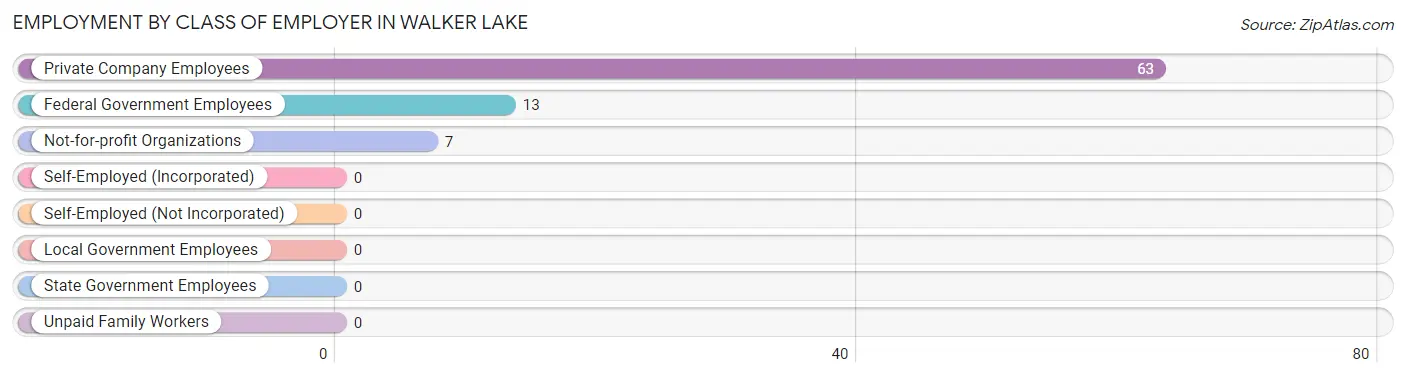
| Employer Class | # Employees | % Employees |
| Private Company Employees | 63 | 75.9% |
| Self-Employed (Incorporated) | 0 | 0.0% |
| Self-Employed (Not Incorporated) | 0 | 0.0% |
| Not-for-profit Organizations | 7 | 8.4% |
| Local Government Employees | 0 | 0.0% |
| State Government Employees | 0 | 0.0% |
| Federal Government Employees | 13 | 15.7% |
| Unpaid Family Workers | 0 | 0.0% |
| Total | 83 | 100.0% |
Employment Status by Age in Walker Lake
According to the labor force statistics for Walker Lake, out of the total population over 16 years of age (335), 28.4% or 95 individuals are in the labor force, with 12.6% or 12 of them unemployed. The age group with the highest labor force participation rate is 16 to 19 years, with 100.0% or 12 individuals in the labor force. Within the labor force, the 16 to 19 years age range has the highest percentage of unemployed individuals, with 100.0% or 12 of them being unemployed.
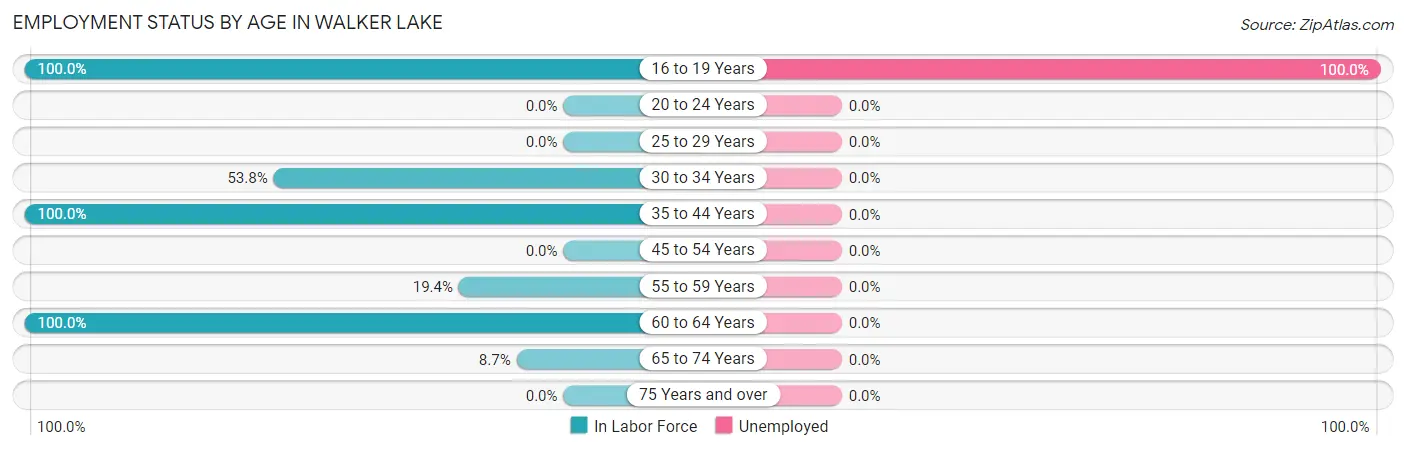
| Age Bracket | In Labor Force | Unemployed |
| 16 to 19 Years | 12 (100.0%) | 12 (100.0%) |
| 20 to 24 Years | 0 (0.0%) | 0 (0.0%) |
| 25 to 29 Years | 0 (0.0%) | 0 (0.0%) |
| 30 to 34 Years | 7 (53.8%) | 0 (0.0%) |
| 35 to 44 Years | 32 (100.0%) | 0 (0.0%) |
| 45 to 54 Years | 0 (0.0%) | 0 (0.0%) |
| 55 to 59 Years | 7 (19.4%) | 0 (0.0%) |
| 60 to 64 Years | 24 (100.0%) | 0 (0.0%) |
| 65 to 74 Years | 13 (8.7%) | 0 (0.0%) |
| 75 Years and over | 0 (0.0%) | 0 (0.0%) |
| Total | 95 (28.4%) | 12 (12.6%) |
Employment Status by Educational Attainment in Walker Lake
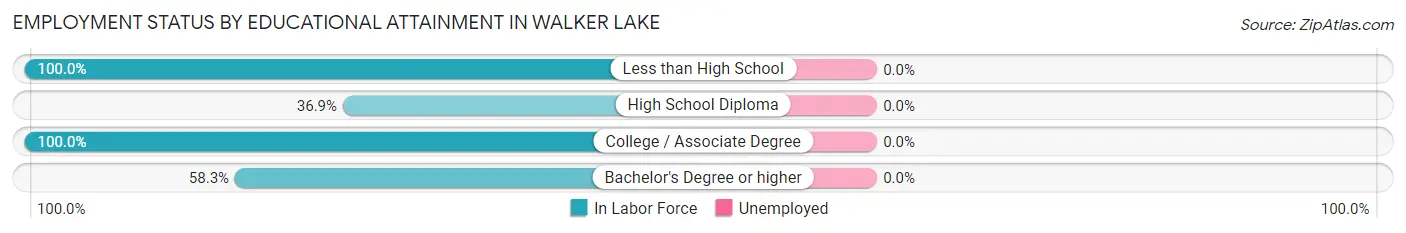
| Educational Attainment | In Labor Force | Unemployed |
| Less than High School | 32 (100.0%) | 0 (0.0%) |
| High School Diploma | 24 (36.9%) | 0 (0.0%) |
| College / Associate Degree | 7 (100.0%) | 0 (0.0%) |
| Bachelor's Degree or higher | 7 (58.3%) | 0 (0.0%) |
| Total | 70 (60.3%) | 0 (0.0%) |
Employment Occupations by Sex in Walker Lake
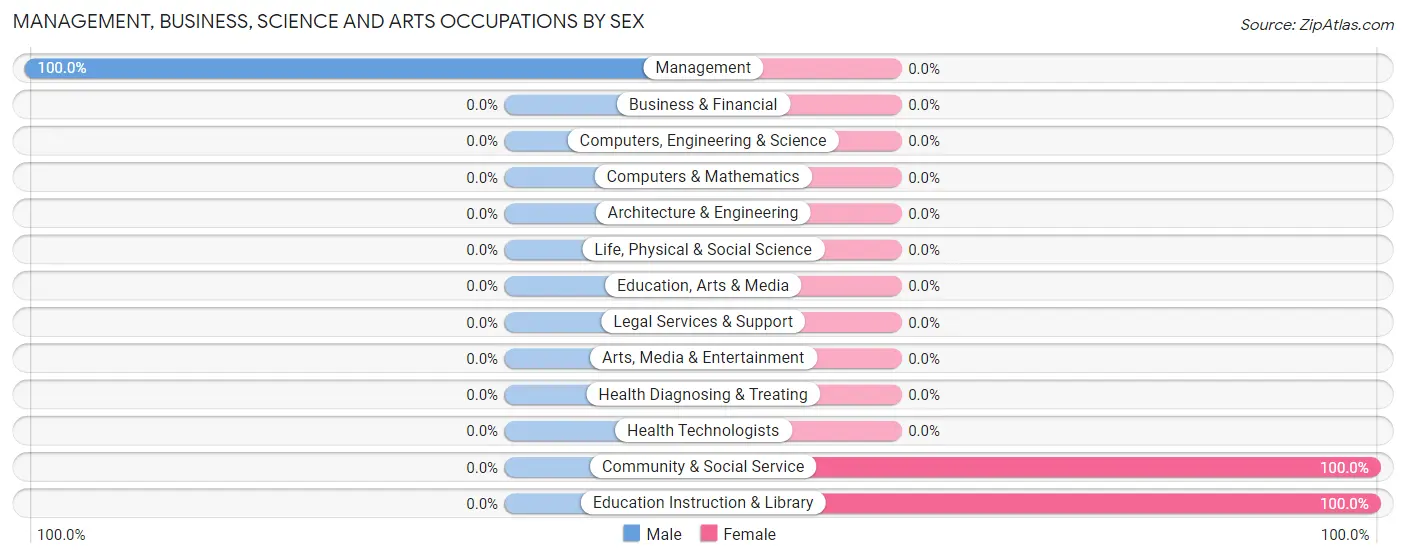
Management, Business, Science and Arts Occupations
The most common Management, Business, Science and Arts occupations in Walker Lake are Management (8 | 9.6%), Community & Social Service (7 | 8.4%), and Education Instruction & Library (7 | 8.4%).
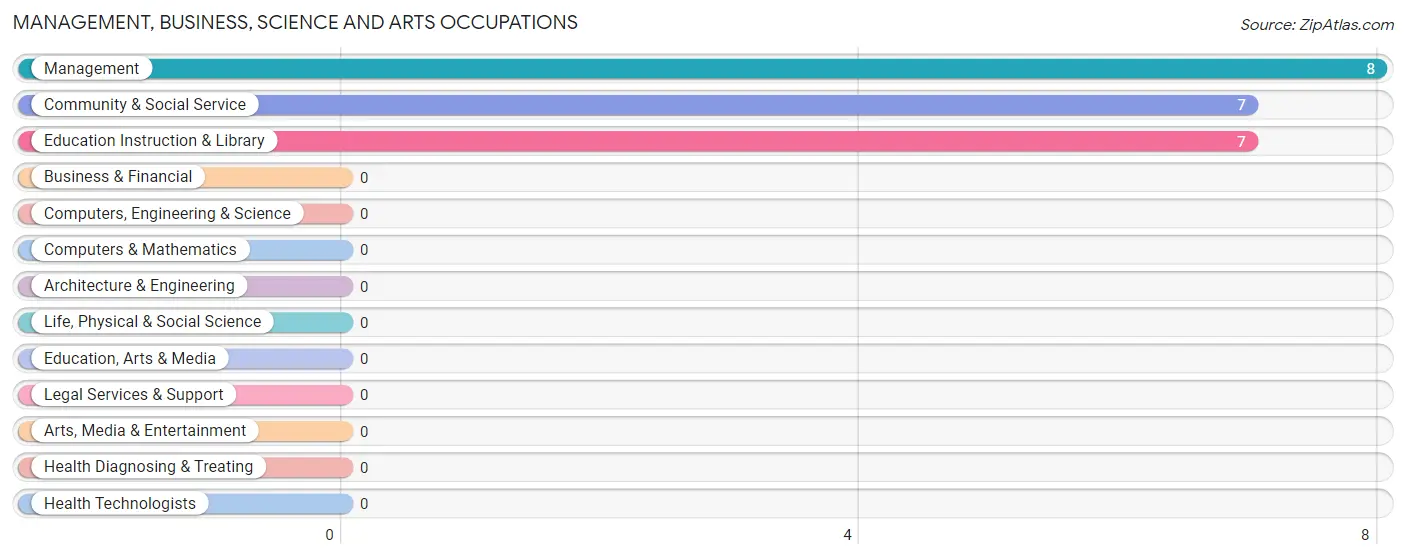
Management, Business, Science and Arts Occupations by Sex
| Occupation | Male | Female |
| Management | 8 (100.0%) | 0 (0.0%) |
| Business & Financial | 0 (0.0%) | 0 (0.0%) |
| Computers, Engineering & Science | 0 (0.0%) | 0 (0.0%) |
| Computers & Mathematics | 0 (0.0%) | 0 (0.0%) |
| Architecture & Engineering | 0 (0.0%) | 0 (0.0%) |
| Life, Physical & Social Science | 0 (0.0%) | 0 (0.0%) |
| Community & Social Service | 0 (0.0%) | 7 (100.0%) |
| Education, Arts & Media | 0 (0.0%) | 0 (0.0%) |
| Legal Services & Support | 0 (0.0%) | 0 (0.0%) |
| Education Instruction & Library | 0 (0.0%) | 7 (100.0%) |
| Arts, Media & Entertainment | 0 (0.0%) | 0 (0.0%) |
| Health Diagnosing & Treating | 0 (0.0%) | 0 (0.0%) |
| Health Technologists | 0 (0.0%) | 0 (0.0%) |
| Total (Category) | 8 (53.3%) | 7 (46.7%) |
| Total (Overall) | 65 (78.3%) | 18 (21.7%) |
Services Occupations
Services Occupations by Sex
| Occupation | Male | Female |
| Healthcare Support | 0 (0.0%) | 0 (0.0%) |
| Security & Protection | 0 (0.0%) | 0 (0.0%) |
| Firefighting & Prevention | 0 (0.0%) | 0 (0.0%) |
| Law Enforcement | 0 (0.0%) | 0 (0.0%) |
| Food Preparation & Serving | 0 (0.0%) | 0 (0.0%) |
| Cleaning & Maintenance | 0 (0.0%) | 0 (0.0%) |
| Personal Care & Service | 0 (0.0%) | 0 (0.0%) |
| Total (Category) | 0 (0.0%) | 0 (0.0%) |
| Total (Overall) | 65 (78.3%) | 18 (21.7%) |
Sales and Office Occupations
The most common Sales and Office occupations in Walker Lake are Sales & Related (17 | 20.5%), and Office & Administration (5 | 6.0%).
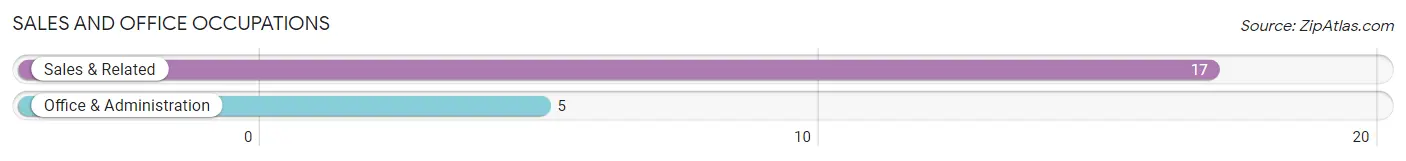
Sales and Office Occupations by Sex
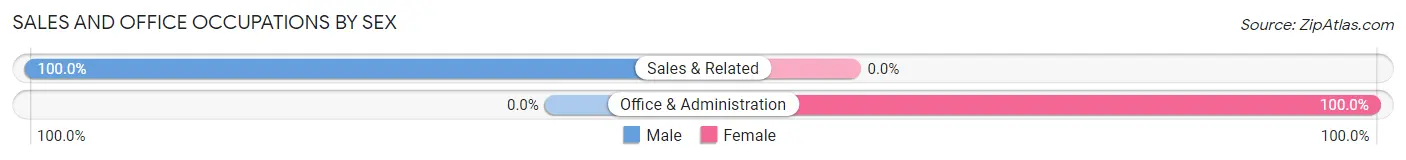
| Occupation | Male | Female |
| Sales & Related | 17 (100.0%) | 0 (0.0%) |
| Office & Administration | 0 (0.0%) | 5 (100.0%) |
| Total (Category) | 17 (77.3%) | 5 (22.7%) |
| Total (Overall) | 65 (78.3%) | 18 (21.7%) |
Natural Resources, Construction and Maintenance Occupations
The most common Natural Resources, Construction and Maintenance occupations in Walker Lake are , and Construction & Extraction (46 | 55.4%).
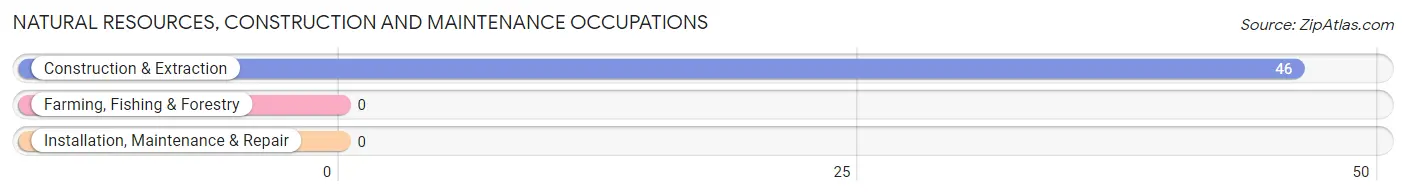
Natural Resources, Construction and Maintenance Occupations by Sex
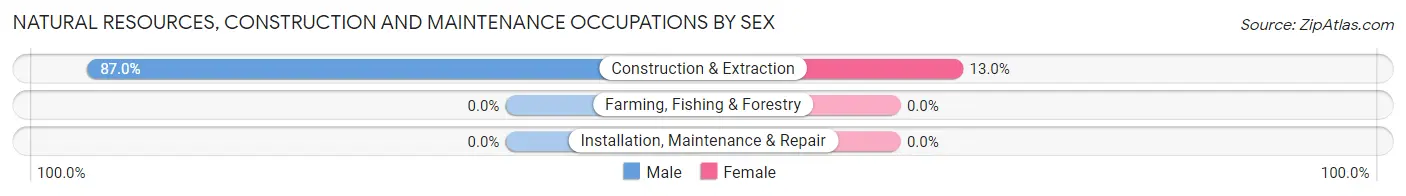
| Occupation | Male | Female |
| Farming, Fishing & Forestry | 0 (0.0%) | 0 (0.0%) |
| Construction & Extraction | 40 (87.0%) | 6 (13.0%) |
| Installation, Maintenance & Repair | 0 (0.0%) | 0 (0.0%) |
| Total (Category) | 40 (87.0%) | 6 (13.0%) |
| Total (Overall) | 65 (78.3%) | 18 (21.7%) |
Production, Transportation and Moving Occupations
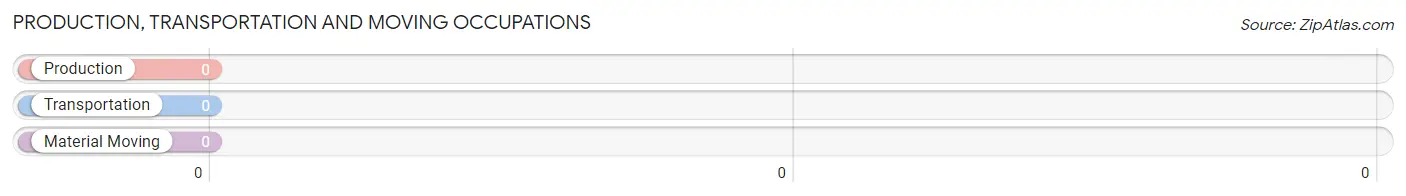
Production, Transportation and Moving Occupations by Sex
| Occupation | Male | Female |
| Production | 0 (0.0%) | 0 (0.0%) |
| Transportation | 0 (0.0%) | 0 (0.0%) |
| Material Moving | 0 (0.0%) | 0 (0.0%) |
| Total (Category) | 0 (0.0%) | 0 (0.0%) |
| Total (Overall) | 65 (78.3%) | 18 (21.7%) |
Employment Industries by Sex in Walker Lake
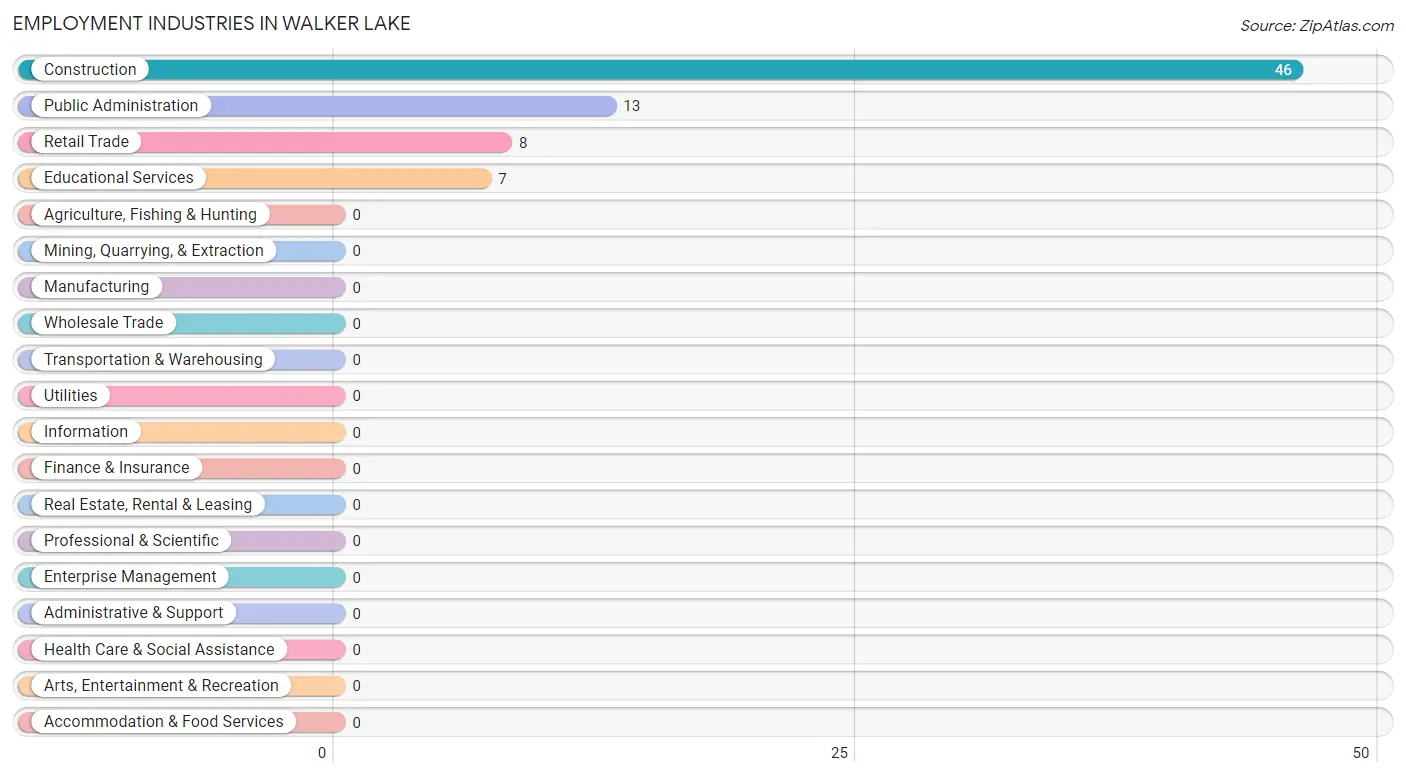
Employment Industries in Walker Lake
The major employment industries in Walker Lake include Construction (46 | 55.4%), Public Administration (13 | 15.7%), Retail Trade (8 | 9.6%), and Educational Services (7 | 8.4%).
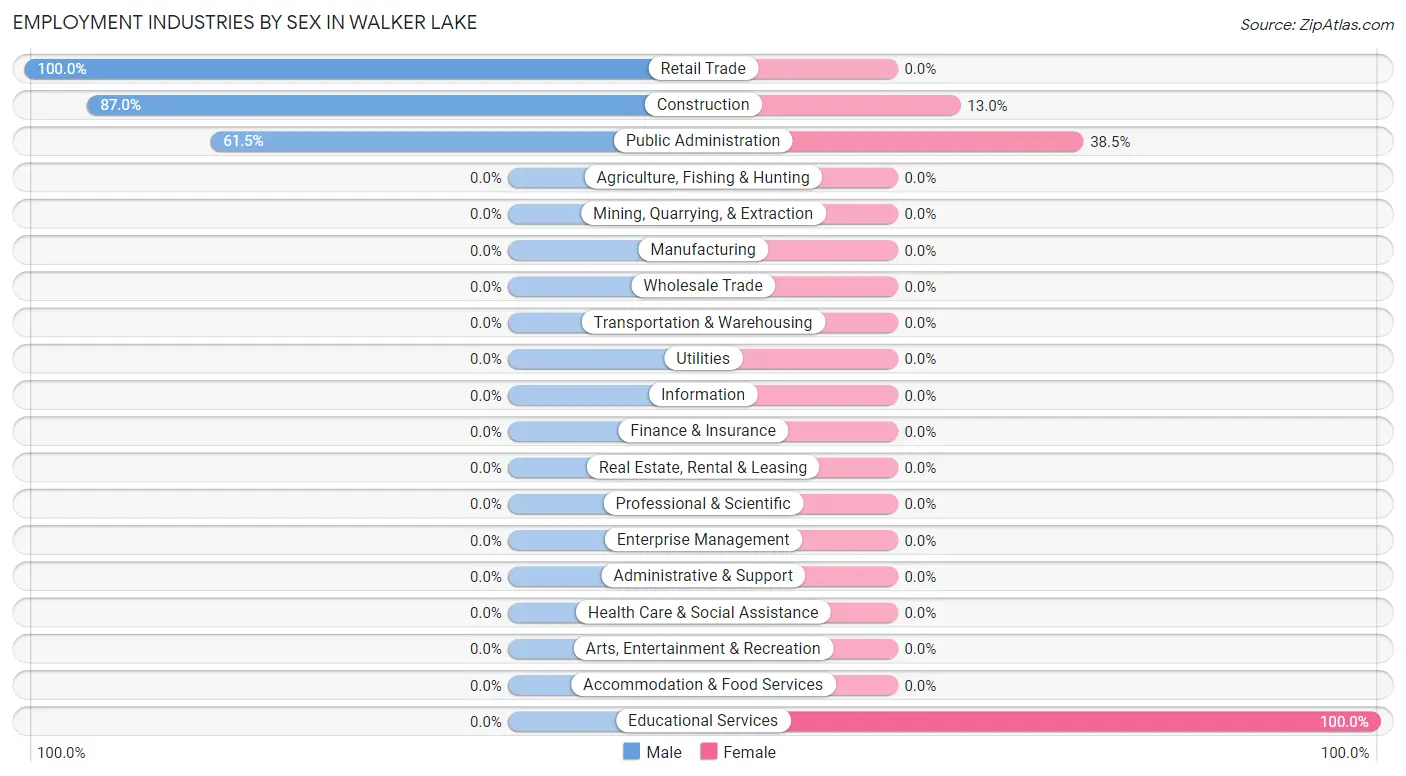
Employment Industries by Sex in Walker Lake
The Walker Lake industries that see more men than women are Retail Trade (100.0%), Construction (87.0%), and Public Administration (61.5%), whereas the industries that tend to have a higher number of women are Educational Services (100.0%), Public Administration (38.5%), and Construction (13.0%).
| Industry | Male | Female |
| Agriculture, Fishing & Hunting | 0 (0.0%) | 0 (0.0%) |
| Mining, Quarrying, & Extraction | 0 (0.0%) | 0 (0.0%) |
| Construction | 40 (87.0%) | 6 (13.0%) |
| Manufacturing | 0 (0.0%) | 0 (0.0%) |
| Wholesale Trade | 0 (0.0%) | 0 (0.0%) |
| Retail Trade | 8 (100.0%) | 0 (0.0%) |
| Transportation & Warehousing | 0 (0.0%) | 0 (0.0%) |
| Utilities | 0 (0.0%) | 0 (0.0%) |
| Information | 0 (0.0%) | 0 (0.0%) |
| Finance & Insurance | 0 (0.0%) | 0 (0.0%) |
| Real Estate, Rental & Leasing | 0 (0.0%) | 0 (0.0%) |
| Professional & Scientific | 0 (0.0%) | 0 (0.0%) |
| Enterprise Management | 0 (0.0%) | 0 (0.0%) |
| Administrative & Support | 0 (0.0%) | 0 (0.0%) |
| Educational Services | 0 (0.0%) | 7 (100.0%) |
| Health Care & Social Assistance | 0 (0.0%) | 0 (0.0%) |
| Arts, Entertainment & Recreation | 0 (0.0%) | 0 (0.0%) |
| Accommodation & Food Services | 0 (0.0%) | 0 (0.0%) |
| Public Administration | 8 (61.5%) | 5 (38.5%) |
| Total | 65 (78.3%) | 18 (21.7%) |
Education in Walker Lake
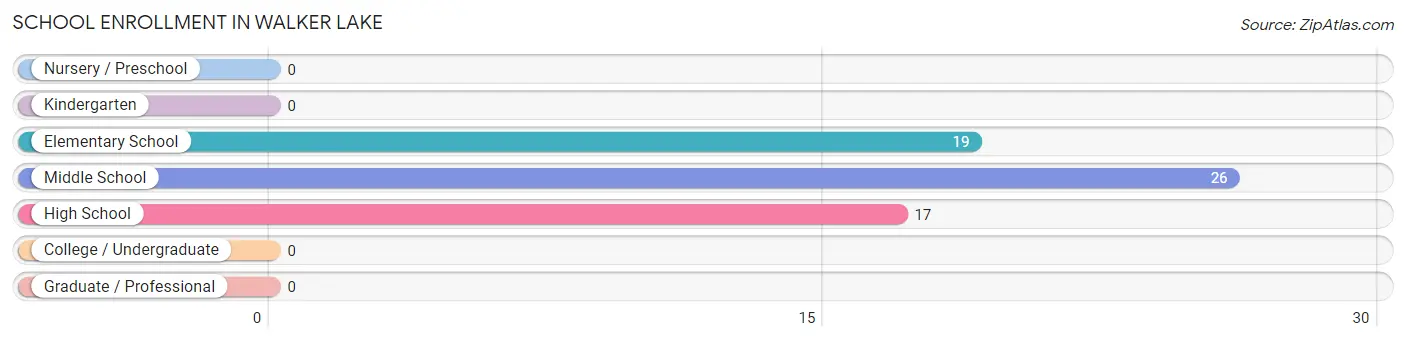
School Enrollment in Walker Lake
The most common levels of schooling among the 62 students in Walker Lake are middle school (26 | 41.9%), elementary school (19 | 30.6%), and high school (17 | 27.4%).
| School Level | # Students | % Students |
| Nursery / Preschool | 0 | 0.0% |
| Kindergarten | 0 | 0.0% |
| Elementary School | 19 | 30.6% |
| Middle School | 26 | 41.9% |
| High School | 17 | 27.4% |
| College / Undergraduate | 0 | 0.0% |
| Graduate / Professional | 0 | 0.0% |
| Total | 62 | 100.0% |
School Enrollment by Age by Funding Source in Walker Lake
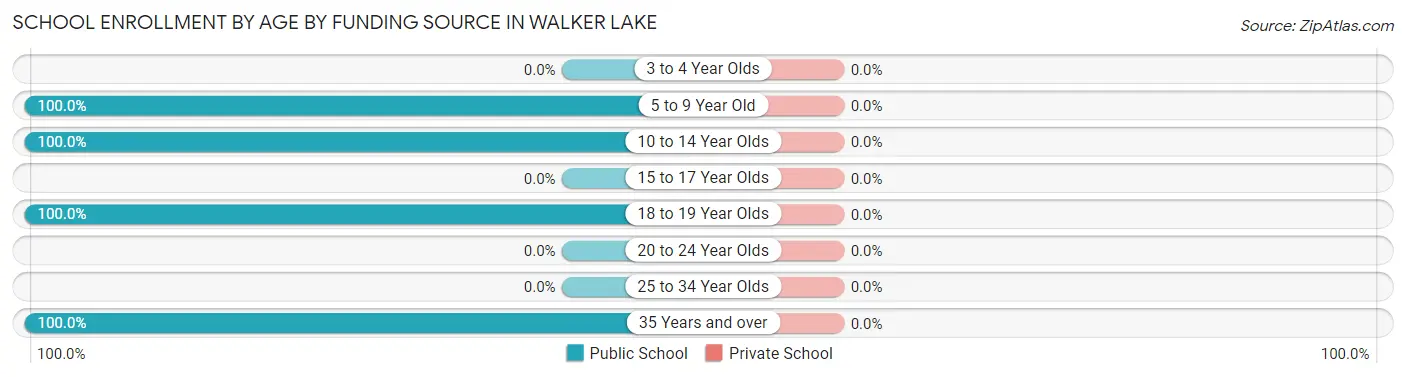
| Age Bracket | Public School | Private School |
| 3 to 4 Year Olds | 0 (0.0%) | 0 (0.0%) |
| 5 to 9 Year Old | 19 (100.0%) | 0 (0.0%) |
| 10 to 14 Year Olds | 26 (100.0%) | 0 (0.0%) |
| 15 to 17 Year Olds | 0 (0.0%) | 0 (0.0%) |
| 18 to 19 Year Olds | 12 (100.0%) | 0 (0.0%) |
| 20 to 24 Year Olds | 0 (0.0%) | 0 (0.0%) |
| 25 to 34 Year Olds | 0 (0.0%) | 0 (0.0%) |
| 35 Years and over | 5 (100.0%) | 0 (0.0%) |
| Total | 62 (100.0%) | 0 (0.0%) |
Educational Attainment by Field of Study in Walker Lake
Arts & humanities (8 | 40.0%), liberal arts & history (7 | 35.0%), and physical & health sciences (5 | 25.0%) are the most common fields of study among 20 individuals in Walker Lake who have obtained a bachelor's degree or higher.
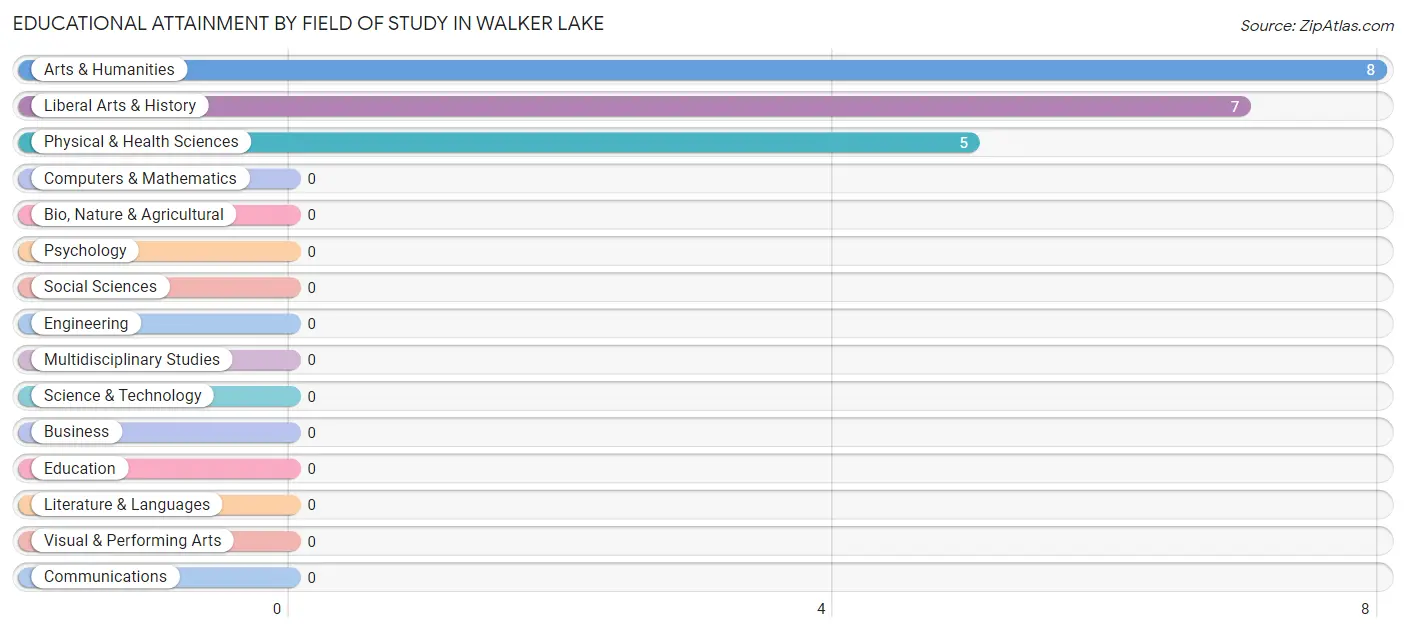
| Field of Study | # Graduates | % Graduates |
| Computers & Mathematics | 0 | 0.0% |
| Bio, Nature & Agricultural | 0 | 0.0% |
| Physical & Health Sciences | 5 | 25.0% |
| Psychology | 0 | 0.0% |
| Social Sciences | 0 | 0.0% |
| Engineering | 0 | 0.0% |
| Multidisciplinary Studies | 0 | 0.0% |
| Science & Technology | 0 | 0.0% |
| Business | 0 | 0.0% |
| Education | 0 | 0.0% |
| Literature & Languages | 0 | 0.0% |
| Liberal Arts & History | 7 | 35.0% |
| Visual & Performing Arts | 0 | 0.0% |
| Communications | 0 | 0.0% |
| Arts & Humanities | 8 | 40.0% |
| Total | 20 | 100.0% |
Transportation & Commute in Walker Lake
Vehicle Availability by Sex in Walker Lake
The most prevalent vehicle ownership categories in Walker Lake are males with 2 vehicles (41, accounting for 63.1%) and females with 2 vehicles (7, making up 227.8%).
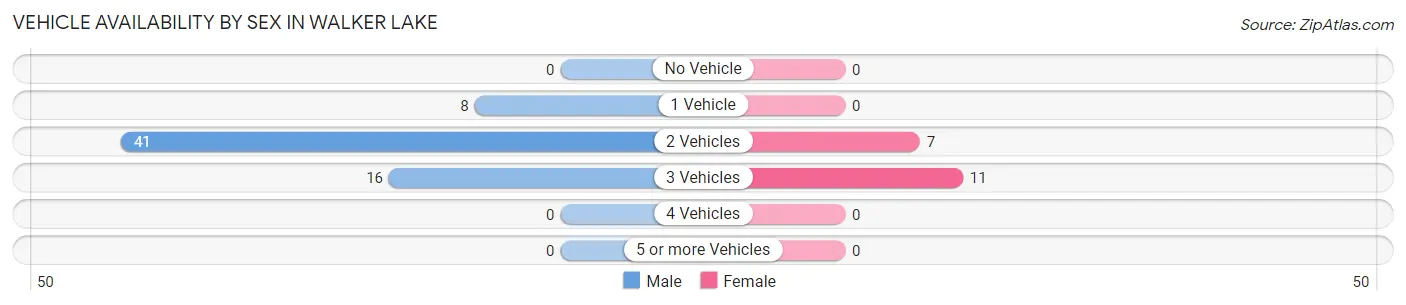
| Vehicles Available | Male | Female |
| No Vehicle | 0 (0.0%) | 0 (0.0%) |
| 1 Vehicle | 8 (12.3%) | 0 (0.0%) |
| 2 Vehicles | 41 (63.1%) | 7 (38.9%) |
| 3 Vehicles | 16 (24.6%) | 11 (61.1%) |
| 4 Vehicles | 0 (0.0%) | 0 (0.0%) |
| 5 or more Vehicles | 0 (0.0%) | 0 (0.0%) |
| Total | 65 (100.0%) | 18 (100.0%) |
Commute Time in Walker Lake
The most frequently occuring commute durations in Walker Lake are 15 to 19 minutes (25 commuters, 32.9%), 10 to 14 minutes (24 commuters, 31.6%), and 90 or more minutes (13 commuters, 17.1%).
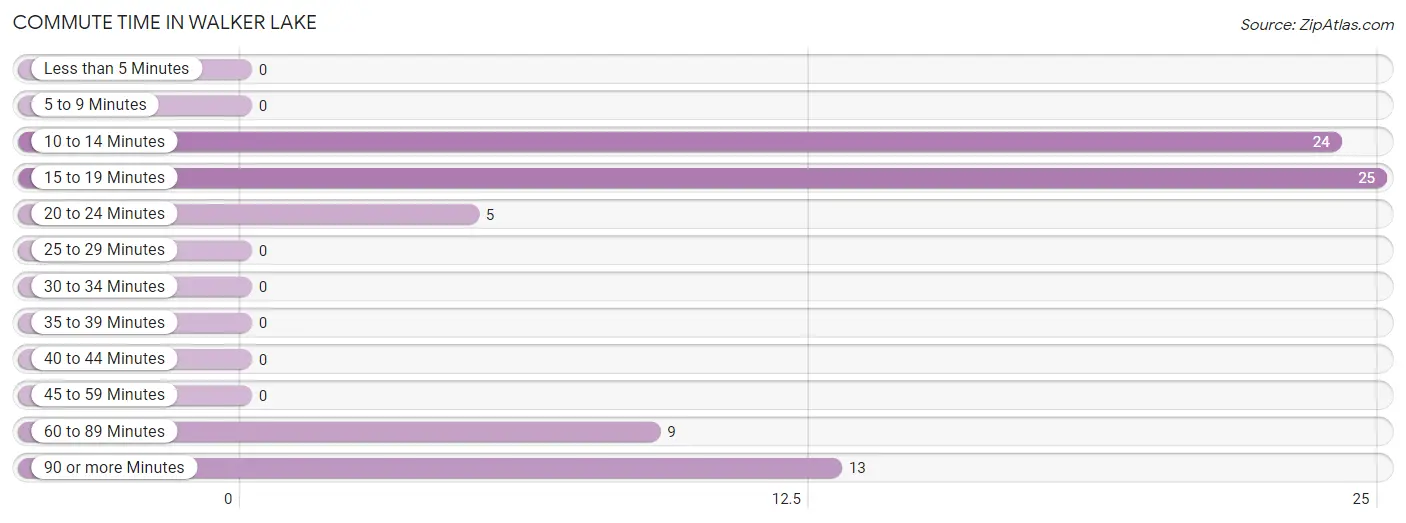
| Commute Time | # Commuters | % Commuters |
| Less than 5 Minutes | 0 | 0.0% |
| 5 to 9 Minutes | 0 | 0.0% |
| 10 to 14 Minutes | 24 | 31.6% |
| 15 to 19 Minutes | 25 | 32.9% |
| 20 to 24 Minutes | 5 | 6.6% |
| 25 to 29 Minutes | 0 | 0.0% |
| 30 to 34 Minutes | 0 | 0.0% |
| 35 to 39 Minutes | 0 | 0.0% |
| 40 to 44 Minutes | 0 | 0.0% |
| 45 to 59 Minutes | 0 | 0.0% |
| 60 to 89 Minutes | 9 | 11.8% |
| 90 or more Minutes | 13 | 17.1% |
Commute Time by Sex in Walker Lake
The most common commute times in Walker Lake are 15 to 19 minutes (25 commuters, 38.5%) for males and 90 or more minutes (6 commuters, 54.5%) for females.
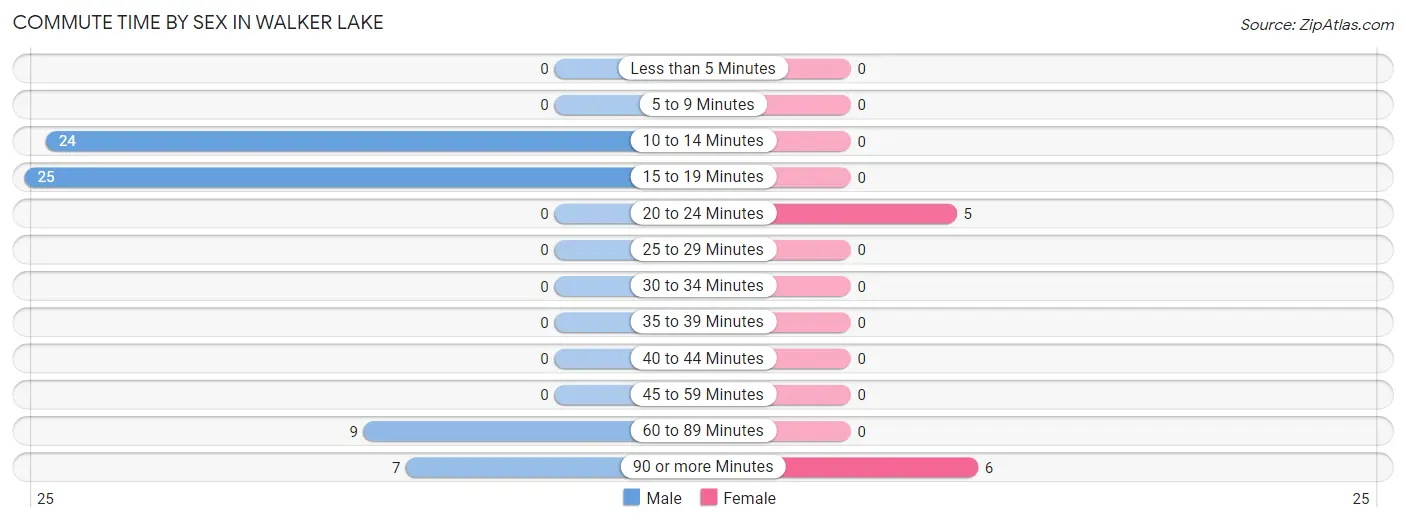
| Commute Time | Male | Female |
| Less than 5 Minutes | 0 (0.0%) | 0 (0.0%) |
| 5 to 9 Minutes | 0 (0.0%) | 0 (0.0%) |
| 10 to 14 Minutes | 24 (36.9%) | 0 (0.0%) |
| 15 to 19 Minutes | 25 (38.5%) | 0 (0.0%) |
| 20 to 24 Minutes | 0 (0.0%) | 5 (45.5%) |
| 25 to 29 Minutes | 0 (0.0%) | 0 (0.0%) |
| 30 to 34 Minutes | 0 (0.0%) | 0 (0.0%) |
| 35 to 39 Minutes | 0 (0.0%) | 0 (0.0%) |
| 40 to 44 Minutes | 0 (0.0%) | 0 (0.0%) |
| 45 to 59 Minutes | 0 (0.0%) | 0 (0.0%) |
| 60 to 89 Minutes | 9 (13.9%) | 0 (0.0%) |
| 90 or more Minutes | 7 (10.8%) | 6 (54.5%) |
Time of Departure to Work by Sex in Walker Lake
The most frequent times of departure to work in Walker Lake are 6:30 AM to 6:59 AM (23, 35.4%) for males and 6:30 AM to 6:59 AM (6, 54.5%) for females.
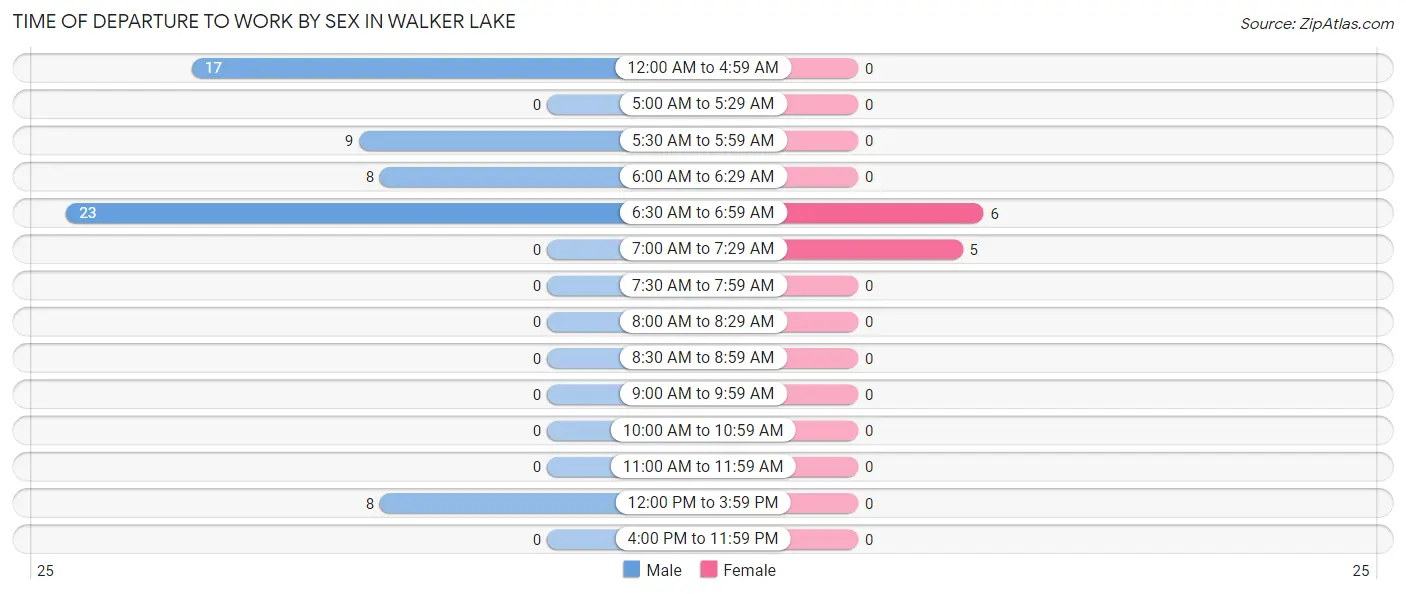
| Time of Departure | Male | Female |
| 12:00 AM to 4:59 AM | 17 (26.2%) | 0 (0.0%) |
| 5:00 AM to 5:29 AM | 0 (0.0%) | 0 (0.0%) |
| 5:30 AM to 5:59 AM | 9 (13.9%) | 0 (0.0%) |
| 6:00 AM to 6:29 AM | 8 (12.3%) | 0 (0.0%) |
| 6:30 AM to 6:59 AM | 23 (35.4%) | 6 (54.5%) |
| 7:00 AM to 7:29 AM | 0 (0.0%) | 5 (45.5%) |
| 7:30 AM to 7:59 AM | 0 (0.0%) | 0 (0.0%) |
| 8:00 AM to 8:29 AM | 0 (0.0%) | 0 (0.0%) |
| 8:30 AM to 8:59 AM | 0 (0.0%) | 0 (0.0%) |
| 9:00 AM to 9:59 AM | 0 (0.0%) | 0 (0.0%) |
| 10:00 AM to 10:59 AM | 0 (0.0%) | 0 (0.0%) |
| 11:00 AM to 11:59 AM | 0 (0.0%) | 0 (0.0%) |
| 12:00 PM to 3:59 PM | 8 (12.3%) | 0 (0.0%) |
| 4:00 PM to 11:59 PM | 0 (0.0%) | 0 (0.0%) |
| Total | 65 (100.0%) | 11 (100.0%) |
Housing Occupancy in Walker Lake
Occupancy by Ownership in Walker Lake
Of the total 237 dwellings in Walker Lake, owner-occupied units account for 193 (81.4%), while renter-occupied units make up 44 (18.6%).
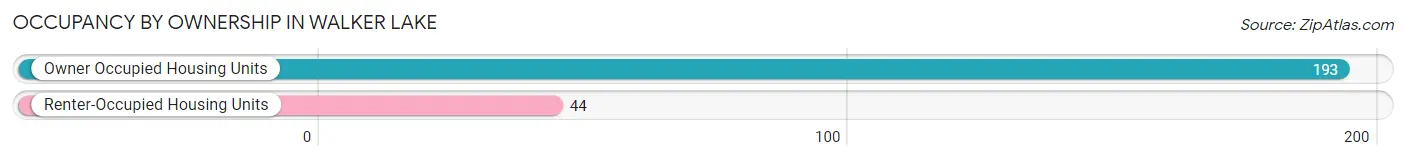
| Occupancy | # Housing Units | % Housing Units |
| Owner Occupied Housing Units | 193 | 81.4% |
| Renter-Occupied Housing Units | 44 | 18.6% |
| Total Occupied Housing Units | 237 | 100.0% |
Occupancy by Household Size in Walker Lake
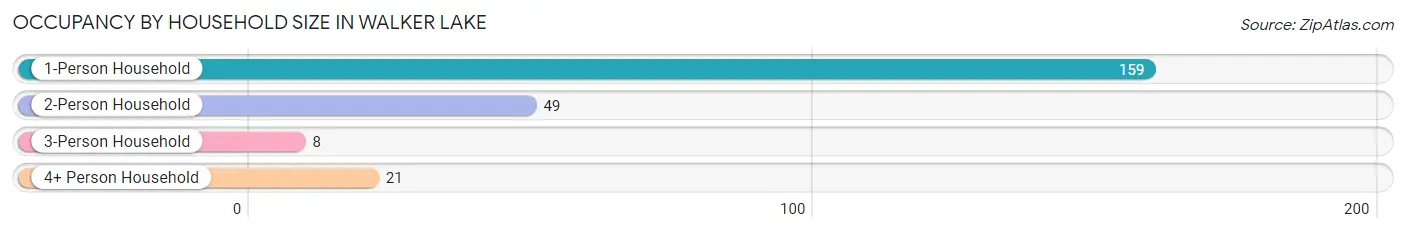
| Household Size | # Housing Units | % Housing Units |
| 1-Person Household | 159 | 67.1% |
| 2-Person Household | 49 | 20.7% |
| 3-Person Household | 8 | 3.4% |
| 4+ Person Household | 21 | 8.9% |
| Total Housing Units | 237 | 100.0% |
Occupancy by Ownership by Household Size in Walker Lake
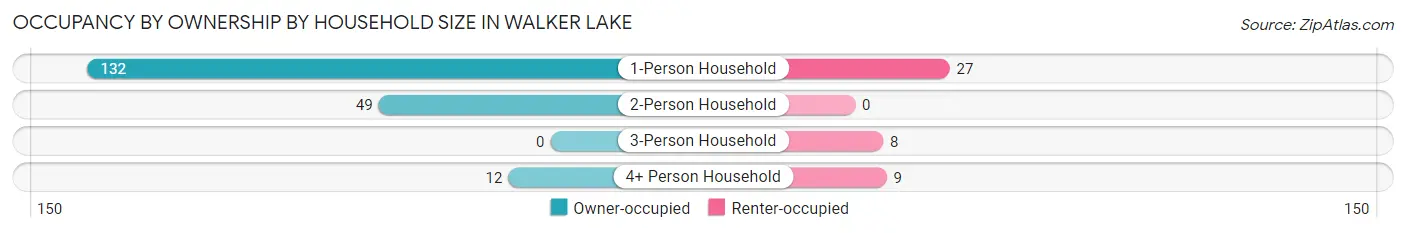
| Household Size | Owner-occupied | Renter-occupied |
| 1-Person Household | 132 (83.0%) | 27 (17.0%) |
| 2-Person Household | 49 (100.0%) | 0 (0.0%) |
| 3-Person Household | 0 (0.0%) | 8 (100.0%) |
| 4+ Person Household | 12 (57.1%) | 9 (42.9%) |
| Total Housing Units | 193 (81.4%) | 44 (18.6%) |
Occupancy by Educational Attainment in Walker Lake
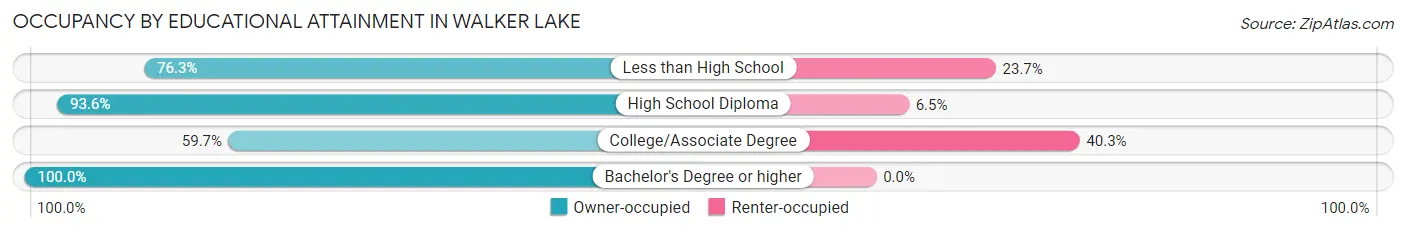
| Household Size | Owner-occupied | Renter-occupied |
| Less than High School | 29 (76.3%) | 9 (23.7%) |
| High School Diploma | 116 (93.5%) | 8 (6.5%) |
| College/Associate Degree | 40 (59.7%) | 27 (40.3%) |
| Bachelor's Degree or higher | 8 (100.0%) | 0 (0.0%) |
Occupancy by Age of Householder in Walker Lake
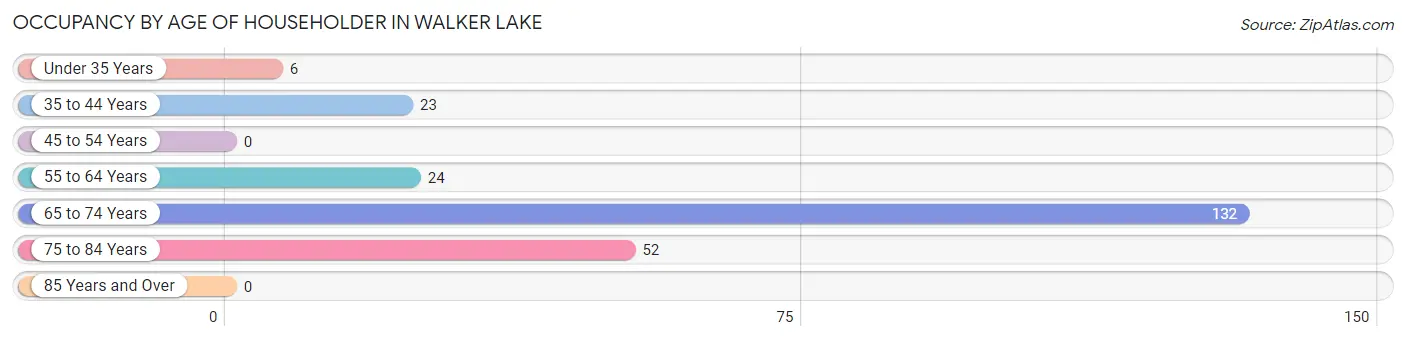
| Age Bracket | # Households | % Households |
| Under 35 Years | 6 | 2.5% |
| 35 to 44 Years | 23 | 9.7% |
| 45 to 54 Years | 0 | 0.0% |
| 55 to 64 Years | 24 | 10.1% |
| 65 to 74 Years | 132 | 55.7% |
| 75 to 84 Years | 52 | 21.9% |
| 85 Years and Over | 0 | 0.0% |
| Total | 237 | 100.0% |
Housing Finances in Walker Lake
Median Income by Occupancy in Walker Lake
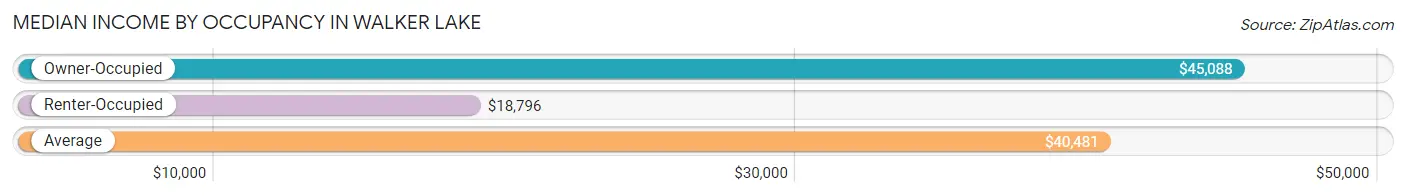
| Occupancy Type | # Households | Median Income |
| Owner-Occupied | 193 (81.4%) | $45,088 |
| Renter-Occupied | 44 (18.6%) | $18,796 |
| Average | 237 (100.0%) | $40,481 |
Occupancy by Householder Income Bracket in Walker Lake
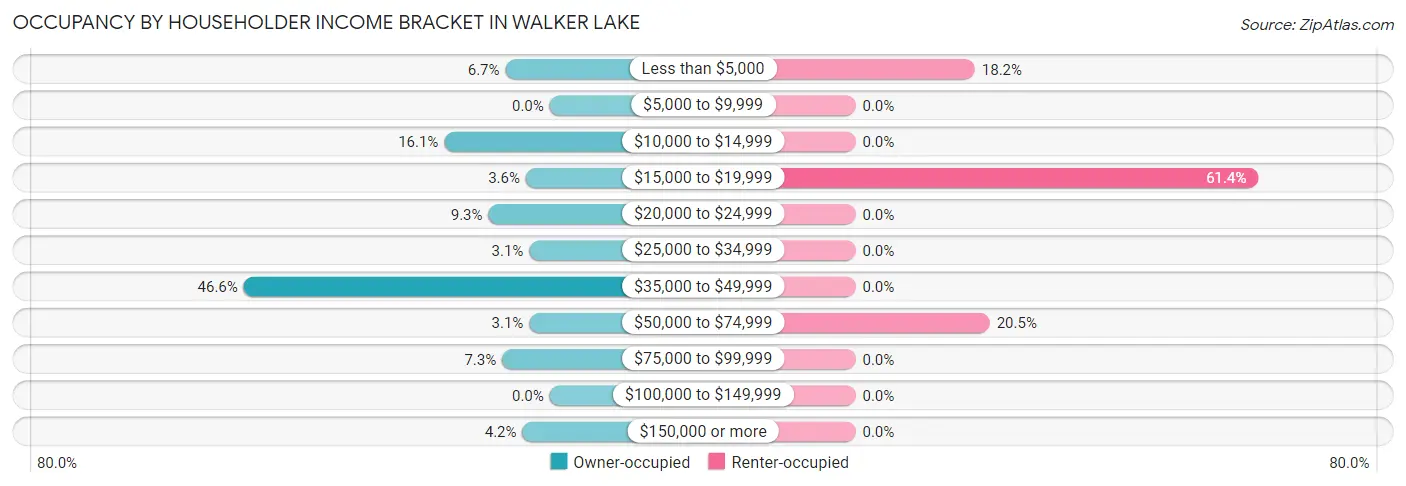
| Income Bracket | Owner-occupied | Renter-occupied |
| Less than $5,000 | 13 (6.7%) | 8 (18.2%) |
| $5,000 to $9,999 | 0 (0.0%) | 0 (0.0%) |
| $10,000 to $14,999 | 31 (16.1%) | 0 (0.0%) |
| $15,000 to $19,999 | 7 (3.6%) | 27 (61.4%) |
| $20,000 to $24,999 | 18 (9.3%) | 0 (0.0%) |
| $25,000 to $34,999 | 6 (3.1%) | 0 (0.0%) |
| $35,000 to $49,999 | 90 (46.6%) | 0 (0.0%) |
| $50,000 to $74,999 | 6 (3.1%) | 9 (20.4%) |
| $75,000 to $99,999 | 14 (7.2%) | 0 (0.0%) |
| $100,000 to $149,999 | 0 (0.0%) | 0 (0.0%) |
| $150,000 or more | 8 (4.2%) | 0 (0.0%) |
| Total | 193 (100.0%) | 44 (100.0%) |
Monthly Housing Cost Tiers in Walker Lake
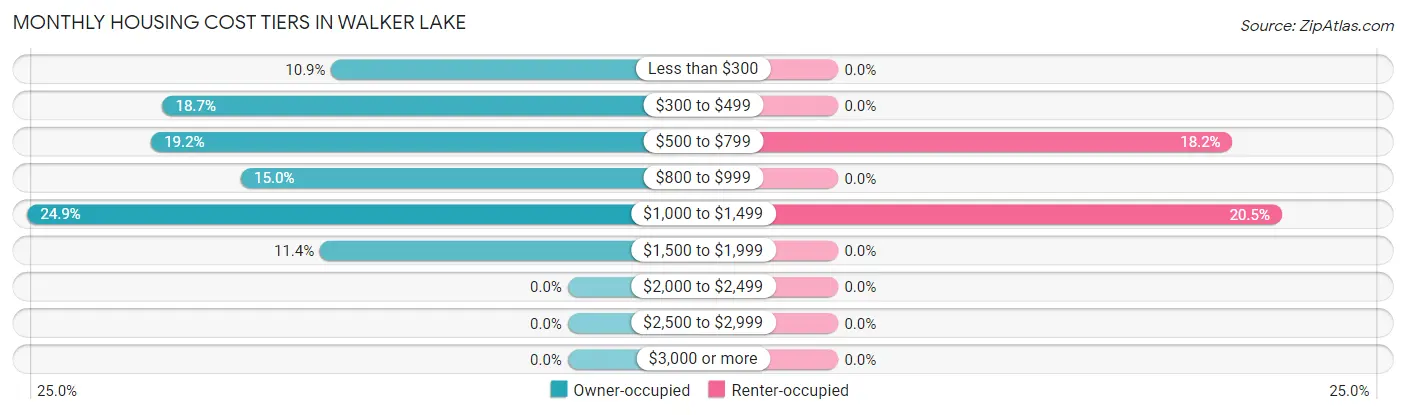
| Monthly Cost | Owner-occupied | Renter-occupied |
| Less than $300 | 21 (10.9%) | 0 (0.0%) |
| $300 to $499 | 36 (18.6%) | 0 (0.0%) |
| $500 to $799 | 37 (19.2%) | 8 (18.2%) |
| $800 to $999 | 29 (15.0%) | 0 (0.0%) |
| $1,000 to $1,499 | 48 (24.9%) | 9 (20.4%) |
| $1,500 to $1,999 | 22 (11.4%) | 0 (0.0%) |
| $2,000 to $2,499 | 0 (0.0%) | 0 (0.0%) |
| $2,500 to $2,999 | 0 (0.0%) | 0 (0.0%) |
| $3,000 or more | 0 (0.0%) | 0 (0.0%) |
| Total | 193 (100.0%) | 44 (100.0%) |
Physical Housing Characteristics in Walker Lake
Housing Structures in Walker Lake
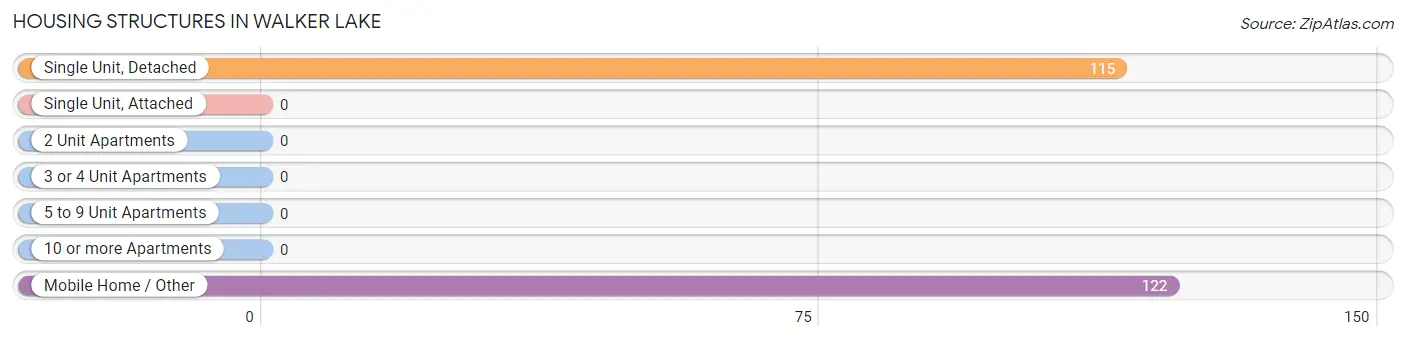
| Structure Type | # Housing Units | % Housing Units |
| Single Unit, Detached | 115 | 48.5% |
| Single Unit, Attached | 0 | 0.0% |
| 2 Unit Apartments | 0 | 0.0% |
| 3 or 4 Unit Apartments | 0 | 0.0% |
| 5 to 9 Unit Apartments | 0 | 0.0% |
| 10 or more Apartments | 0 | 0.0% |
| Mobile Home / Other | 122 | 51.5% |
| Total | 237 | 100.0% |
Housing Structures by Occupancy in Walker Lake
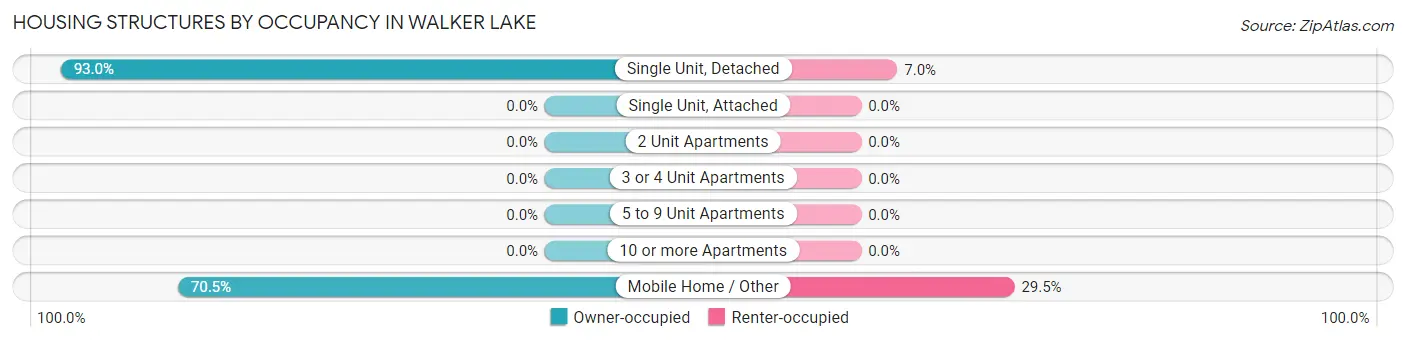
| Structure Type | Owner-occupied | Renter-occupied |
| Single Unit, Detached | 107 (93.0%) | 8 (7.0%) |
| Single Unit, Attached | 0 (0.0%) | 0 (0.0%) |
| 2 Unit Apartments | 0 (0.0%) | 0 (0.0%) |
| 3 or 4 Unit Apartments | 0 (0.0%) | 0 (0.0%) |
| 5 to 9 Unit Apartments | 0 (0.0%) | 0 (0.0%) |
| 10 or more Apartments | 0 (0.0%) | 0 (0.0%) |
| Mobile Home / Other | 86 (70.5%) | 36 (29.5%) |
| Total | 193 (81.4%) | 44 (18.6%) |
Housing Structures by Number of Rooms in Walker Lake
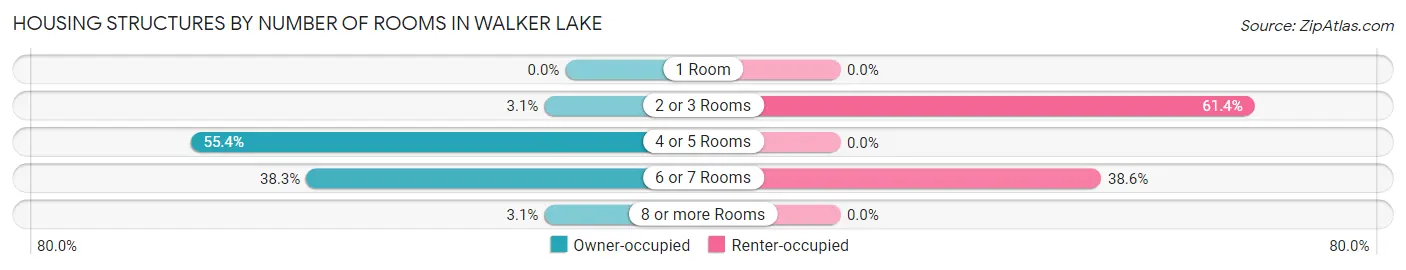
| Number of Rooms | Owner-occupied | Renter-occupied |
| 1 Room | 0 (0.0%) | 0 (0.0%) |
| 2 or 3 Rooms | 6 (3.1%) | 27 (61.4%) |
| 4 or 5 Rooms | 107 (55.4%) | 0 (0.0%) |
| 6 or 7 Rooms | 74 (38.3%) | 17 (38.6%) |
| 8 or more Rooms | 6 (3.1%) | 0 (0.0%) |
| Total | 193 (100.0%) | 44 (100.0%) |
Housing Structure by Heating Type in Walker Lake
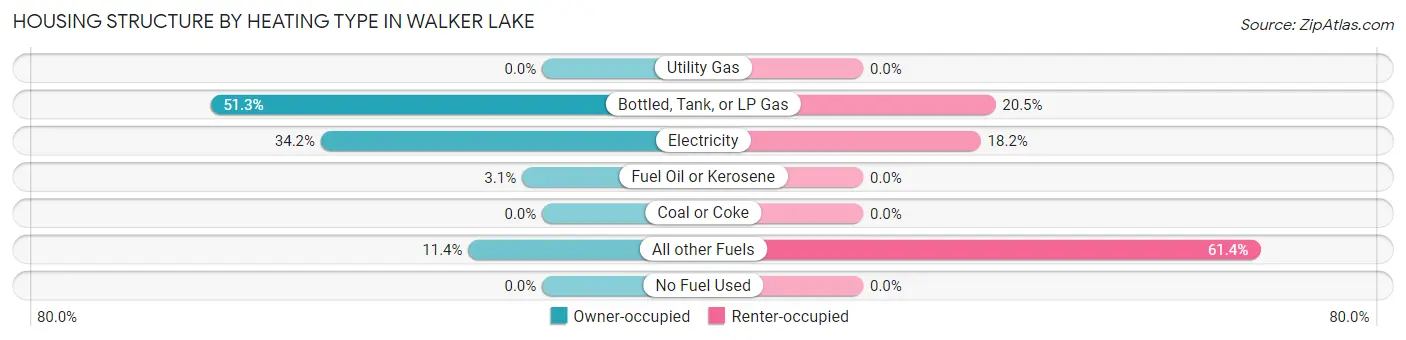
| Heating Type | Owner-occupied | Renter-occupied |
| Utility Gas | 0 (0.0%) | 0 (0.0%) |
| Bottled, Tank, or LP Gas | 99 (51.3%) | 9 (20.4%) |
| Electricity | 66 (34.2%) | 8 (18.2%) |
| Fuel Oil or Kerosene | 6 (3.1%) | 0 (0.0%) |
| Coal or Coke | 0 (0.0%) | 0 (0.0%) |
| All other Fuels | 22 (11.4%) | 27 (61.4%) |
| No Fuel Used | 0 (0.0%) | 0 (0.0%) |
| Total | 193 (100.0%) | 44 (100.0%) |
Household Vehicle Usage in Walker Lake
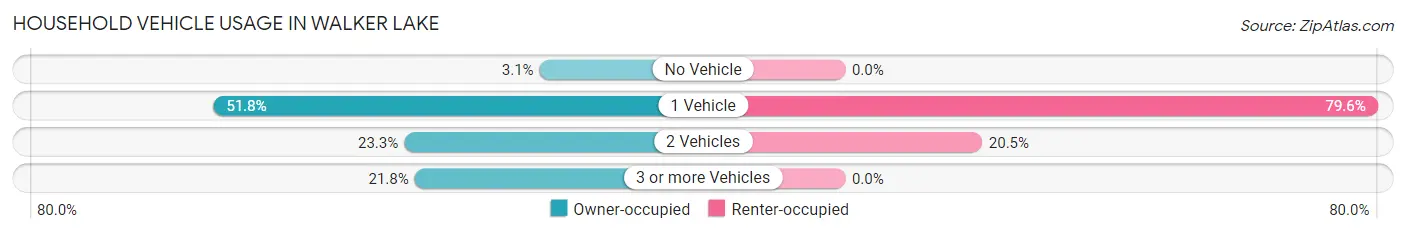
| Vehicles per Household | Owner-occupied | Renter-occupied |
| No Vehicle | 6 (3.1%) | 0 (0.0%) |
| 1 Vehicle | 100 (51.8%) | 35 (79.5%) |
| 2 Vehicles | 45 (23.3%) | 9 (20.4%) |
| 3 or more Vehicles | 42 (21.8%) | 0 (0.0%) |
| Total | 193 (100.0%) | 44 (100.0%) |
Real Estate & Mortgages in Walker Lake
Real Estate and Mortgage Overview in Walker Lake
| Characteristic | Without Mortgage | With Mortgage |
| Housing Units | 87 | 106 |
| Median Property Value | $122,900 | $215,200 |
| Median Household Income | $14,960 | $8 |
| Monthly Housing Costs | $349 | $0 |
| Real Estate Taxes | $1,192 | $17 |
Property Value by Mortgage Status in Walker Lake
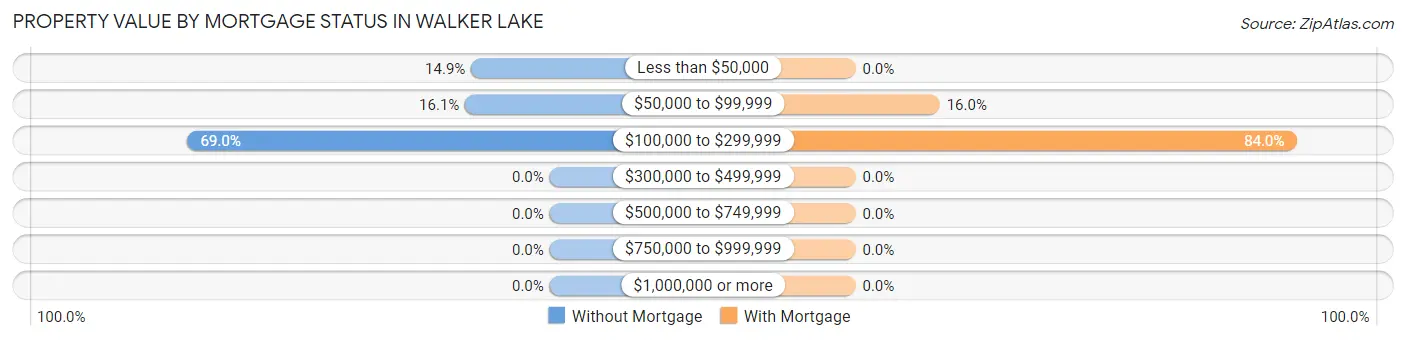
| Property Value | Without Mortgage | With Mortgage |
| Less than $50,000 | 13 (14.9%) | 0 (0.0%) |
| $50,000 to $99,999 | 14 (16.1%) | 17 (16.0%) |
| $100,000 to $299,999 | 60 (69.0%) | 89 (84.0%) |
| $300,000 to $499,999 | 0 (0.0%) | 0 (0.0%) |
| $500,000 to $749,999 | 0 (0.0%) | 0 (0.0%) |
| $750,000 to $999,999 | 0 (0.0%) | 0 (0.0%) |
| $1,000,000 or more | 0 (0.0%) | 0 (0.0%) |
| Total | 87 (100.0%) | 106 (100.0%) |
Household Income by Mortgage Status in Walker Lake
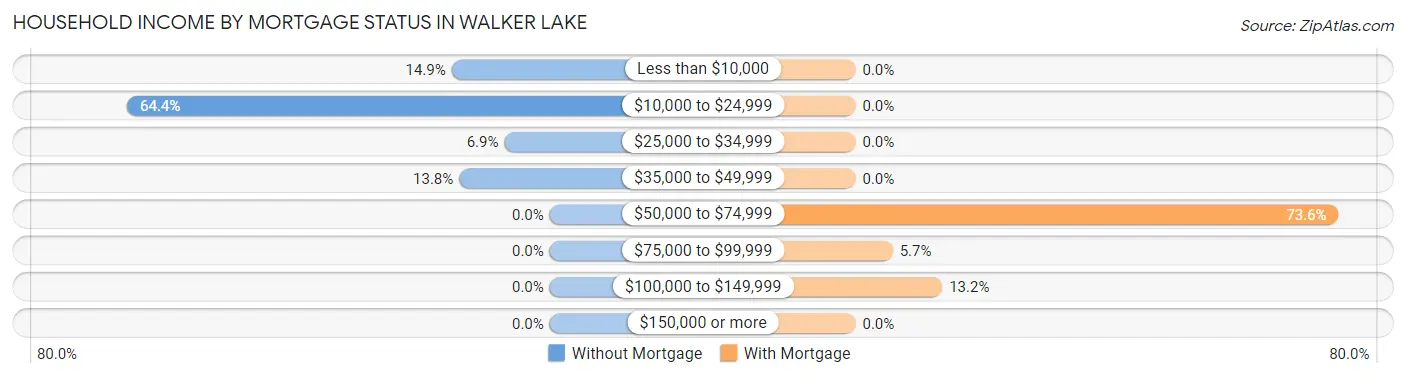
| Household Income | Without Mortgage | With Mortgage |
| Less than $10,000 | 13 (14.9%) | 0 (0.0%) |
| $10,000 to $24,999 | 56 (64.4%) | 0 (0.0%) |
| $25,000 to $34,999 | 6 (6.9%) | 0 (0.0%) |
| $35,000 to $49,999 | 12 (13.8%) | 0 (0.0%) |
| $50,000 to $74,999 | 0 (0.0%) | 78 (73.6%) |
| $75,000 to $99,999 | 0 (0.0%) | 6 (5.7%) |
| $100,000 to $149,999 | 0 (0.0%) | 14 (13.2%) |
| $150,000 or more | 0 (0.0%) | 0 (0.0%) |
| Total | 87 (100.0%) | 106 (100.0%) |
Property Value to Household Income Ratio in Walker Lake
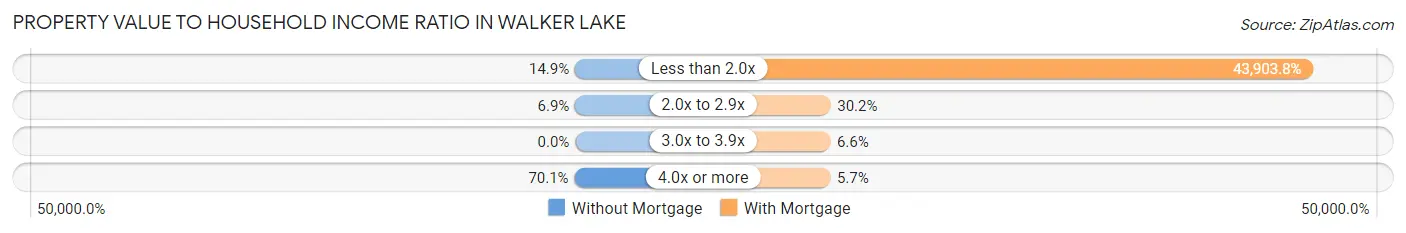
| Value-to-Income Ratio | Without Mortgage | With Mortgage |
| Less than 2.0x | 13 (14.9%) | 46,538 (43,903.8%) |
| 2.0x to 2.9x | 6 (6.9%) | 32 (30.2%) |
| 3.0x to 3.9x | 0 (0.0%) | 7 (6.6%) |
| 4.0x or more | 61 (70.1%) | 6 (5.7%) |
| Total | 87 (100.0%) | 106 (100.0%) |
Real Estate Taxes by Mortgage Status in Walker Lake
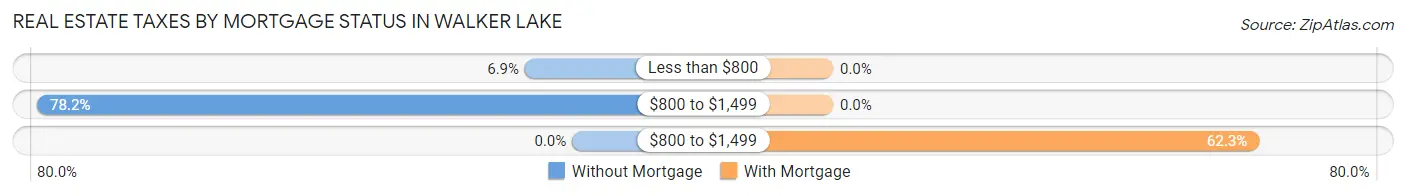
| Property Taxes | Without Mortgage | With Mortgage |
| Less than $800 | 6 (6.9%) | 0 (0.0%) |
| $800 to $1,499 | 68 (78.2%) | 0 (0.0%) |
| $800 to $1,499 | 0 (0.0%) | 66 (62.3%) |
| Total | 87 (100.0%) | 106 (100.0%) |
Health & Disability in Walker Lake
Health Insurance Coverage by Age in Walker Lake
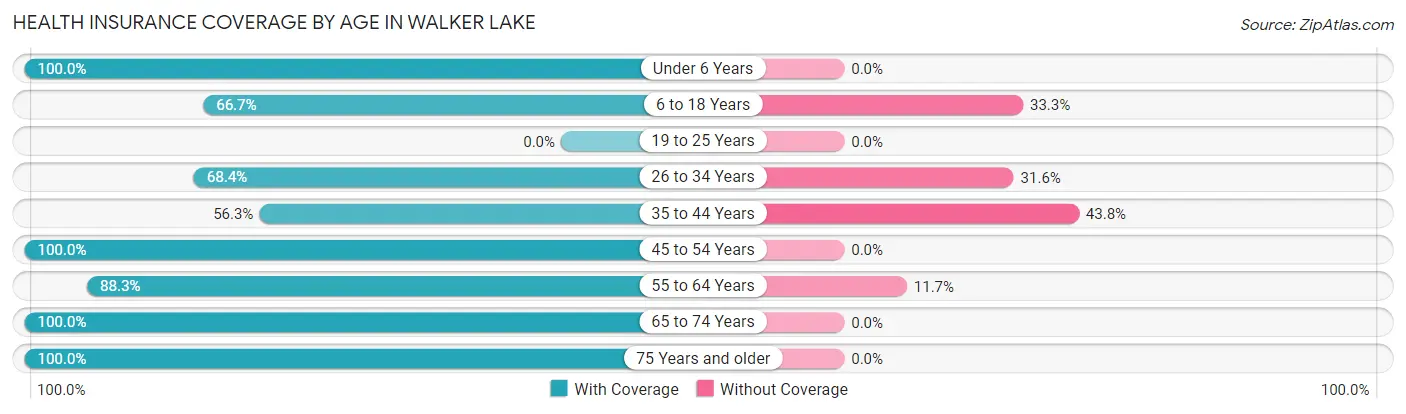
| Age Bracket | With Coverage | Without Coverage |
| Under 6 Years | 5 (100.0%) | 0 (0.0%) |
| 6 to 18 Years | 38 (66.7%) | 19 (33.3%) |
| 19 to 25 Years | 0 (0.0%) | 0 (0.0%) |
| 26 to 34 Years | 13 (68.4%) | 6 (31.6%) |
| 35 to 44 Years | 18 (56.2%) | 14 (43.8%) |
| 45 to 54 Years | 5 (100.0%) | 0 (0.0%) |
| 55 to 64 Years | 53 (88.3%) | 7 (11.7%) |
| 65 to 74 Years | 149 (100.0%) | 0 (0.0%) |
| 75 Years and older | 58 (100.0%) | 0 (0.0%) |
| Total | 339 (88.0%) | 46 (11.9%) |
Health Insurance Coverage by Citizenship Status in Walker Lake
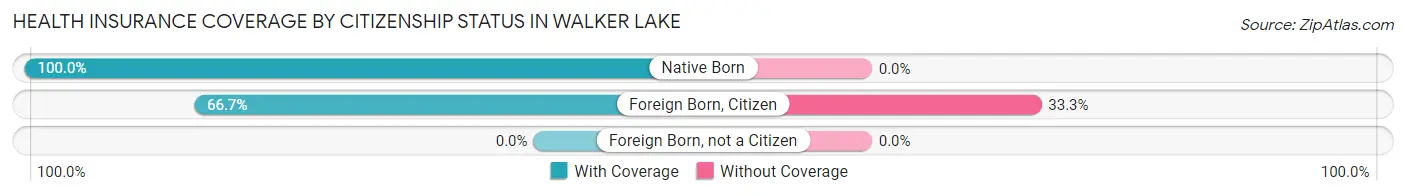
| Citizenship Status | With Coverage | Without Coverage |
| Native Born | 5 (100.0%) | 0 (0.0%) |
| Foreign Born, Citizen | 38 (66.7%) | 19 (33.3%) |
| Foreign Born, not a Citizen | 0 (0.0%) | 0 (0.0%) |
Health Insurance Coverage by Household Income in Walker Lake
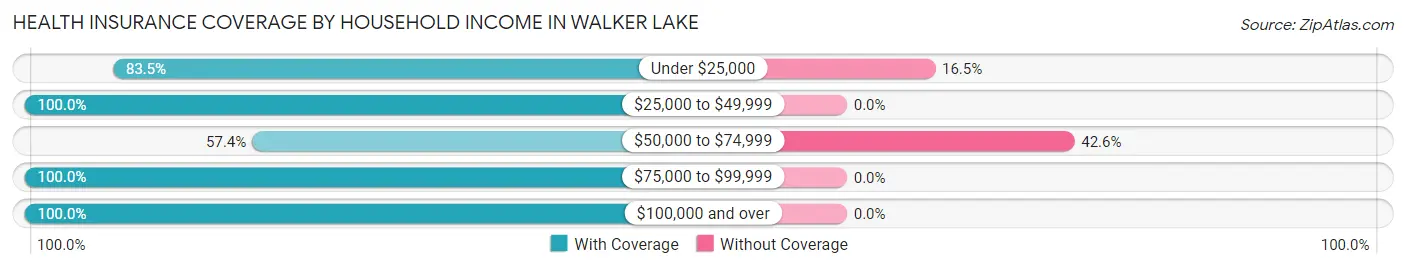
| Household Income | With Coverage | Without Coverage |
| Under $25,000 | 101 (83.5%) | 20 (16.5%) |
| $25,000 to $49,999 | 171 (100.0%) | 0 (0.0%) |
| $50,000 to $74,999 | 35 (57.4%) | 26 (42.6%) |
| $75,000 to $99,999 | 24 (100.0%) | 0 (0.0%) |
| $100,000 and over | 8 (100.0%) | 0 (0.0%) |
Public vs Private Health Insurance Coverage by Age in Walker Lake
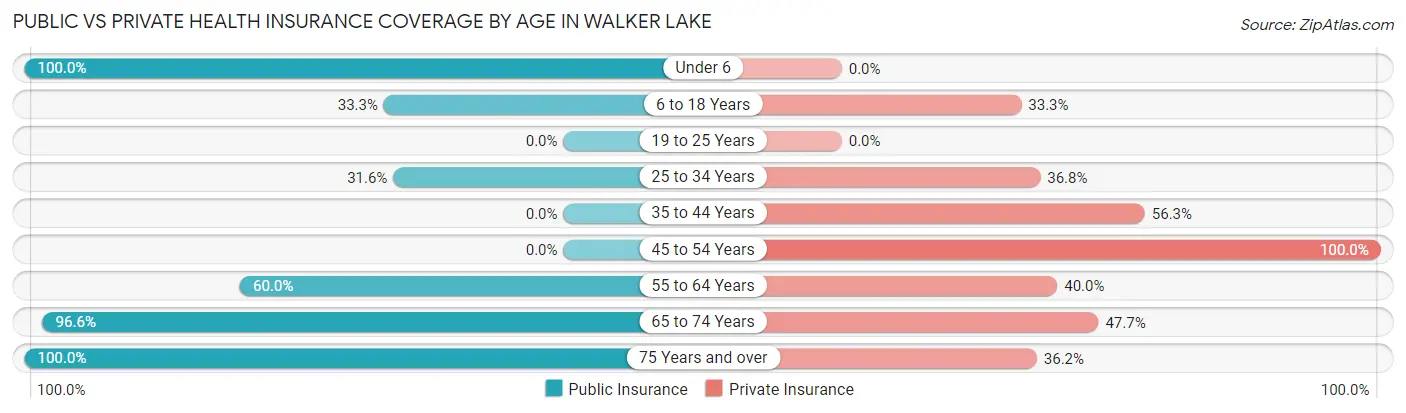
| Age Bracket | Public Insurance | Private Insurance |
| Under 6 | 5 (100.0%) | 0 (0.0%) |
| 6 to 18 Years | 19 (33.3%) | 19 (33.3%) |
| 19 to 25 Years | 0 (0.0%) | 0 (0.0%) |
| 25 to 34 Years | 6 (31.6%) | 7 (36.8%) |
| 35 to 44 Years | 0 (0.0%) | 18 (56.2%) |
| 45 to 54 Years | 0 (0.0%) | 5 (100.0%) |
| 55 to 64 Years | 36 (60.0%) | 24 (40.0%) |
| 65 to 74 Years | 144 (96.6%) | 71 (47.6%) |
| 75 Years and over | 58 (100.0%) | 21 (36.2%) |
| Total | 268 (69.6%) | 165 (42.9%) |
Disability Status by Sex by Age in Walker Lake
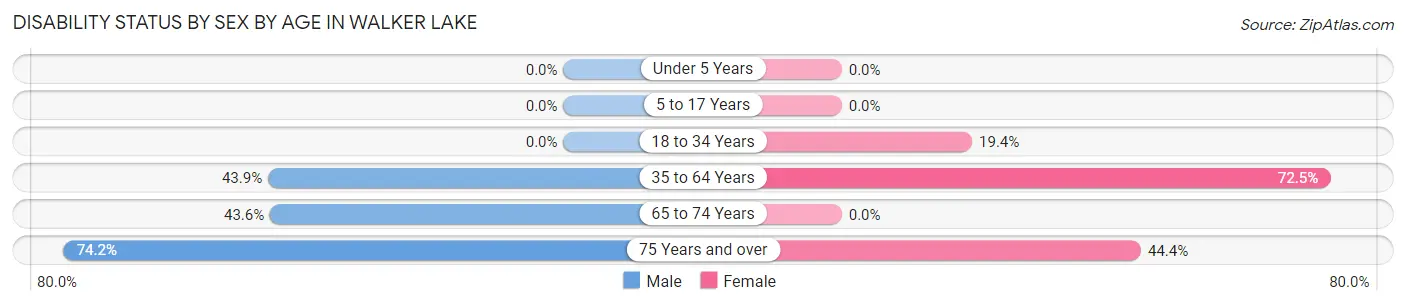
| Age Bracket | Male | Female |
| Under 5 Years | 0 (0.0%) | 0 (0.0%) |
| 5 to 17 Years | 0 (0.0%) | 0 (0.0%) |
| 18 to 34 Years | 0 (0.0%) | 6 (19.4%) |
| 35 to 64 Years | 25 (43.9%) | 29 (72.5%) |
| 65 to 74 Years | 27 (43.5%) | 0 (0.0%) |
| 75 Years and over | 23 (74.2%) | 12 (44.4%) |
Disability Class by Sex by Age in Walker Lake
Disability Class: Hearing Difficulty
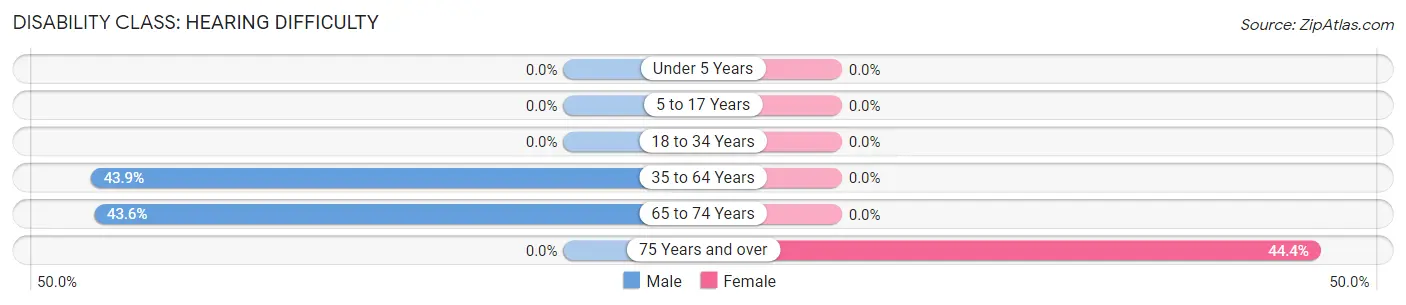
| Age Bracket | Male | Female |
| Under 5 Years | 0 (0.0%) | 0 (0.0%) |
| 5 to 17 Years | 0 (0.0%) | 0 (0.0%) |
| 18 to 34 Years | 0 (0.0%) | 0 (0.0%) |
| 35 to 64 Years | 25 (43.9%) | 0 (0.0%) |
| 65 to 74 Years | 27 (43.5%) | 0 (0.0%) |
| 75 Years and over | 0 (0.0%) | 12 (44.4%) |
Disability Class: Vision Difficulty
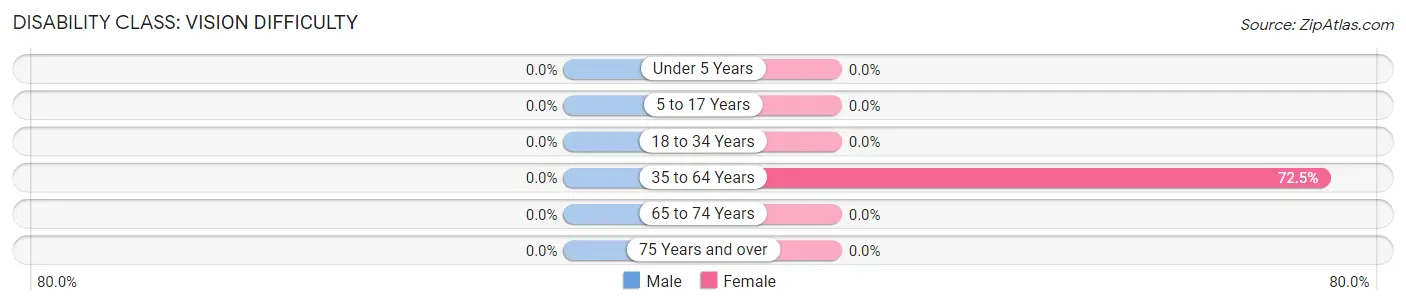
| Age Bracket | Male | Female |
| Under 5 Years | 0 (0.0%) | 0 (0.0%) |
| 5 to 17 Years | 0 (0.0%) | 0 (0.0%) |
| 18 to 34 Years | 0 (0.0%) | 0 (0.0%) |
| 35 to 64 Years | 0 (0.0%) | 29 (72.5%) |
| 65 to 74 Years | 0 (0.0%) | 0 (0.0%) |
| 75 Years and over | 0 (0.0%) | 0 (0.0%) |
Disability Class: Cognitive Difficulty
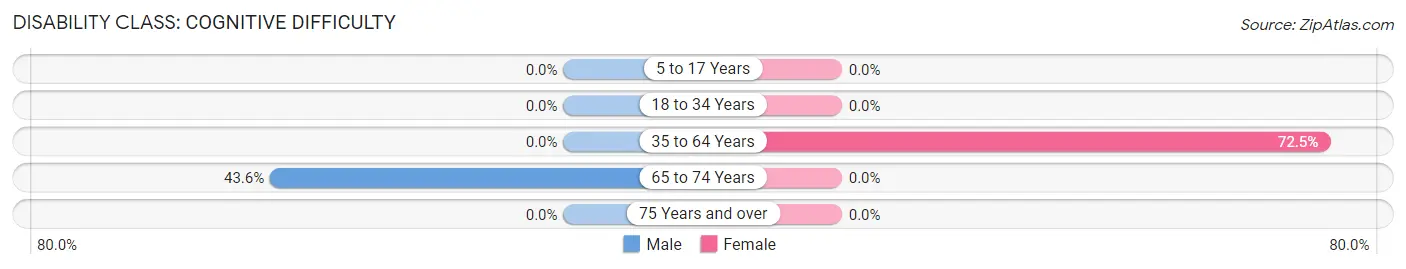
| Age Bracket | Male | Female |
| 5 to 17 Years | 0 (0.0%) | 0 (0.0%) |
| 18 to 34 Years | 0 (0.0%) | 0 (0.0%) |
| 35 to 64 Years | 0 (0.0%) | 29 (72.5%) |
| 65 to 74 Years | 27 (43.5%) | 0 (0.0%) |
| 75 Years and over | 0 (0.0%) | 0 (0.0%) |
Disability Class: Ambulatory Difficulty
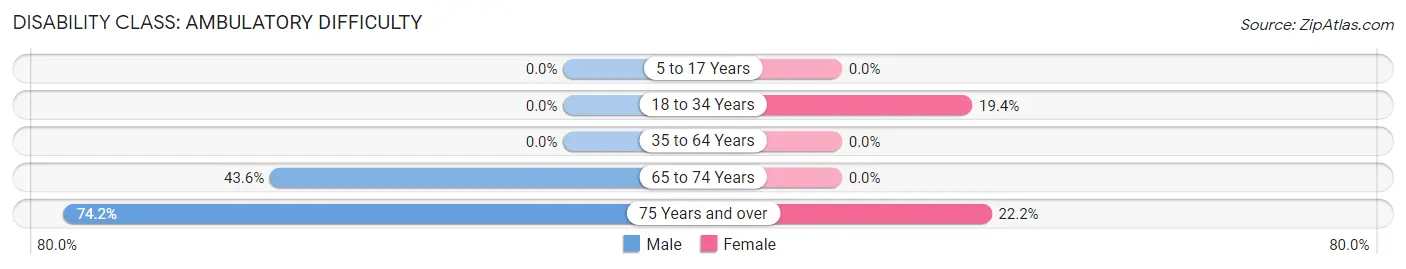
| Age Bracket | Male | Female |
| 5 to 17 Years | 0 (0.0%) | 0 (0.0%) |
| 18 to 34 Years | 0 (0.0%) | 6 (19.4%) |
| 35 to 64 Years | 0 (0.0%) | 0 (0.0%) |
| 65 to 74 Years | 27 (43.5%) | 0 (0.0%) |
| 75 Years and over | 23 (74.2%) | 6 (22.2%) |
Disability Class: Self-Care Difficulty
| Age Bracket | Male | Female |
| 5 to 17 Years | 0 (0.0%) | 0 (0.0%) |
| 18 to 34 Years | 0 (0.0%) | 0 (0.0%) |
| 35 to 64 Years | 0 (0.0%) | 0 (0.0%) |
| 65 to 74 Years | 0 (0.0%) | 0 (0.0%) |
| 75 Years and over | 0 (0.0%) | 0 (0.0%) |
Technology Access in Walker Lake
Computing Device Access in Walker Lake
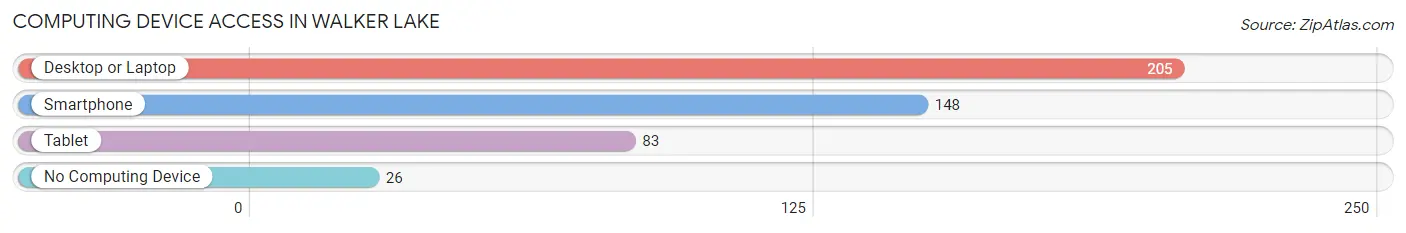
| Device Type | # Households | % Households |
| Desktop or Laptop | 205 | 86.5% |
| Smartphone | 148 | 62.5% |
| Tablet | 83 | 35.0% |
| No Computing Device | 26 | 11.0% |
| Total | 237 | 100.0% |
Internet Access in Walker Lake
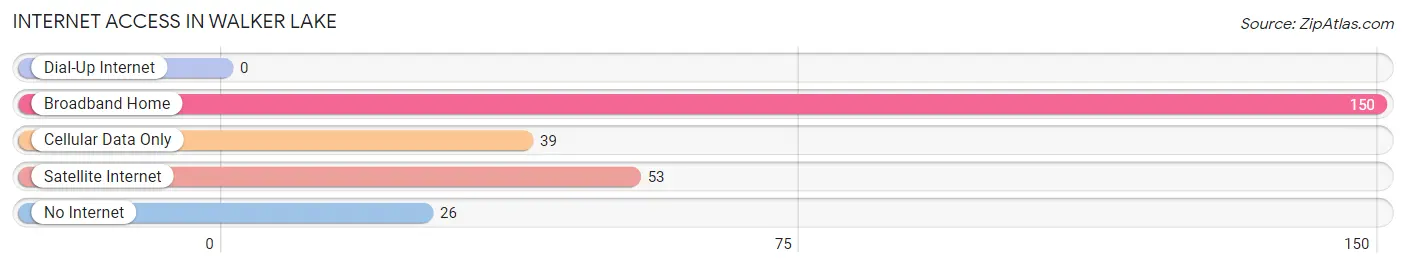
| Internet Type | # Households | % Households |
| Dial-Up Internet | 0 | 0.0% |
| Broadband Home | 150 | 63.3% |
| Cellular Data Only | 39 | 16.5% |
| Satellite Internet | 53 | 22.4% |
| No Internet | 26 | 11.0% |
| Total | 237 | 100.0% |
Walker Lake Summary
Lake Walker is a small, shallow lake located in Mineral County, Nevada, United States. It is the largest natural lake in the state and is a popular destination for fishing, camping, and other recreational activities. The lake is fed by the Walker River, which flows from the Sierra Nevada Mountains to the east. The lake is surrounded by the Walker Lake State Recreation Area, which is managed by the Nevada Department of Wildlife.
History
The Walker Lake area has been inhabited by humans for thousands of years. The first known inhabitants were the Northern Paiute people, who lived in the area for centuries before the arrival of European settlers. The lake was named after Joseph R. Walker, an explorer who led a party of fur trappers through the area in 1833.
In the late 19th century, the lake was a popular destination for settlers and miners. The lake was also used for irrigation and to supply water to the nearby towns of Hawthorne and Schurz. In the early 20th century, the lake was used for recreational activities such as fishing and boating.
Geography
Walker Lake is located in Mineral County, Nevada, in the western part of the state. The lake is approximately 8 miles long and 2 miles wide, with a maximum depth of about 30 feet. The lake is fed by the Walker River, which flows from the Sierra Nevada Mountains to the east. The lake is surrounded by the Walker Lake State Recreation Area, which is managed by the Nevada Department of Wildlife.
Economy
Walker Lake is a popular destination for fishing, camping, and other recreational activities. The lake is home to a variety of fish species, including largemouth bass, catfish, and crappie. The lake is also a popular spot for bird watching, as it is home to a variety of waterfowl species.
The lake is also a popular destination for boating and water skiing. There are several marinas located around the lake, as well as boat ramps and other facilities.
Demographics
As of the 2010 census, the population of Walker Lake was 1,068. The median age was 44.7 years, and the median household income was $37,917. The majority of the population (90.2%) was white, while 4.2% were Hispanic or Latino. The population was spread out, with 25.2% under the age of 18, 8.2% from 18 to 24, 28.2% from 25 to 44, 24.2% from 45 to 64, and 14.2% who were 65 years of age or older.
Conclusion
Walker Lake is a popular destination for fishing, camping, and other recreational activities. The lake is fed by the Walker River, which flows from the Sierra Nevada Mountains to the east. The lake is surrounded by the Walker Lake State Recreation Area, which is managed by the Nevada Department of Wildlife. The population of Walker Lake was 1,068 as of the 2010 census, with a median age of 44.7 years and a median household income of $37,917. The lake is a popular spot for bird watching, as it is home to a variety of waterfowl species, and is also a popular destination for boating and water skiing.
Common Questions
What is Per Capita Income in Walker Lake?
Per Capita income in Walker Lake is $24,945.
What is the Median Family Income in Walker Lake?
Median Family Income in Walker Lake is $46,471.
What is the Median Household income in Walker Lake?
Median Household Income in Walker Lake is $40,481.
What is Income or Wage Gap in Walker Lake?
Income or Wage Gap in Walker Lake is 17.1%.
Women in Walker Lake earn 82.9 cents for every dollar earned by a man.
What is Inequality or Gini Index in Walker Lake?
Inequality or Gini Index in Walker Lake is 0.40.
What is the Total Population of Walker Lake?
Total Population of Walker Lake is 385.
What is the Total Male Population of Walker Lake?
Total Male Population of Walker Lake is 171.
What is the Total Female Population of Walker Lake?
Total Female Population of Walker Lake is 214.
What is the Ratio of Males per 100 Females in Walker Lake?
There are 79.91 Males per 100 Females in Walker Lake.
What is the Ratio of Females per 100 Males in Walker Lake?
There are 125.15 Females per 100 Males in Walker Lake.
What is the Median Population Age in Walker Lake?
Median Population Age in Walker Lake is 66.4 Years.
What is the Average Family Size in Walker Lake
Average Family Size in Walker Lake is 2.7 People.
What is the Average Household Size in Walker Lake
Average Household Size in Walker Lake is 1.6 People.
How Large is the Labor Force in Walker Lake?
There are 95 People in the Labor Forcein in Walker Lake.
What is the Percentage of People in the Labor Force in Walker Lake?
28.4% of People are in the Labor Force in Walker Lake.
What is the Unemployment Rate in Walker Lake?
Unemployment Rate in Walker Lake is 12.6%.