Carleton, NE Map & Demographics
Carleton Map
Carleton Overview
$22,054
PER CAPITA INCOME
$73,333
AVG FAMILY INCOME
$76,765
AVG HOUSEHOLD INCOME
0.14
INEQUALITY / GINI INDEX
178
TOTAL POPULATION
123
MALE POPULATION
55
FEMALE POPULATION
223.64
MALES / 100 FEMALES
44.72
FEMALES / 100 MALES
25.4
MEDIAN AGE
3.6
AVG FAMILY SIZE
3.4
AVG HOUSEHOLD SIZE
114
LABOR FORCE [ PEOPLE ]
90.5%
PERCENT IN LABOR FORCE
Carleton Zip Codes
Carleton Area Codes
Income in Carleton
Income Overview in Carleton
Per Capita Income in Carleton is $22,054, while median incomes of families and households are $73,333 and $76,765 respectively.
| Characteristic | Number | Measure |
| Per Capita Income | 178 | $22,054 |
| Median Family Income | 46 | $73,333 |
| Mean Family Income | 46 | $67,176 |
| Median Household Income | 52 | $76,765 |
| Mean Household Income | 52 | $74,473 |
| Income Deficit | 46 | $0 |
| Wage / Income Gap (%) | 178 | 0.00% |
| Wage / Income Gap ($) | 178 | 100.00¢ per $1 |
| Gini / Inequality Index | 178 | 0.14 |
Earnings by Sex in Carleton
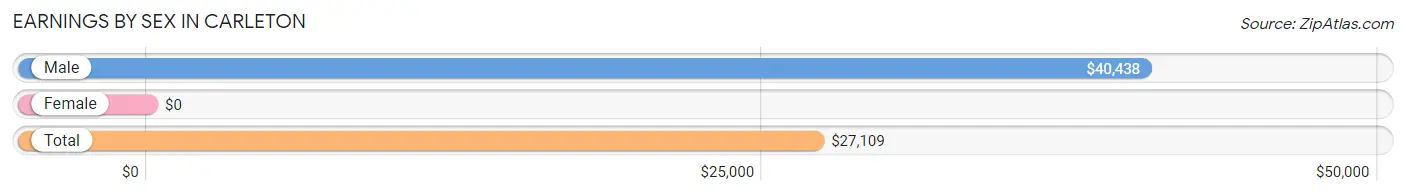
| Sex | Number | Average Earnings |
| Male | 79 (65.8%) | $40,438 |
| Female | 41 (34.2%) | $0 |
| Total | 120 (100.0%) | $27,109 |
Earnings by Sex by Income Bracket in Carleton
The most common earnings brackets in Carleton are $25,000 to $29,999 for men (32 | 40.5%) and $5,000 to $7,499 for women (16 | 39.0%).
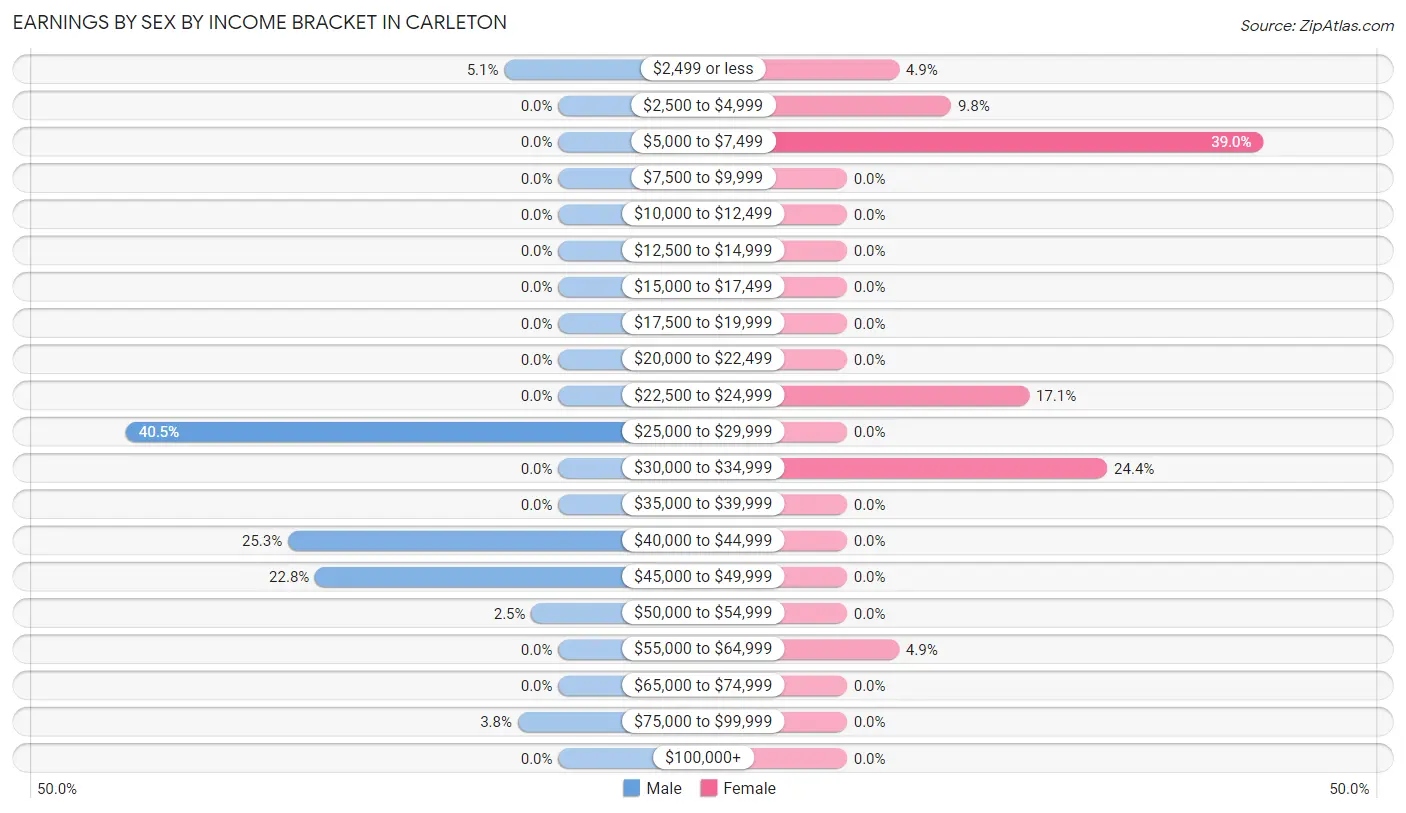
| Income | Male | Female |
| $2,499 or less | 4 (5.1%) | 2 (4.9%) |
| $2,500 to $4,999 | 0 (0.0%) | 4 (9.8%) |
| $5,000 to $7,499 | 0 (0.0%) | 16 (39.0%) |
| $7,500 to $9,999 | 0 (0.0%) | 0 (0.0%) |
| $10,000 to $12,499 | 0 (0.0%) | 0 (0.0%) |
| $12,500 to $14,999 | 0 (0.0%) | 0 (0.0%) |
| $15,000 to $17,499 | 0 (0.0%) | 0 (0.0%) |
| $17,500 to $19,999 | 0 (0.0%) | 0 (0.0%) |
| $20,000 to $22,499 | 0 (0.0%) | 0 (0.0%) |
| $22,500 to $24,999 | 0 (0.0%) | 7 (17.1%) |
| $25,000 to $29,999 | 32 (40.5%) | 0 (0.0%) |
| $30,000 to $34,999 | 0 (0.0%) | 10 (24.4%) |
| $35,000 to $39,999 | 0 (0.0%) | 0 (0.0%) |
| $40,000 to $44,999 | 20 (25.3%) | 0 (0.0%) |
| $45,000 to $49,999 | 18 (22.8%) | 0 (0.0%) |
| $50,000 to $54,999 | 2 (2.5%) | 0 (0.0%) |
| $55,000 to $64,999 | 0 (0.0%) | 2 (4.9%) |
| $65,000 to $74,999 | 0 (0.0%) | 0 (0.0%) |
| $75,000 to $99,999 | 3 (3.8%) | 0 (0.0%) |
| $100,000+ | 0 (0.0%) | 0 (0.0%) |
| Total | 79 (100.0%) | 41 (100.0%) |
Earnings by Sex by Educational Attainment in Carleton
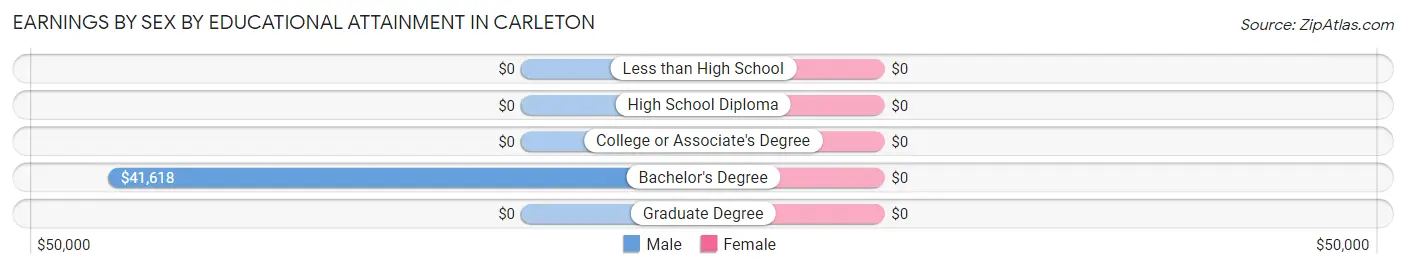
| Educational Attainment | Male Income | Female Income |
| Less than High School | - | - |
| High School Diploma | - | - |
| College or Associate's Degree | - | - |
| Bachelor's Degree | $41,618 | $0 |
| Graduate Degree | - | - |
| Total | $42,438 | $0 |
Family Income in Carleton
Family Income Brackets in Carleton
According to the Carleton family income data, there are 17 families falling into the $35,000 to $49,999 income range, which is the most common income bracket and makes up 37.0% of all families.
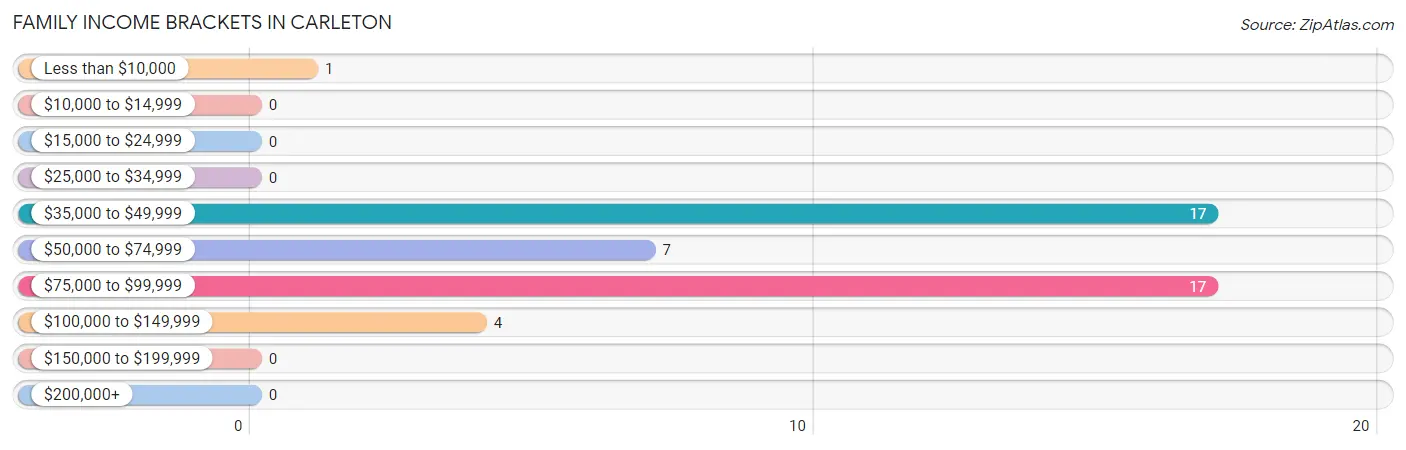
| Income Bracket | # Families | % Families |
| Less than $10,000 | 1 | 2.2% |
| $10,000 to $14,999 | 0 | 0.0% |
| $15,000 to $24,999 | 0 | 0.0% |
| $25,000 to $34,999 | 0 | 0.0% |
| $35,000 to $49,999 | 17 | 37.0% |
| $50,000 to $74,999 | 7 | 15.2% |
| $75,000 to $99,999 | 17 | 37.0% |
| $100,000 to $149,999 | 4 | 8.7% |
| $150,000 to $199,999 | 0 | 0.0% |
| $200,000+ | 0 | 0.0% |
Family Income by Famaliy Size in Carleton
2-person families (7 | 15.2%) account for the highest median family income in Carleton with $99,063 per family, while 2-person families (7 | 15.2%) have the highest median income of $49,532 per family member.
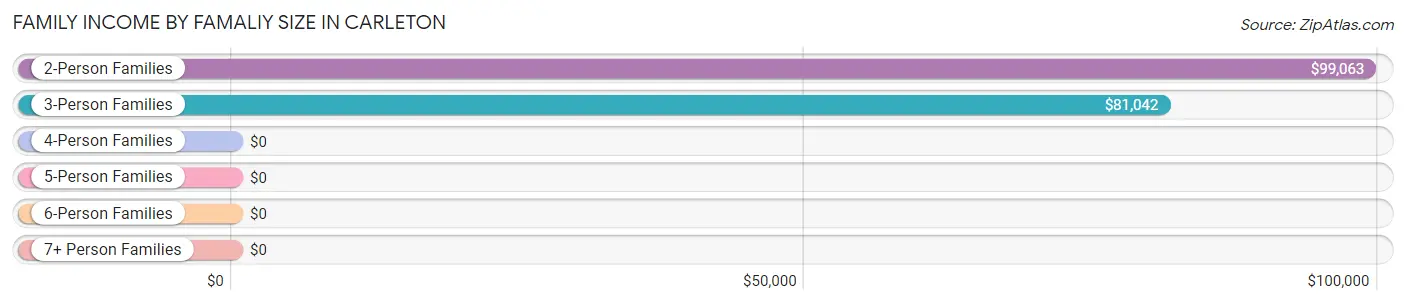
| Income Bracket | # Families | Median Income |
| 2-Person Families | 7 (15.2%) | $99,063 |
| 3-Person Families | 18 (39.1%) | $81,042 |
| 4-Person Families | 17 (37.0%) | $0 |
| 5-Person Families | 4 (8.7%) | $0 |
| 6-Person Families | 0 (0.0%) | $0 |
| 7+ Person Families | 0 (0.0%) | $0 |
| Total | 46 (100.0%) | $73,333 |
Family Income by Number of Earners in Carleton
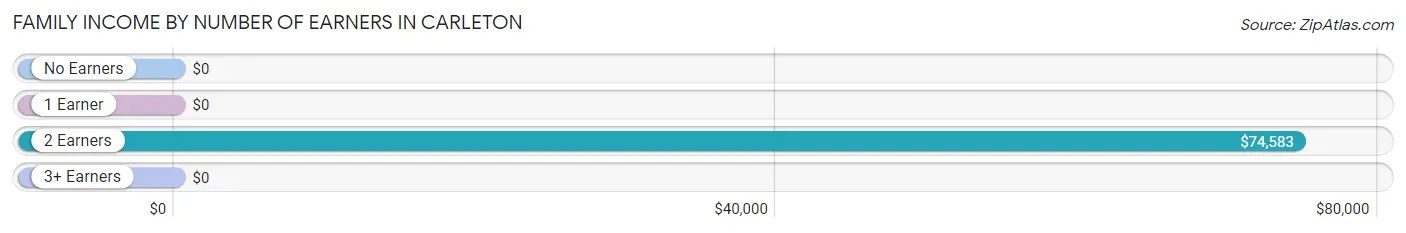
| Number of Earners | # Families | Median Income |
| No Earners | 2 (4.3%) | $0 |
| 1 Earner | 17 (37.0%) | $0 |
| 2 Earners | 13 (28.3%) | $74,583 |
| 3+ Earners | 14 (30.4%) | $0 |
| Total | 46 (100.0%) | $73,333 |
Household Income in Carleton
Household Income Brackets in Carleton
With 34 households falling in the category, the $75,000 to $99,999 income range is the most frequent in Carleton, accounting for 65.4% of all households.
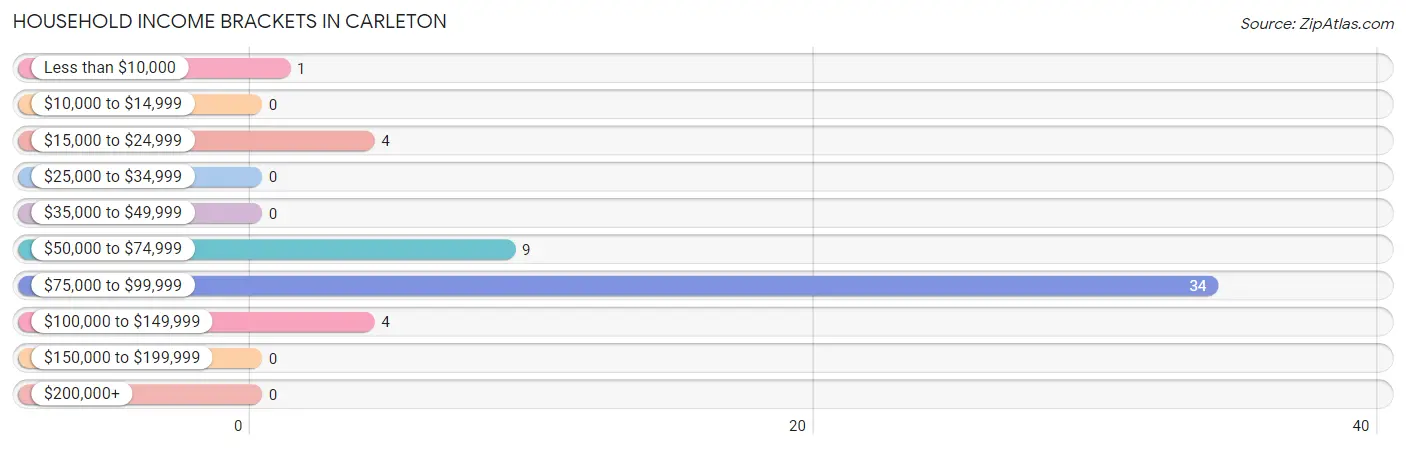
| Income Bracket | # Households | % Households |
| Less than $10,000 | 1 | 1.9% |
| $10,000 to $14,999 | 0 | 0.0% |
| $15,000 to $24,999 | 4 | 7.7% |
| $25,000 to $34,999 | 0 | 0.0% |
| $35,000 to $49,999 | 0 | 0.0% |
| $50,000 to $74,999 | 9 | 17.3% |
| $75,000 to $99,999 | 34 | 65.4% |
| $100,000 to $149,999 | 4 | 7.7% |
| $150,000 to $199,999 | 0 | 0.0% |
| $200,000+ | 0 | 0.0% |
Household Income by Householder Age in Carleton
The median household income in Carleton is $76,765, with the highest median household income of $82,083 found in the 45 to 64 years age bracket for the primary householder. A total of 20 households (38.5%) fall into this category.
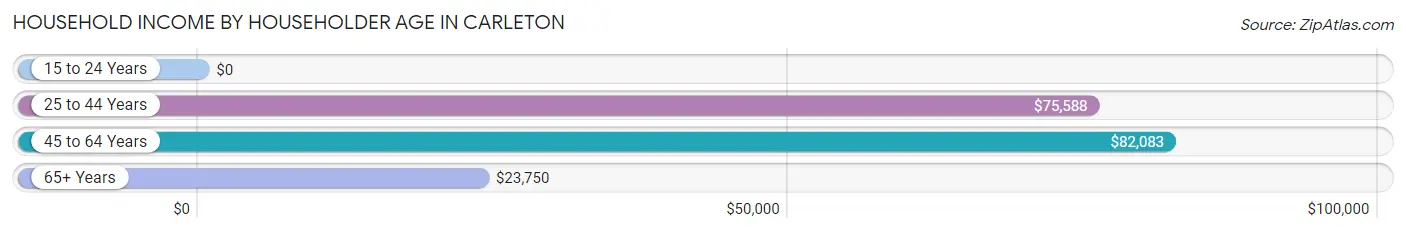
| Income Bracket | # Households | Median Income |
| 15 to 24 Years | 0 (0.0%) | $0 |
| 25 to 44 Years | 26 (50.0%) | $75,588 |
| 45 to 64 Years | 20 (38.5%) | $82,083 |
| 65+ Years | 6 (11.5%) | $23,750 |
| Total | 52 (100.0%) | $76,765 |
Poverty in Carleton
Income Below Poverty by Sex and Age in Carleton
With 0.8% poverty level for males and 1.8% for females among the residents of Carleton, 65 to 74 year old males and 65 to 74 year old females are the most vulnerable to poverty, with 1 males (50.0%) and 1 females (100.0%) in their respective age groups living below the poverty level.
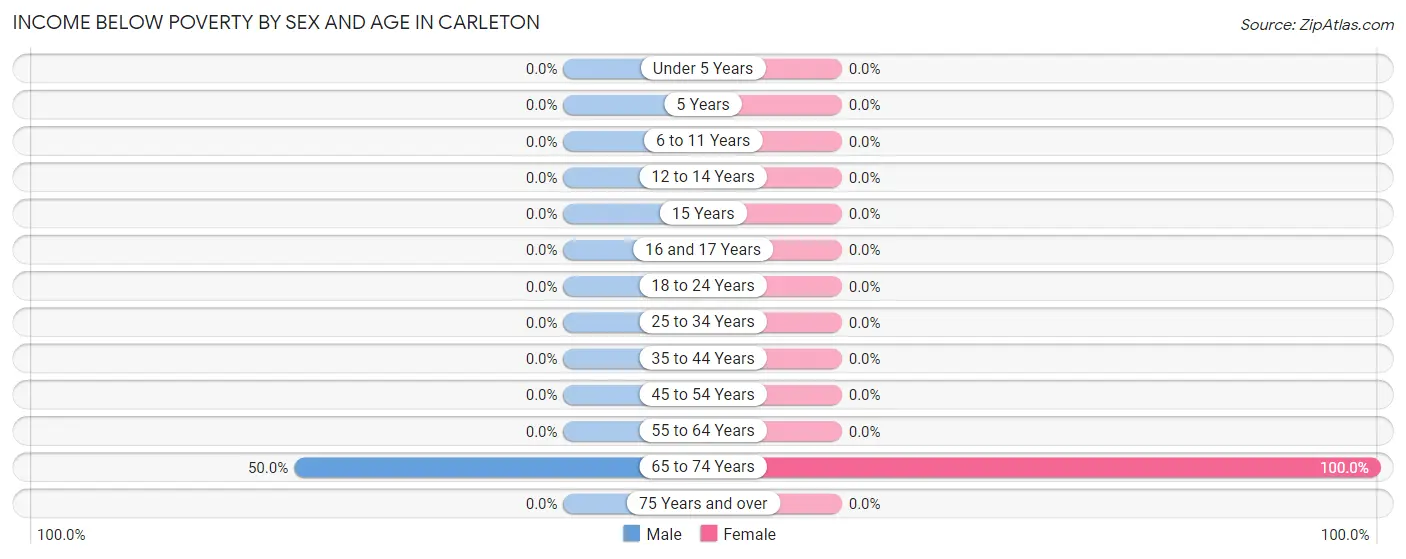
| Age Bracket | Male | Female |
| Under 5 Years | 0 (0.0%) | 0 (0.0%) |
| 5 Years | 0 (0.0%) | 0 (0.0%) |
| 6 to 11 Years | 0 (0.0%) | 0 (0.0%) |
| 12 to 14 Years | 0 (0.0%) | 0 (0.0%) |
| 15 Years | 0 (0.0%) | 0 (0.0%) |
| 16 and 17 Years | 0 (0.0%) | 0 (0.0%) |
| 18 to 24 Years | 0 (0.0%) | 0 (0.0%) |
| 25 to 34 Years | 0 (0.0%) | 0 (0.0%) |
| 35 to 44 Years | 0 (0.0%) | 0 (0.0%) |
| 45 to 54 Years | 0 (0.0%) | 0 (0.0%) |
| 55 to 64 Years | 0 (0.0%) | 0 (0.0%) |
| 65 to 74 Years | 1 (50.0%) | 1 (100.0%) |
| 75 Years and over | 0 (0.0%) | 0 (0.0%) |
| Total | 1 (0.8%) | 1 (1.8%) |
Income Above Poverty by Sex and Age in Carleton
According to the poverty statistics in Carleton, males aged under 5 years and females aged 12 to 14 years are the age groups that are most secure financially, with 100.0% of males and 100.0% of females in these age groups living above the poverty line.
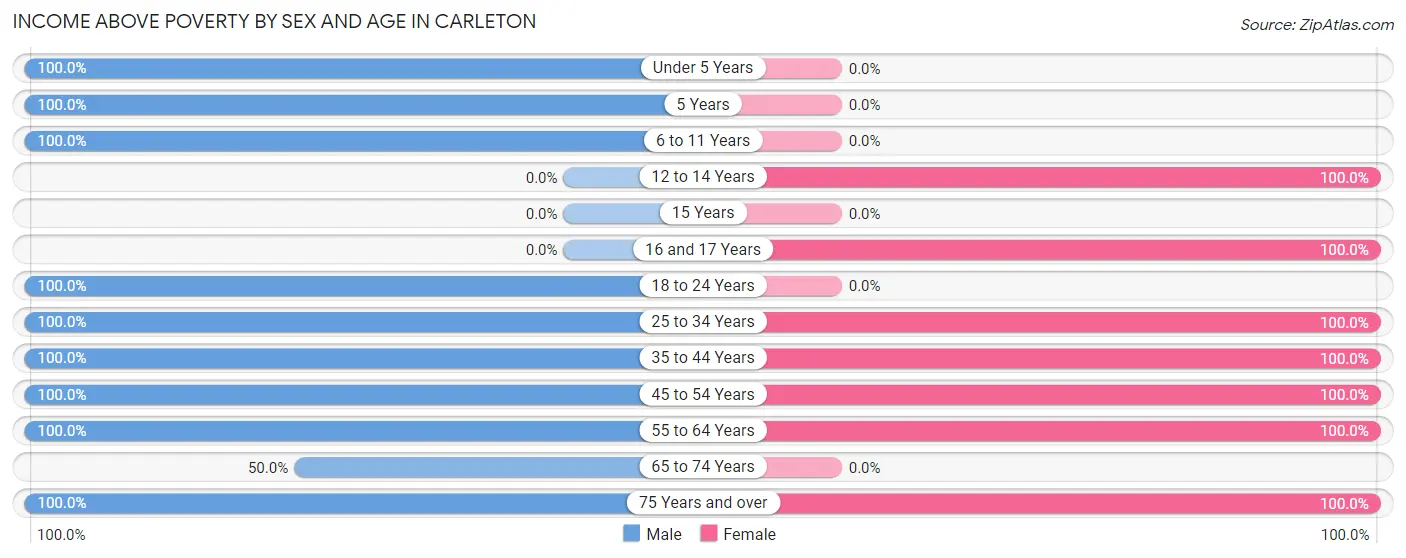
| Age Bracket | Male | Female |
| Under 5 Years | 20 (100.0%) | 0 (0.0%) |
| 5 Years | 18 (100.0%) | 0 (0.0%) |
| 6 to 11 Years | 2 (100.0%) | 0 (0.0%) |
| 12 to 14 Years | 0 (0.0%) | 12 (100.0%) |
| 15 Years | 0 (0.0%) | 0 (0.0%) |
| 16 and 17 Years | 0 (0.0%) | 2 (100.0%) |
| 18 to 24 Years | 32 (100.0%) | 0 (0.0%) |
| 25 to 34 Years | 6 (100.0%) | 12 (100.0%) |
| 35 to 44 Years | 19 (100.0%) | 3 (100.0%) |
| 45 to 54 Years | 12 (100.0%) | 20 (100.0%) |
| 55 to 64 Years | 7 (100.0%) | 4 (100.0%) |
| 65 to 74 Years | 1 (50.0%) | 0 (0.0%) |
| 75 Years and over | 5 (100.0%) | 1 (100.0%) |
| Total | 122 (99.2%) | 54 (98.2%) |
Income Below Poverty Among Married-Couple Families in Carleton
The poverty statistics for married-couple families in Carleton show that 3.5% or 1 of the total 29 families live below the poverty line. Families with no children have the highest poverty rate of 5.0%, comprising of 1 families. On the other hand, families with 1 or 2 children have the lowest poverty rate of 0.0%, which includes 0 families.
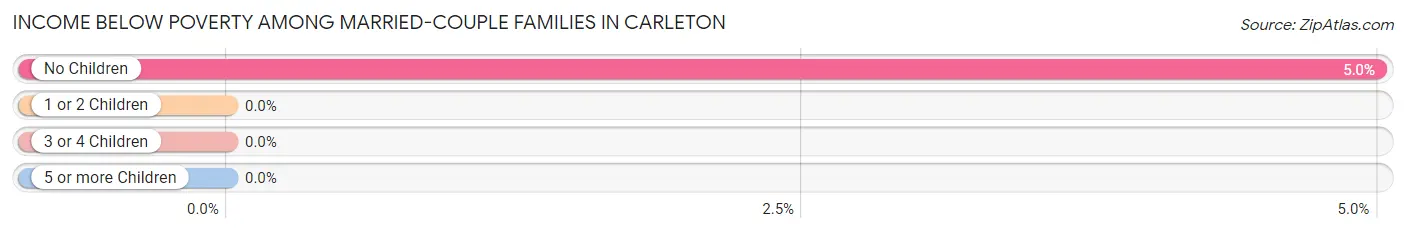
| Children | Above Poverty | Below Poverty |
| No Children | 19 (95.0%) | 1 (5.0%) |
| 1 or 2 Children | 5 (100.0%) | 0 (0.0%) |
| 3 or 4 Children | 4 (100.0%) | 0 (0.0%) |
| 5 or more Children | 0 (0.0%) | 0 (0.0%) |
| Total | 28 (96.6%) | 1 (3.5%) |
Income Below Poverty Among Single-Parent Households in Carleton
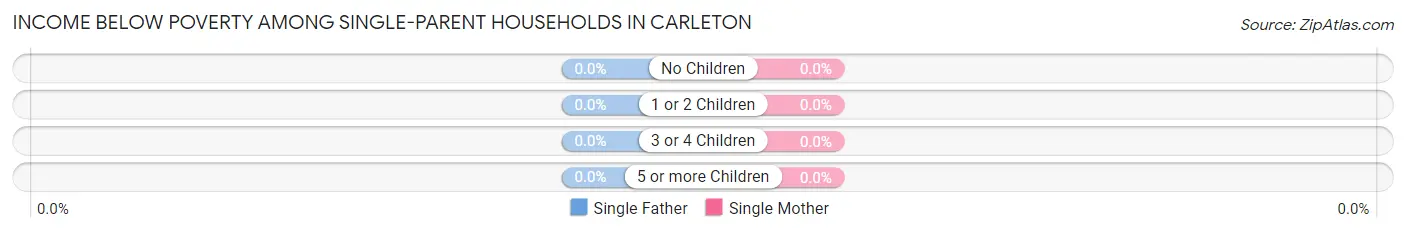
| Children | Single Father | Single Mother |
| No Children | 0 (0.0%) | 0 (0.0%) |
| 1 or 2 Children | 0 (0.0%) | 0 (0.0%) |
| 3 or 4 Children | 0 (0.0%) | 0 (0.0%) |
| 5 or more Children | 0 (0.0%) | 0 (0.0%) |
| Total | 0 (0.0%) | 0 (0.0%) |
Income Below Poverty Among Married-Couple vs Single-Parent Households in Carleton
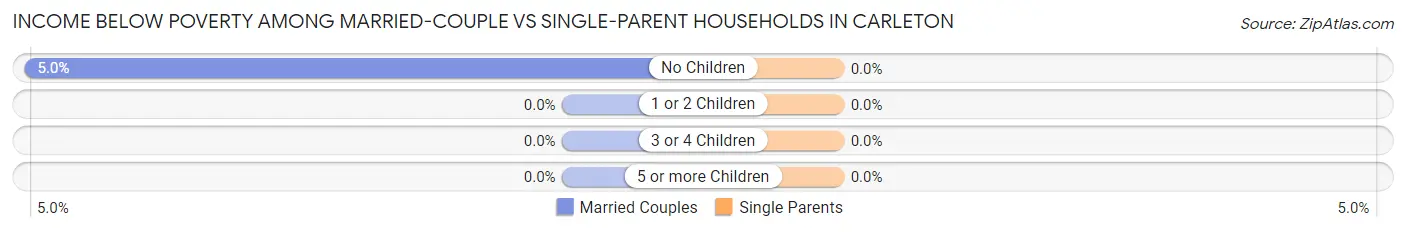
| Children | Married-Couple Families | Single-Parent Households |
| No Children | 1 (5.0%) | 0 (0.0%) |
| 1 or 2 Children | 0 (0.0%) | 0 (0.0%) |
| 3 or 4 Children | 0 (0.0%) | 0 (0.0%) |
| 5 or more Children | 0 (0.0%) | 0 (0.0%) |
| Total | 1 (3.5%) | 0 (0.0%) |
Race in Carleton
The most populous races in Carleton are White / Caucasian (175 | 98.3%), and Black / African American (3 | 1.7%).
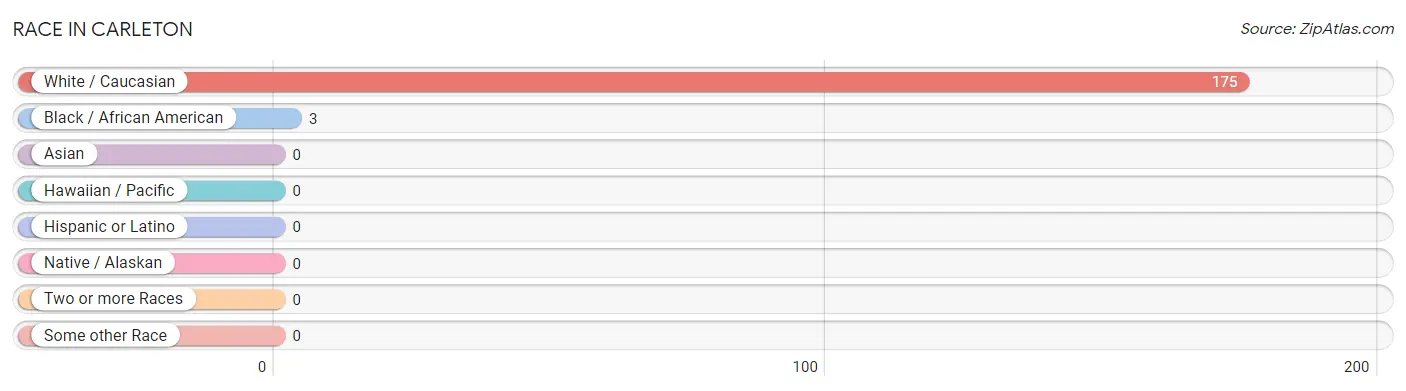
| Race | # Population | % Population |
| Asian | 0 | 0.0% |
| Black / African American | 3 | 1.7% |
| Hawaiian / Pacific | 0 | 0.0% |
| Hispanic or Latino | 0 | 0.0% |
| Native / Alaskan | 0 | 0.0% |
| White / Caucasian | 175 | 98.3% |
| Two or more Races | 0 | 0.0% |
| Some other Race | 0 | 0.0% |
| Total | 178 | 100.0% |
Ancestry in Carleton
The most populous ancestries reported in Carleton are German (56 | 31.5%), Danish (21 | 11.8%), Czech (5 | 2.8%), English (4 | 2.2%), and Irish (4 | 2.2%), together accounting for 50.6% of all Carleton residents.
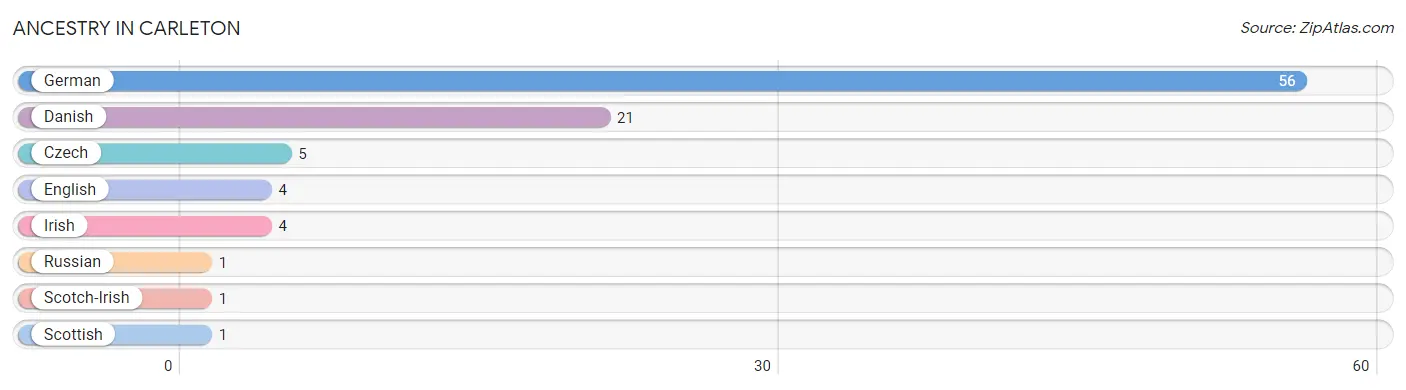
| Ancestry | # Population | % Population |
| Czech | 5 | 2.8% |
| Danish | 21 | 11.8% |
| English | 4 | 2.2% |
| German | 56 | 31.5% |
| Irish | 4 | 2.2% |
| Russian | 1 | 0.6% |
| Scotch-Irish | 1 | 0.6% |
| Scottish | 1 | 0.6% | View All 8 Rows |
Immigrants in Carleton

| Immigration Origin | # Population | % Population | View All 0 Rows |
Sex and Age in Carleton
Sex and Age in Carleton
The most populous age groups in Carleton are 20 to 24 Years (32 | 26.0%) for men and 45 to 49 Years (16 | 29.1%) for women.
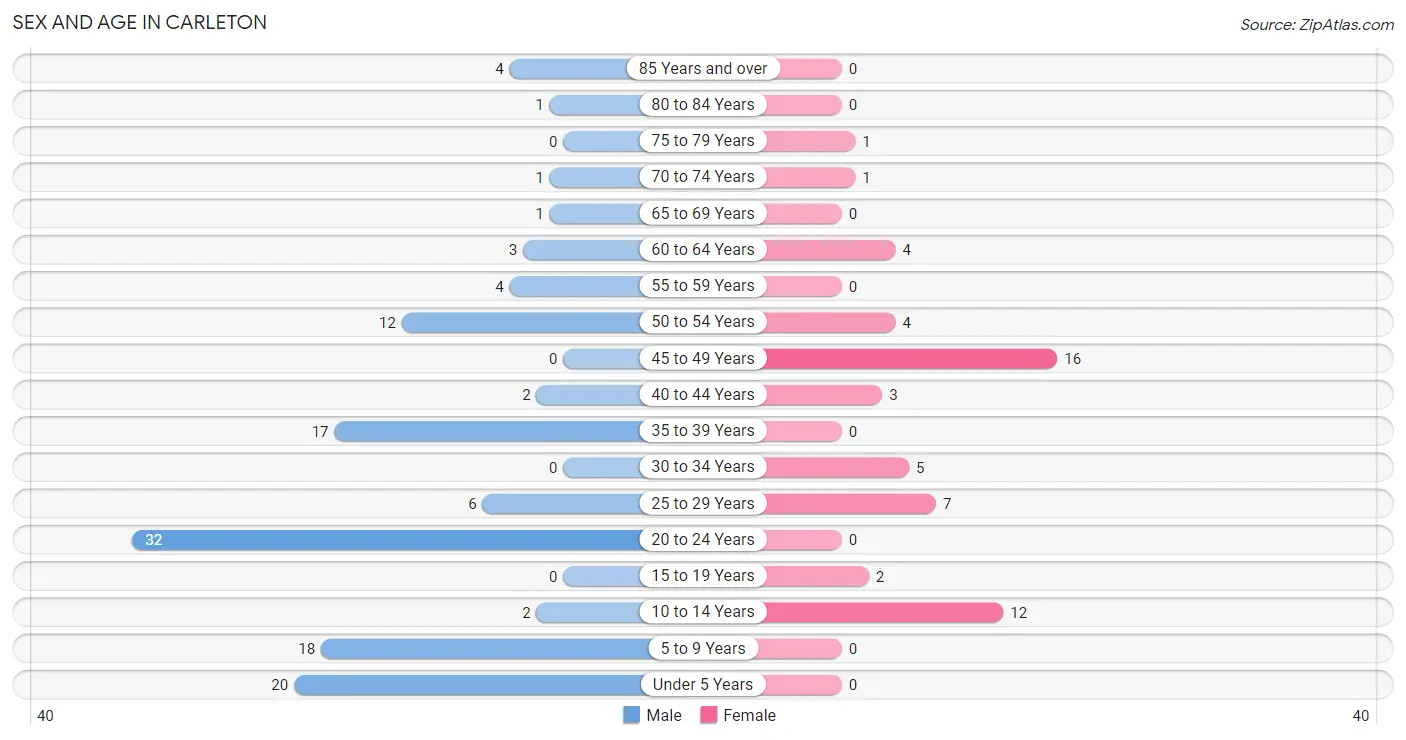
| Age Bracket | Male | Female |
| Under 5 Years | 20 (16.3%) | 0 (0.0%) |
| 5 to 9 Years | 18 (14.6%) | 0 (0.0%) |
| 10 to 14 Years | 2 (1.6%) | 12 (21.8%) |
| 15 to 19 Years | 0 (0.0%) | 2 (3.6%) |
| 20 to 24 Years | 32 (26.0%) | 0 (0.0%) |
| 25 to 29 Years | 6 (4.9%) | 7 (12.7%) |
| 30 to 34 Years | 0 (0.0%) | 5 (9.1%) |
| 35 to 39 Years | 17 (13.8%) | 0 (0.0%) |
| 40 to 44 Years | 2 (1.6%) | 3 (5.4%) |
| 45 to 49 Years | 0 (0.0%) | 16 (29.1%) |
| 50 to 54 Years | 12 (9.8%) | 4 (7.3%) |
| 55 to 59 Years | 4 (3.3%) | 0 (0.0%) |
| 60 to 64 Years | 3 (2.4%) | 4 (7.3%) |
| 65 to 69 Years | 1 (0.8%) | 0 (0.0%) |
| 70 to 74 Years | 1 (0.8%) | 1 (1.8%) |
| 75 to 79 Years | 0 (0.0%) | 1 (1.8%) |
| 80 to 84 Years | 1 (0.8%) | 0 (0.0%) |
| 85 Years and over | 4 (3.3%) | 0 (0.0%) |
| Total | 123 (100.0%) | 55 (100.0%) |
Families and Households in Carleton
Median Family Size in Carleton
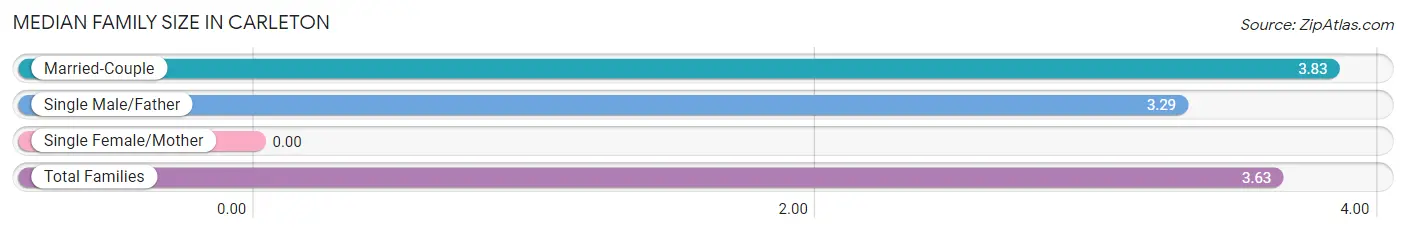
| Family Type | # Families | Family Size |
| Married-Couple | 29 (63.0%) | 3.83 |
| Single Male/Father | 17 (37.0%) | 3.29 |
| Single Female/Mother | 0 (0.0%) | - |
| Total Families | 46 (100.0%) | 3.63 |
Median Household Size in Carleton
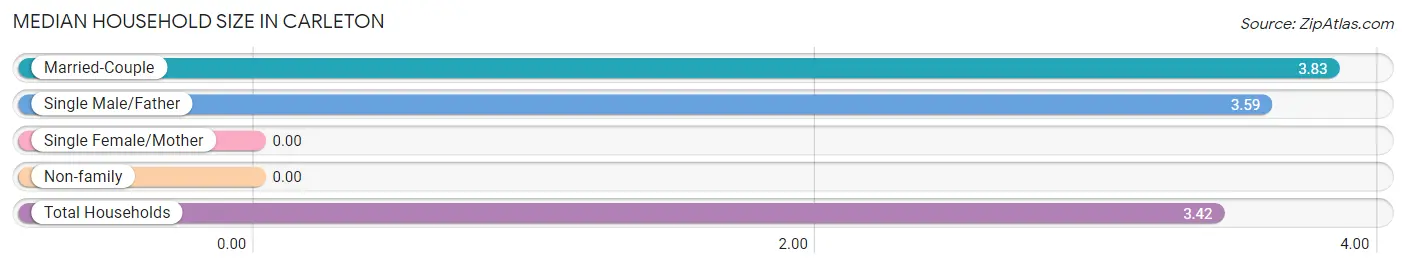
| Household Type | # Households | Household Size |
| Married-Couple | 29 (55.8%) | 3.83 |
| Single Male/Father | 17 (32.7%) | 3.59 |
| Single Female/Mother | 0 (0.0%) | - |
| Non-family | 6 (11.5%) | - |
| Total Households | 52 (100.0%) | 3.42 |
Household Size by Marriage Status in Carleton
Out of a total of 52 households in Carleton, 46 (88.5%) are family households, while 6 (11.5%) are nonfamily households. The most numerous type of family households are 5-person households, comprising 21, and the most common type of nonfamily households are 1-person households, comprising 6.
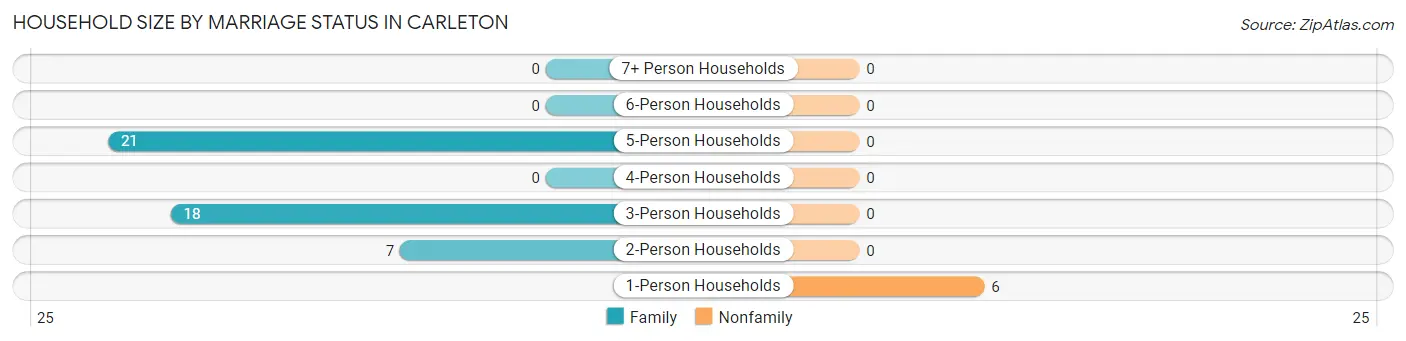
| Household Size | Family Households | Nonfamily Households |
| 1-Person Households | - | 6 (11.5%) |
| 2-Person Households | 7 (13.5%) | 0 (0.0%) |
| 3-Person Households | 18 (34.6%) | 0 (0.0%) |
| 4-Person Households | 0 (0.0%) | 0 (0.0%) |
| 5-Person Households | 21 (40.4%) | 0 (0.0%) |
| 6-Person Households | 0 (0.0%) | 0 (0.0%) |
| 7+ Person Households | 0 (0.0%) | 0 (0.0%) |
| Total | 46 (88.5%) | 6 (11.5%) |
Female Fertility in Carleton
Fertility by Age in Carleton
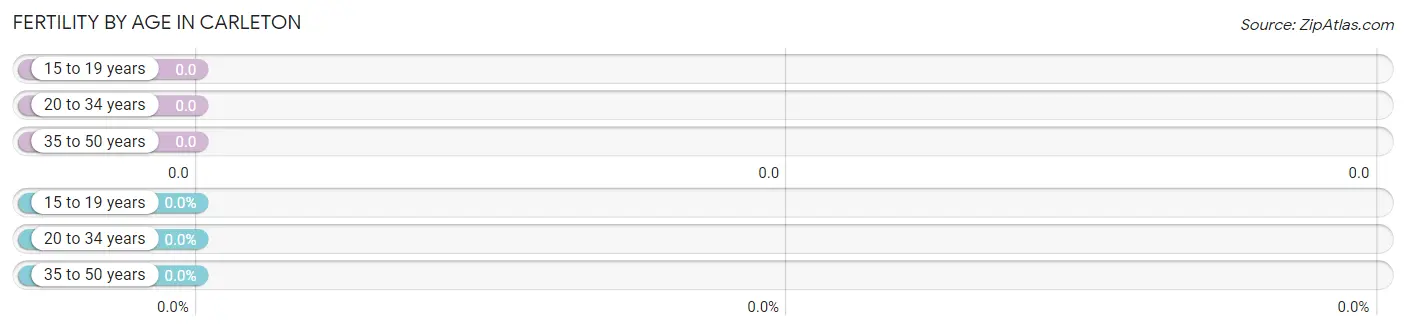
| Age Bracket | Women with Births | Births / 1,000 Women |
| 15 to 19 years | 0 (0.0%) | 0.0 |
| 20 to 34 years | 0 (0.0%) | 0.0 |
| 35 to 50 years | 0 (0.0%) | 0.0 |
| Total | 0 (0.0%) | 0.0 |
Fertility by Age by Marriage Status in Carleton
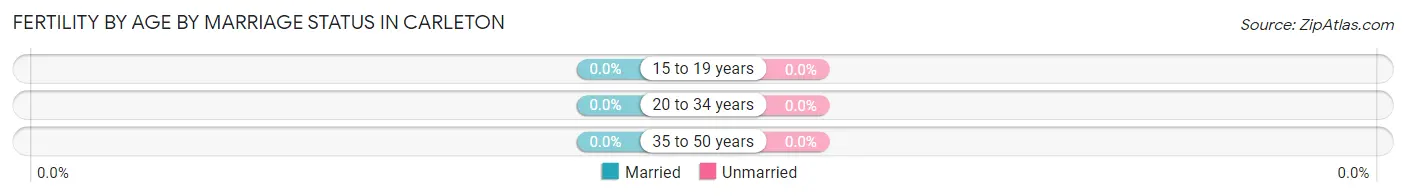
| Age Bracket | Married | Unmarried |
| 15 to 19 years | 0 (0.0%) | 0 (0.0%) |
| 20 to 34 years | 0 (0.0%) | 0 (0.0%) |
| 35 to 50 years | 0 (0.0%) | 0 (0.0%) |
| Total | 0 (0.0%) | 0 (0.0%) |
Fertility by Education in Carleton
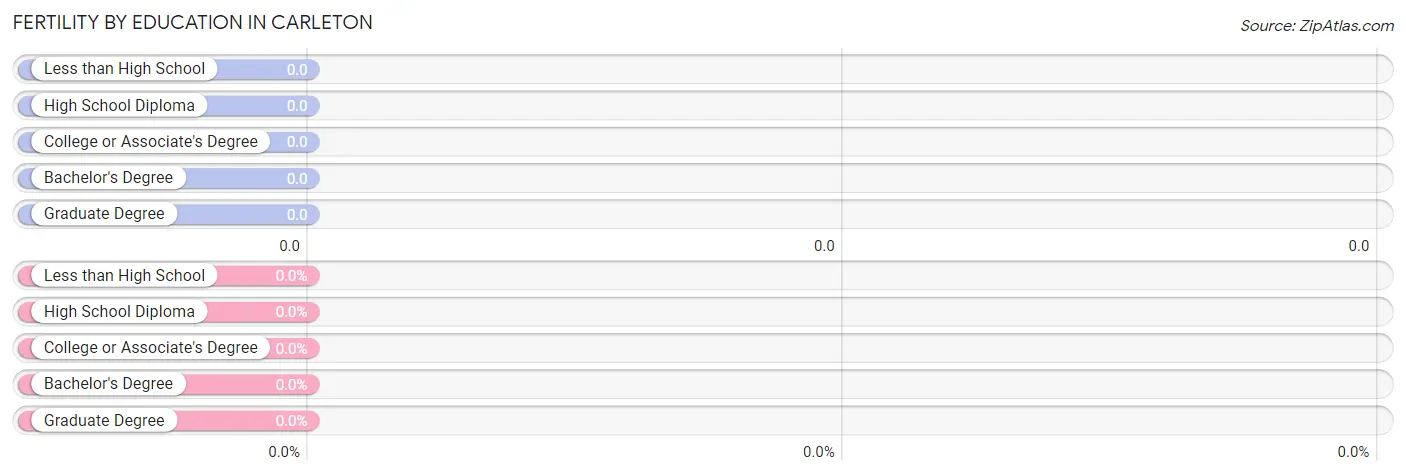
| Educational Attainment | Women with Births | Births / 1,000 Women |
| Less than High School | 0 (0.0%) | 0.0 |
| High School Diploma | 0 (0.0%) | 0.0 |
| College or Associate's Degree | 0 (0.0%) | 0.0 |
| Bachelor's Degree | 0 (0.0%) | 0.0 |
| Graduate Degree | 0 (0.0%) | 0.0 |
| Total | 0 (0.0%) | 0.0 |
Fertility by Education by Marriage Status in Carleton
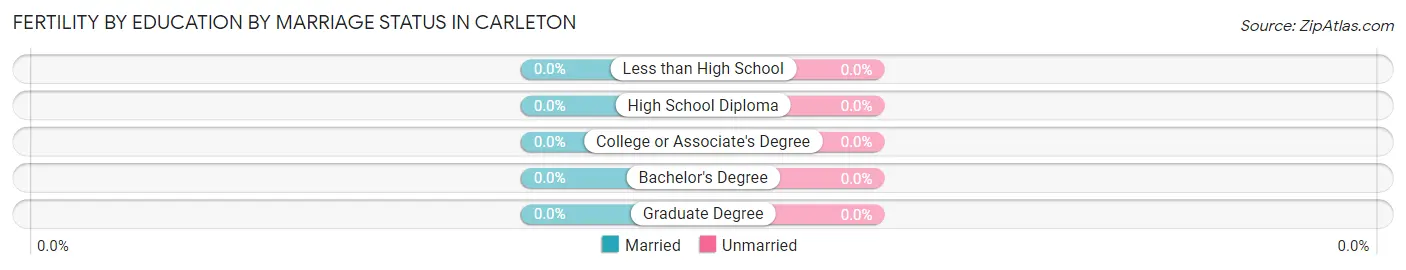
| Educational Attainment | Married | Unmarried |
| Less than High School | 0 (0.0%) | 0 (0.0%) |
| High School Diploma | 0 (0.0%) | 0 (0.0%) |
| College or Associate's Degree | 0 (0.0%) | 0 (0.0%) |
| Bachelor's Degree | 0 (0.0%) | 0 (0.0%) |
| Graduate Degree | 0 (0.0%) | 0 (0.0%) |
| Total | 0 (0.0%) | 0 (0.0%) |
Employment Characteristics in Carleton
Employment by Class of Employer in Carleton
Among the 107 employed individuals in Carleton, private company employees (79 | 73.8%), self-employed (not incorporated) (17 | 15.9%), and self-employed (incorporated) (5 | 4.7%) make up the most common classes of employment.
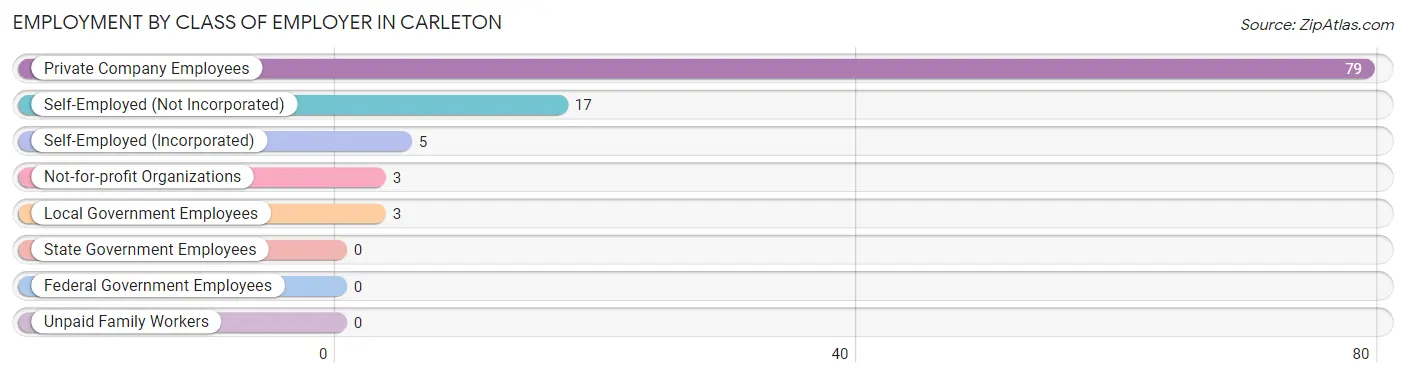
| Employer Class | # Employees | % Employees |
| Private Company Employees | 79 | 73.8% |
| Self-Employed (Incorporated) | 5 | 4.7% |
| Self-Employed (Not Incorporated) | 17 | 15.9% |
| Not-for-profit Organizations | 3 | 2.8% |
| Local Government Employees | 3 | 2.8% |
| State Government Employees | 0 | 0.0% |
| Federal Government Employees | 0 | 0.0% |
| Unpaid Family Workers | 0 | 0.0% |
| Total | 107 | 100.0% |
Employment Status by Age in Carleton
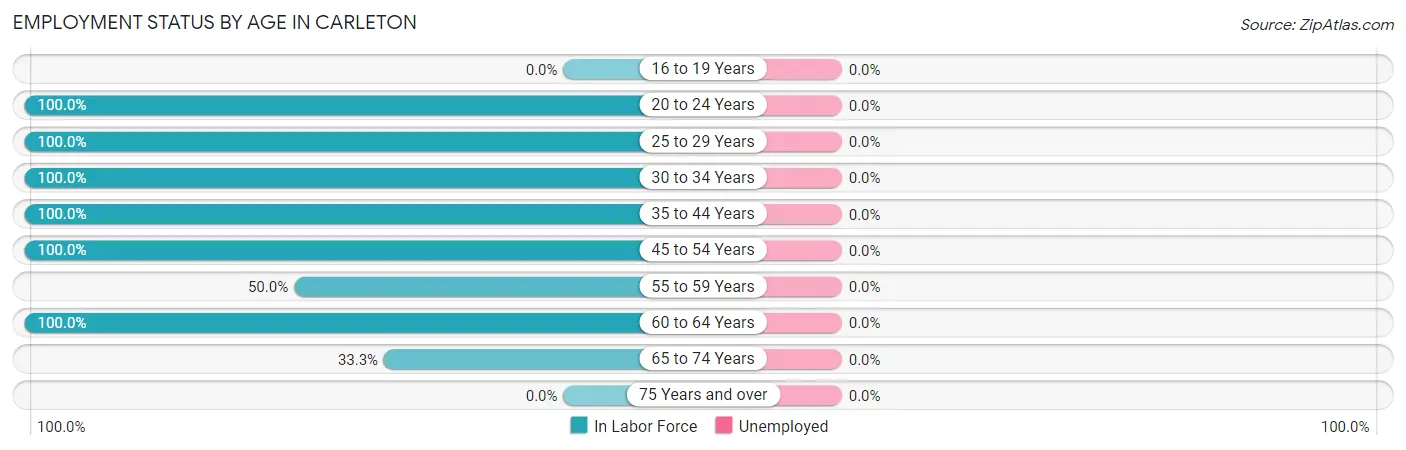
| Age Bracket | In Labor Force | Unemployed |
| 16 to 19 Years | 0 (0.0%) | 0 (0.0%) |
| 20 to 24 Years | 32 (100.0%) | 0 (0.0%) |
| 25 to 29 Years | 13 (100.0%) | 0 (0.0%) |
| 30 to 34 Years | 5 (100.0%) | 0 (0.0%) |
| 35 to 44 Years | 22 (100.0%) | 0 (0.0%) |
| 45 to 54 Years | 32 (100.0%) | 0 (0.0%) |
| 55 to 59 Years | 2 (50.0%) | 0 (0.0%) |
| 60 to 64 Years | 7 (100.0%) | 0 (0.0%) |
| 65 to 74 Years | 1 (33.3%) | 0 (0.0%) |
| 75 Years and over | 0 (0.0%) | 0 (0.0%) |
| Total | 114 (90.5%) | 0 (0.0%) |
Employment Status by Educational Attainment in Carleton
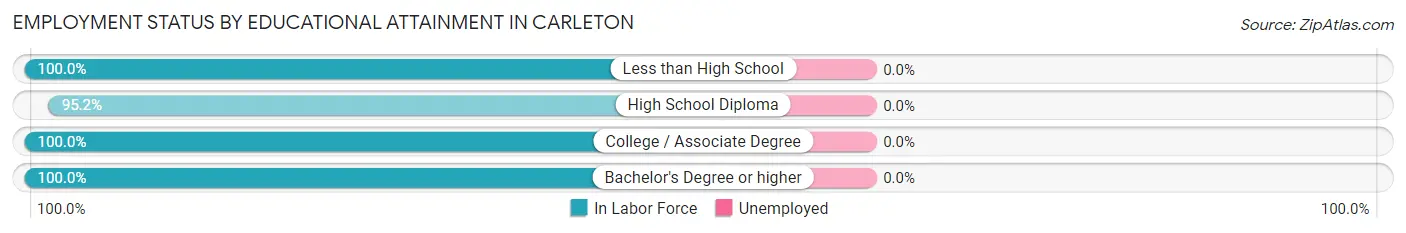
| Educational Attainment | In Labor Force | Unemployed |
| Less than High School | 2 (100.0%) | 0 (0.0%) |
| High School Diploma | 40 (95.2%) | 0 (0.0%) |
| College / Associate Degree | 15 (100.0%) | 0 (0.0%) |
| Bachelor's Degree or higher | 24 (100.0%) | 0 (0.0%) |
| Total | 81 (97.6%) | 0 (0.0%) |
Employment Occupations by Sex in Carleton
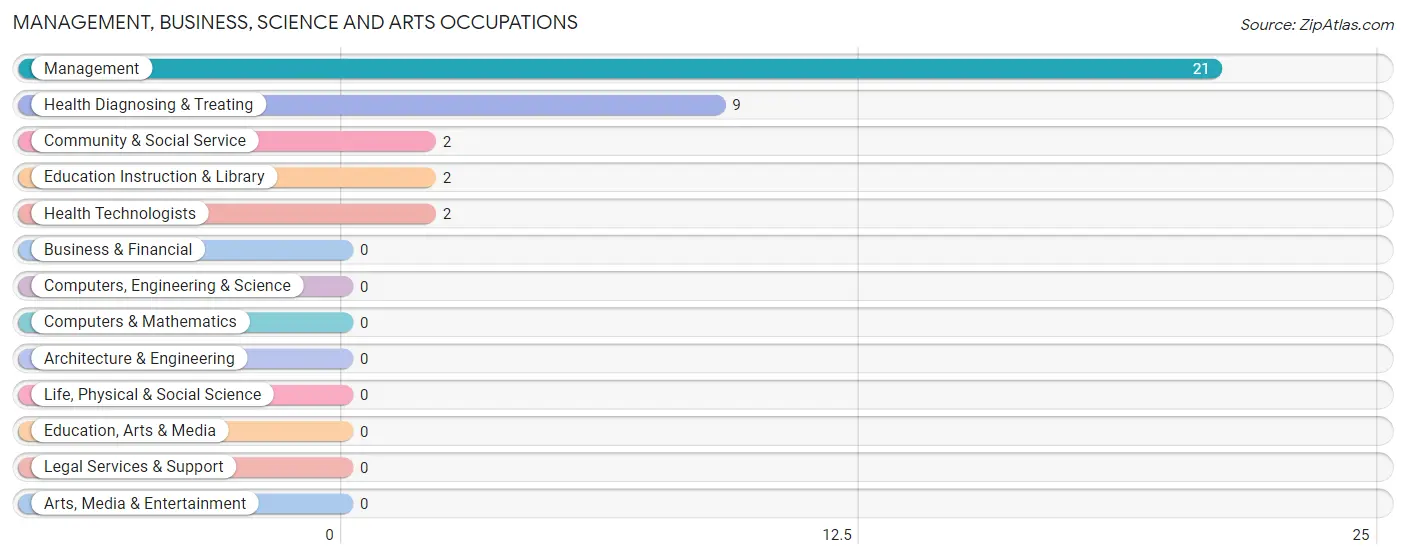
Management, Business, Science and Arts Occupations
The most common Management, Business, Science and Arts occupations in Carleton are Management (21 | 18.4%), Health Diagnosing & Treating (9 | 7.9%), Community & Social Service (2 | 1.8%), Education Instruction & Library (2 | 1.8%), and Health Technologists (2 | 1.8%).
Management, Business, Science and Arts Occupations by Sex
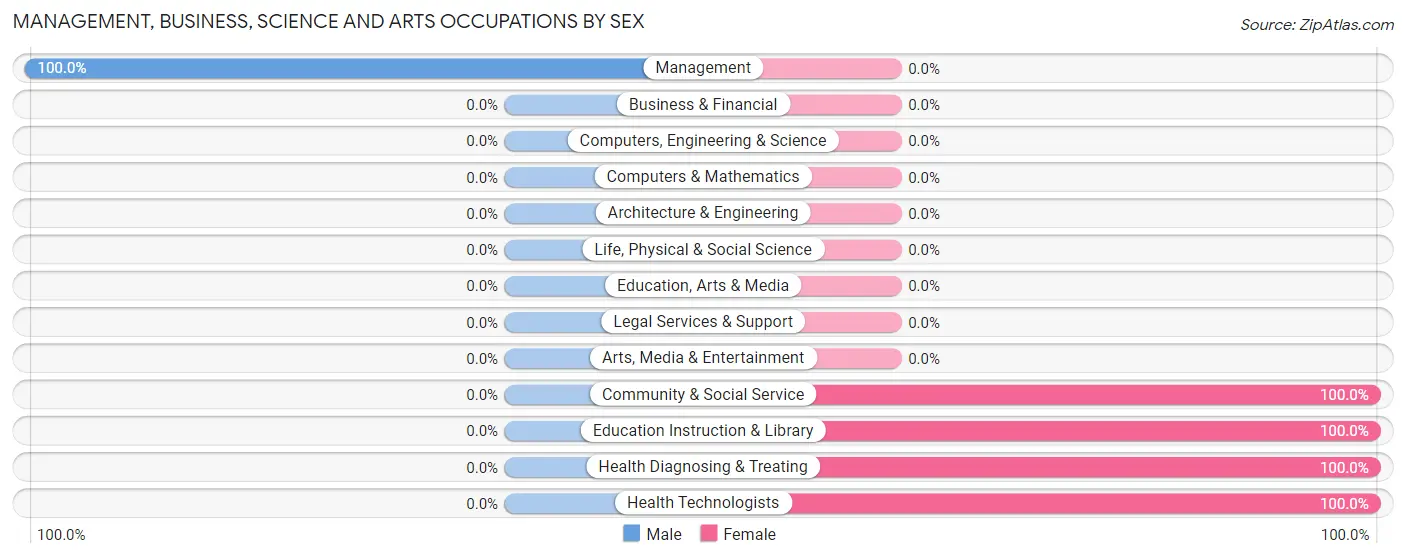
| Occupation | Male | Female |
| Management | 21 (100.0%) | 0 (0.0%) |
| Business & Financial | 0 (0.0%) | 0 (0.0%) |
| Computers, Engineering & Science | 0 (0.0%) | 0 (0.0%) |
| Computers & Mathematics | 0 (0.0%) | 0 (0.0%) |
| Architecture & Engineering | 0 (0.0%) | 0 (0.0%) |
| Life, Physical & Social Science | 0 (0.0%) | 0 (0.0%) |
| Community & Social Service | 0 (0.0%) | 2 (100.0%) |
| Education, Arts & Media | 0 (0.0%) | 0 (0.0%) |
| Legal Services & Support | 0 (0.0%) | 0 (0.0%) |
| Education Instruction & Library | 0 (0.0%) | 2 (100.0%) |
| Arts, Media & Entertainment | 0 (0.0%) | 0 (0.0%) |
| Health Diagnosing & Treating | 0 (0.0%) | 9 (100.0%) |
| Health Technologists | 0 (0.0%) | 2 (100.0%) |
| Total (Category) | 21 (65.6%) | 11 (34.4%) |
| Total (Overall) | 75 (65.8%) | 39 (34.2%) |
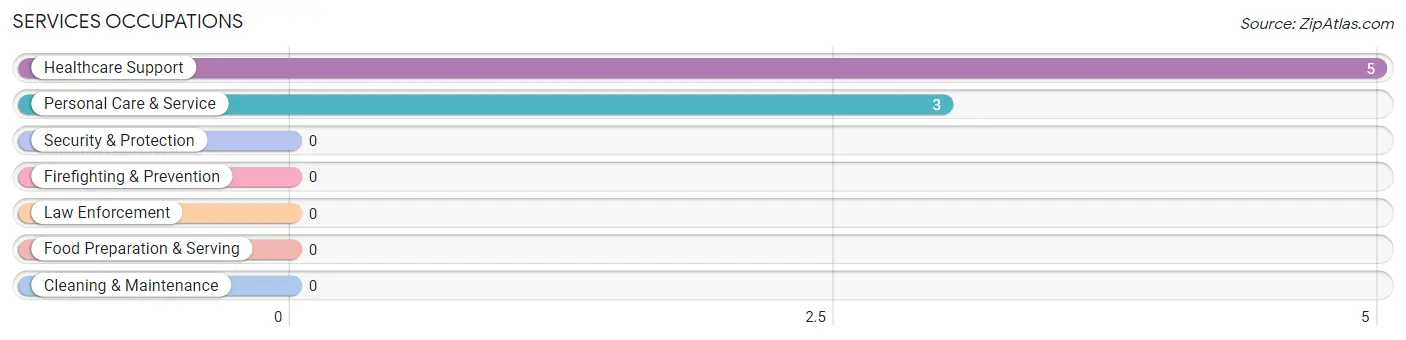
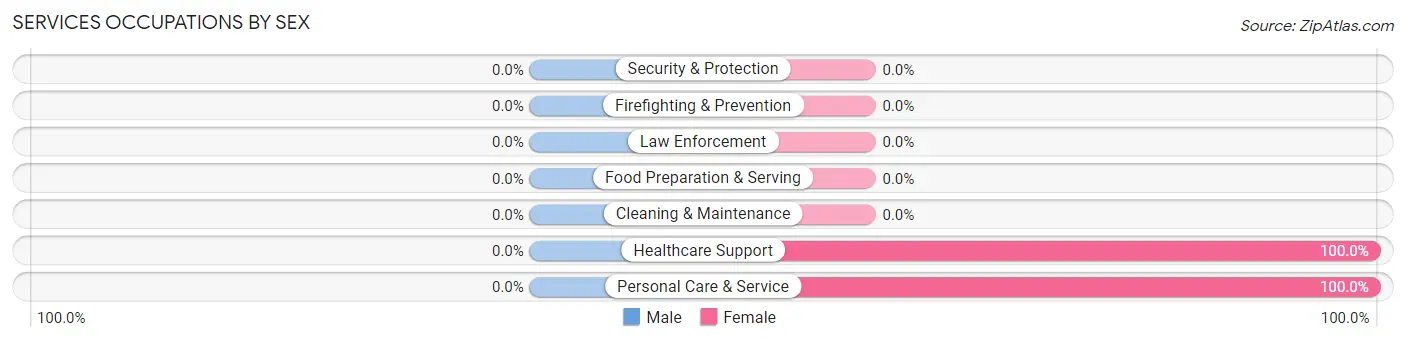
Services Occupations
The most common Services occupations in Carleton are Healthcare Support (5 | 4.4%), and Personal Care & Service (3 | 2.6%).
Services Occupations by Sex
| Occupation | Male | Female |
| Healthcare Support | 0 (0.0%) | 5 (100.0%) |
| Security & Protection | 0 (0.0%) | 0 (0.0%) |
| Firefighting & Prevention | 0 (0.0%) | 0 (0.0%) |
| Law Enforcement | 0 (0.0%) | 0 (0.0%) |
| Food Preparation & Serving | 0 (0.0%) | 0 (0.0%) |
| Cleaning & Maintenance | 0 (0.0%) | 0 (0.0%) |
| Personal Care & Service | 0 (0.0%) | 3 (100.0%) |
| Total (Category) | 0 (0.0%) | 8 (100.0%) |
| Total (Overall) | 75 (65.8%) | 39 (34.2%) |
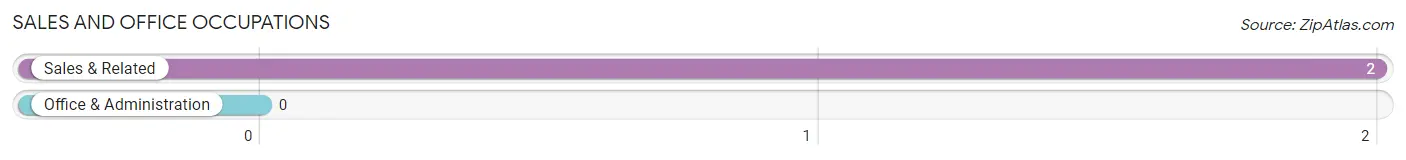
Sales and Office Occupations
The most common Sales and Office occupations in Carleton are , and Sales & Related (2 | 1.8%).
Sales and Office Occupations by Sex
| Occupation | Male | Female |
| Sales & Related | 2 (100.0%) | 0 (0.0%) |
| Office & Administration | 0 (0.0%) | 0 (0.0%) |
| Total (Category) | 2 (100.0%) | 0 (0.0%) |
| Total (Overall) | 75 (65.8%) | 39 (34.2%) |
Natural Resources, Construction and Maintenance Occupations
The most common Natural Resources, Construction and Maintenance occupations in Carleton are , and Farming, Fishing & Forestry (32 | 28.1%).
Natural Resources, Construction and Maintenance Occupations by Sex
| Occupation | Male | Female |
| Farming, Fishing & Forestry | 12 (37.5%) | 20 (62.5%) |
| Construction & Extraction | 0 (0.0%) | 0 (0.0%) |
| Installation, Maintenance & Repair | 0 (0.0%) | 0 (0.0%) |
| Total (Category) | 12 (37.5%) | 20 (62.5%) |
| Total (Overall) | 75 (65.8%) | 39 (34.2%) |
Production, Transportation and Moving Occupations
The most common Production, Transportation and Moving occupations in Carleton are Production (38 | 33.3%), and Transportation (2 | 1.8%).
Production, Transportation and Moving Occupations by Sex
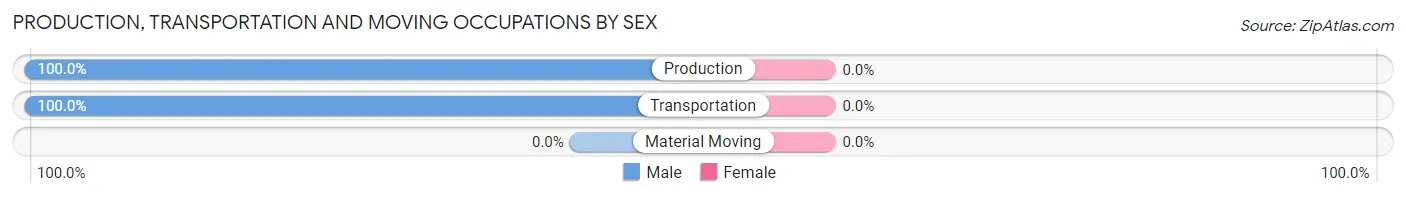
| Occupation | Male | Female |
| Production | 38 (100.0%) | 0 (0.0%) |
| Transportation | 2 (100.0%) | 0 (0.0%) |
| Material Moving | 0 (0.0%) | 0 (0.0%) |
| Total (Category) | 40 (100.0%) | 0 (0.0%) |
| Total (Overall) | 75 (65.8%) | 39 (34.2%) |
Employment Industries by Sex in Carleton
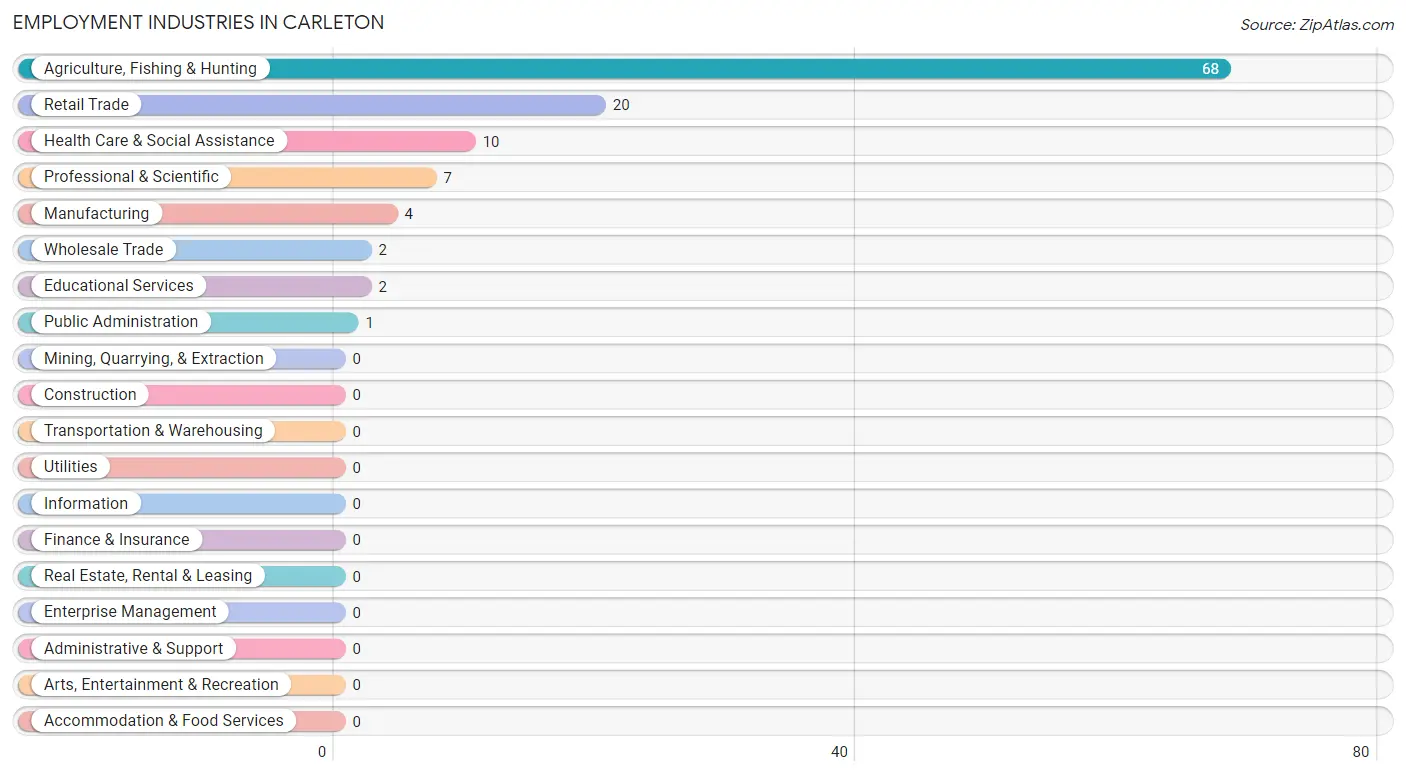
Employment Industries in Carleton
The major employment industries in Carleton include Agriculture, Fishing & Hunting (68 | 59.7%), Retail Trade (20 | 17.5%), Health Care & Social Assistance (10 | 8.8%), Professional & Scientific (7 | 6.1%), and Manufacturing (4 | 3.5%).
Employment Industries by Sex in Carleton
The Carleton industries that see more men than women are Manufacturing (100.0%), Wholesale Trade (100.0%), and Public Administration (100.0%), whereas the industries that tend to have a higher number of women are Professional & Scientific (100.0%), Educational Services (100.0%), and Health Care & Social Assistance (100.0%).
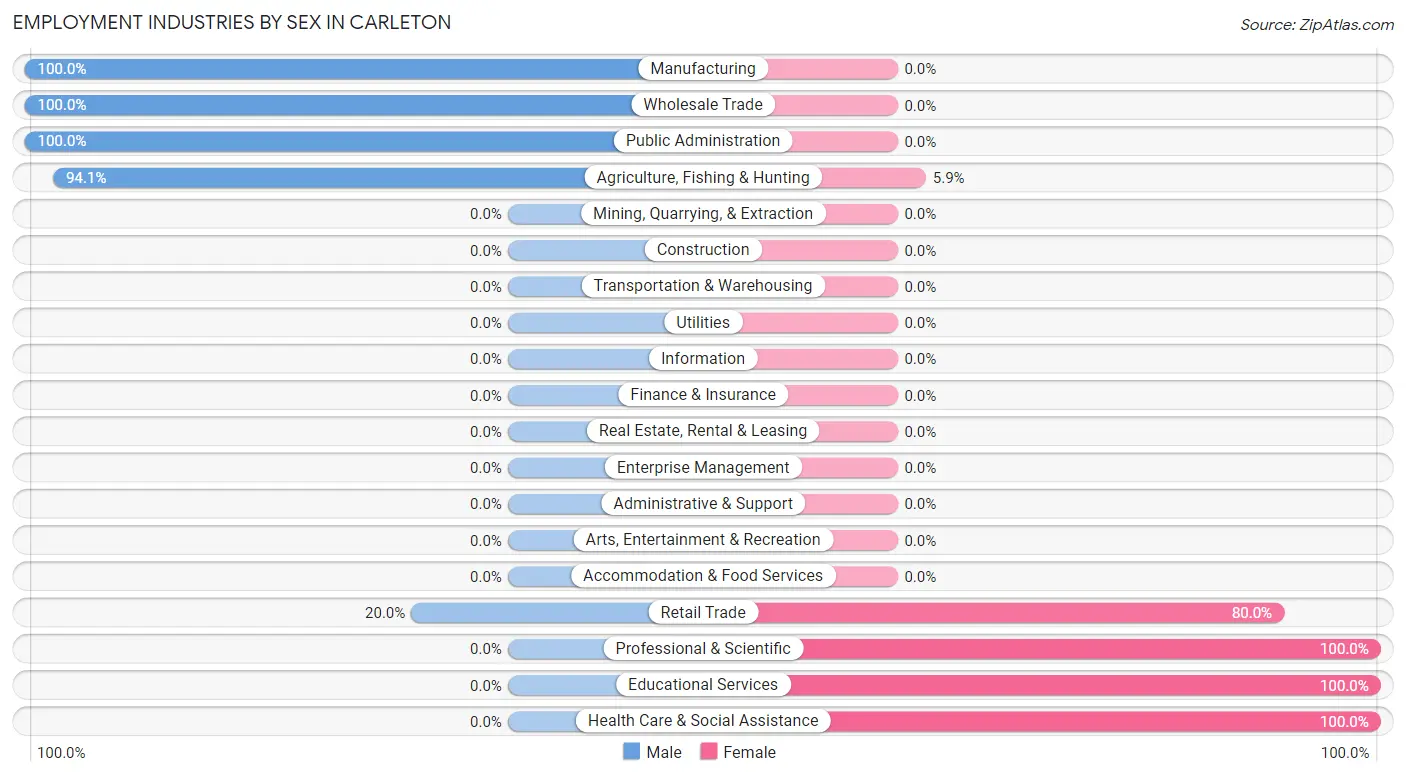
| Industry | Male | Female |
| Agriculture, Fishing & Hunting | 64 (94.1%) | 4 (5.9%) |
| Mining, Quarrying, & Extraction | 0 (0.0%) | 0 (0.0%) |
| Construction | 0 (0.0%) | 0 (0.0%) |
| Manufacturing | 4 (100.0%) | 0 (0.0%) |
| Wholesale Trade | 2 (100.0%) | 0 (0.0%) |
| Retail Trade | 4 (20.0%) | 16 (80.0%) |
| Transportation & Warehousing | 0 (0.0%) | 0 (0.0%) |
| Utilities | 0 (0.0%) | 0 (0.0%) |
| Information | 0 (0.0%) | 0 (0.0%) |
| Finance & Insurance | 0 (0.0%) | 0 (0.0%) |
| Real Estate, Rental & Leasing | 0 (0.0%) | 0 (0.0%) |
| Professional & Scientific | 0 (0.0%) | 7 (100.0%) |
| Enterprise Management | 0 (0.0%) | 0 (0.0%) |
| Administrative & Support | 0 (0.0%) | 0 (0.0%) |
| Educational Services | 0 (0.0%) | 2 (100.0%) |
| Health Care & Social Assistance | 0 (0.0%) | 10 (100.0%) |
| Arts, Entertainment & Recreation | 0 (0.0%) | 0 (0.0%) |
| Accommodation & Food Services | 0 (0.0%) | 0 (0.0%) |
| Public Administration | 1 (100.0%) | 0 (0.0%) |
| Total | 75 (65.8%) | 39 (34.2%) |
Education in Carleton
School Enrollment in Carleton
The most common levels of schooling among the 37 students in Carleton are nursery / preschool (16 | 43.2%), middle school (14 | 37.8%), and kindergarten (5 | 13.5%).
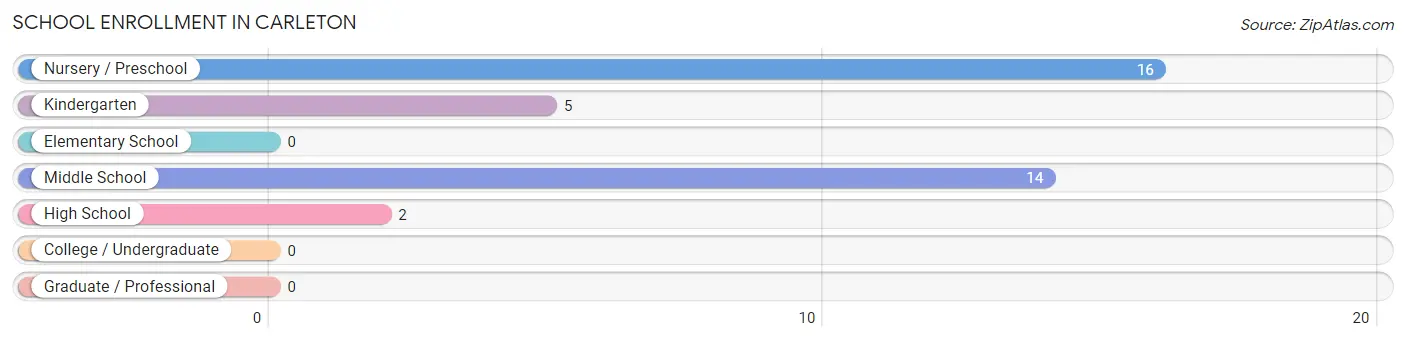
| School Level | # Students | % Students |
| Nursery / Preschool | 16 | 43.2% |
| Kindergarten | 5 | 13.5% |
| Elementary School | 0 | 0.0% |
| Middle School | 14 | 37.8% |
| High School | 2 | 5.4% |
| College / Undergraduate | 0 | 0.0% |
| Graduate / Professional | 0 | 0.0% |
| Total | 37 | 100.0% |
School Enrollment by Age by Funding Source in Carleton
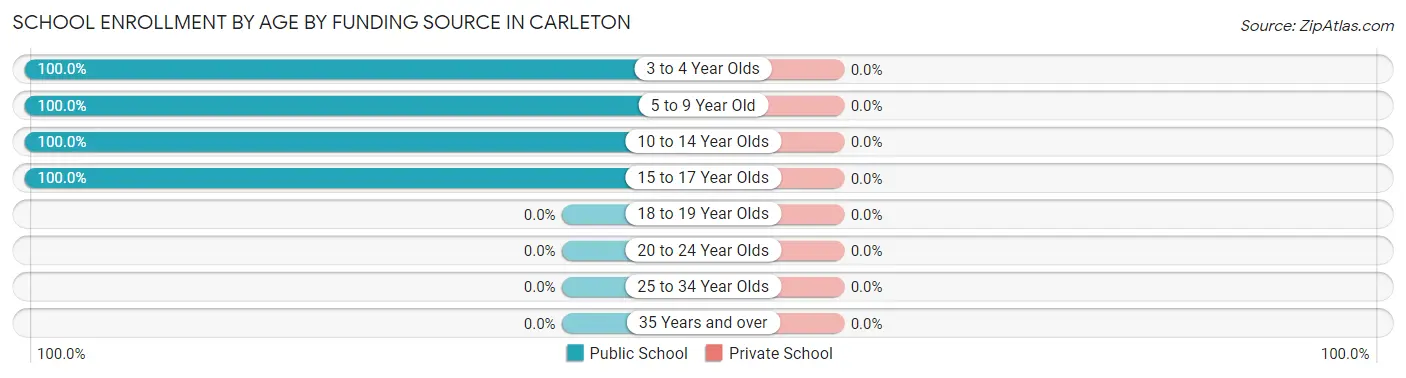
| Age Bracket | Public School | Private School |
| 3 to 4 Year Olds | 3 (100.0%) | 0 (0.0%) |
| 5 to 9 Year Old | 18 (100.0%) | 0 (0.0%) |
| 10 to 14 Year Olds | 14 (100.0%) | 0 (0.0%) |
| 15 to 17 Year Olds | 2 (100.0%) | 0 (0.0%) |
| 18 to 19 Year Olds | 0 (0.0%) | 0 (0.0%) |
| 20 to 24 Year Olds | 0 (0.0%) | 0 (0.0%) |
| 25 to 34 Year Olds | 0 (0.0%) | 0 (0.0%) |
| 35 Years and over | 0 (0.0%) | 0 (0.0%) |
| Total | 37 (100.0%) | 0 (0.0%) |
Educational Attainment by Field of Study in Carleton
Bio, nature & agricultural (19 | 79.2%), engineering (3 | 12.5%), and education (2 | 8.3%) are the most common fields of study among 24 individuals in Carleton who have obtained a bachelor's degree or higher.
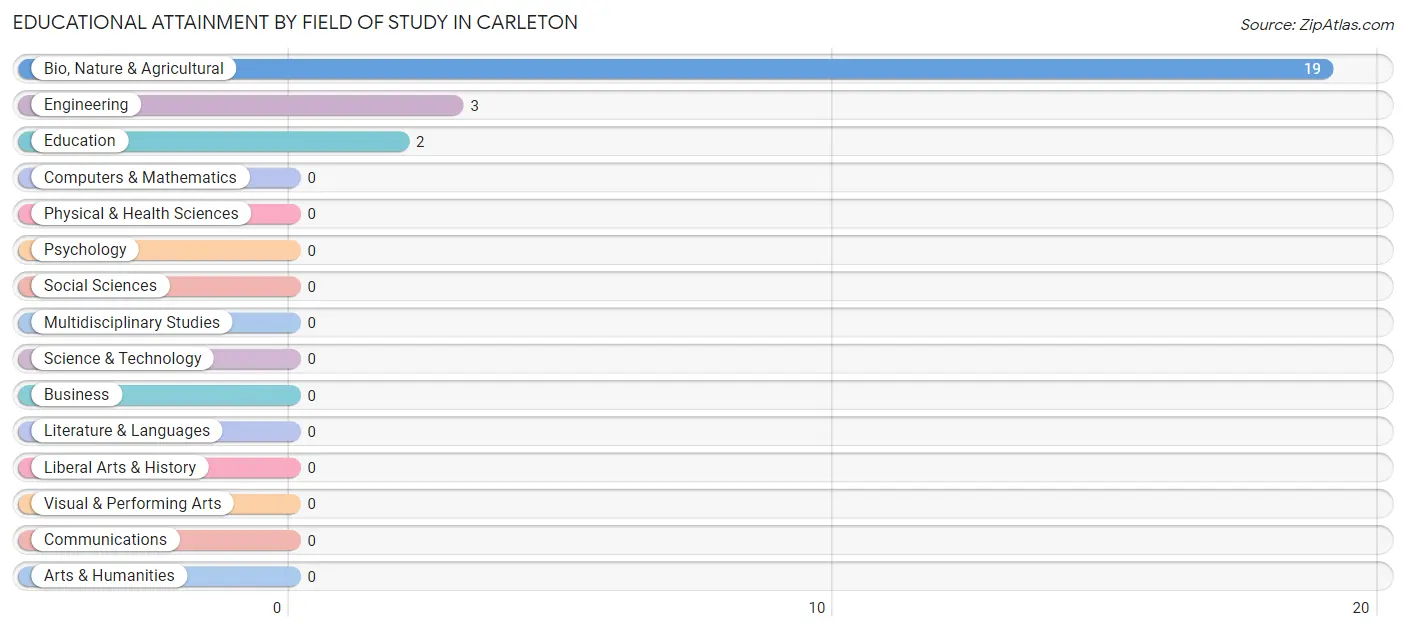
| Field of Study | # Graduates | % Graduates |
| Computers & Mathematics | 0 | 0.0% |
| Bio, Nature & Agricultural | 19 | 79.2% |
| Physical & Health Sciences | 0 | 0.0% |
| Psychology | 0 | 0.0% |
| Social Sciences | 0 | 0.0% |
| Engineering | 3 | 12.5% |
| Multidisciplinary Studies | 0 | 0.0% |
| Science & Technology | 0 | 0.0% |
| Business | 0 | 0.0% |
| Education | 2 | 8.3% |
| Literature & Languages | 0 | 0.0% |
| Liberal Arts & History | 0 | 0.0% |
| Visual & Performing Arts | 0 | 0.0% |
| Communications | 0 | 0.0% |
| Arts & Humanities | 0 | 0.0% |
| Total | 24 | 100.0% |
Transportation & Commute in Carleton
Vehicle Availability by Sex in Carleton
The most prevalent vehicle ownership categories in Carleton are males with 4 vehicles (44, accounting for 61.1%) and females with 4 vehicles (16, making up 125.7%).
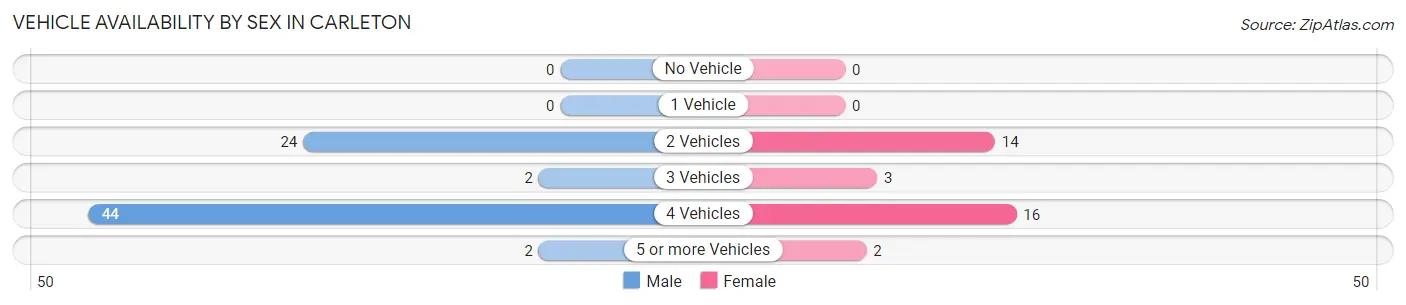
| Vehicles Available | Male | Female |
| No Vehicle | 0 (0.0%) | 0 (0.0%) |
| 1 Vehicle | 0 (0.0%) | 0 (0.0%) |
| 2 Vehicles | 24 (33.3%) | 14 (40.0%) |
| 3 Vehicles | 2 (2.8%) | 3 (8.6%) |
| 4 Vehicles | 44 (61.1%) | 16 (45.7%) |
| 5 or more Vehicles | 2 (2.8%) | 2 (5.7%) |
| Total | 72 (100.0%) | 35 (100.0%) |
Commute Time in Carleton
The most frequently occuring commute durations in Carleton are 20 to 24 minutes (34 commuters, 31.8%), 25 to 29 minutes (34 commuters, 31.8%), and 30 to 34 minutes (21 commuters, 19.6%).
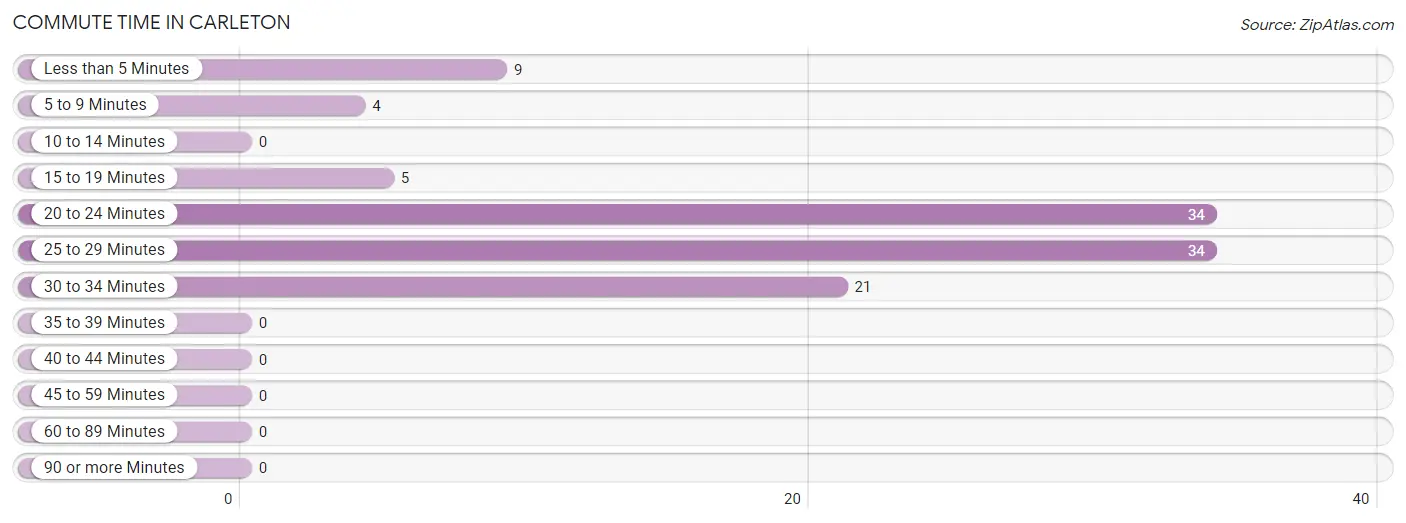
| Commute Time | # Commuters | % Commuters |
| Less than 5 Minutes | 9 | 8.4% |
| 5 to 9 Minutes | 4 | 3.7% |
| 10 to 14 Minutes | 0 | 0.0% |
| 15 to 19 Minutes | 5 | 4.7% |
| 20 to 24 Minutes | 34 | 31.8% |
| 25 to 29 Minutes | 34 | 31.8% |
| 30 to 34 Minutes | 21 | 19.6% |
| 35 to 39 Minutes | 0 | 0.0% |
| 40 to 44 Minutes | 0 | 0.0% |
| 45 to 59 Minutes | 0 | 0.0% |
| 60 to 89 Minutes | 0 | 0.0% |
| 90 or more Minutes | 0 | 0.0% |
Commute Time by Sex in Carleton
The most common commute times in Carleton are 25 to 29 minutes (32 commuters, 44.4%) for males and 30 to 34 minutes (21 commuters, 60.0%) for females.
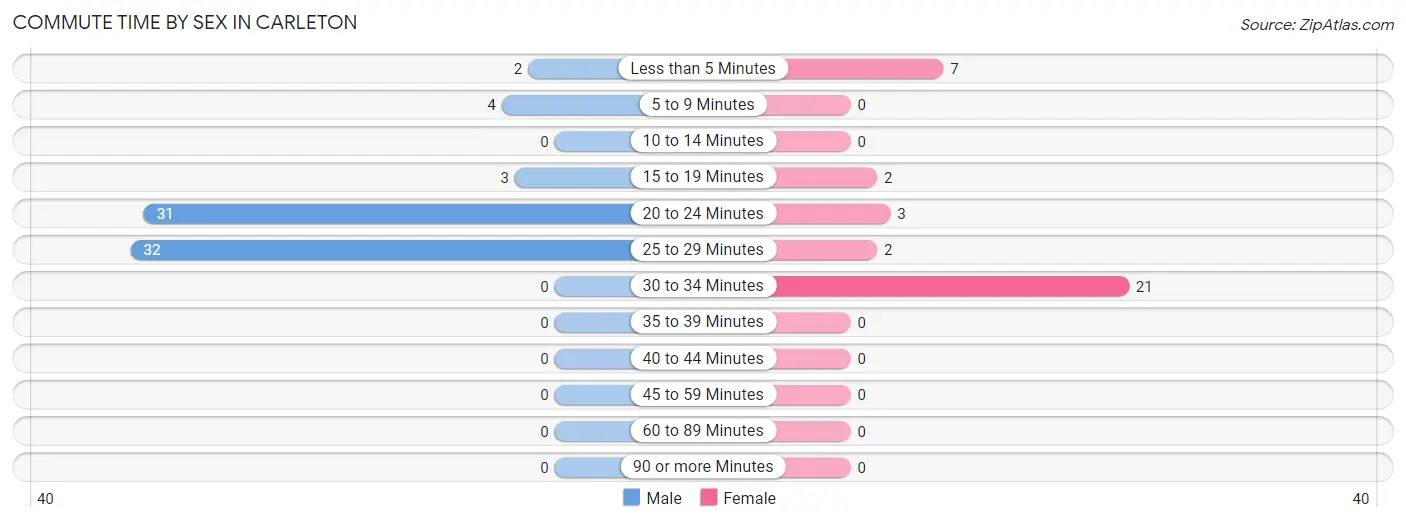
| Commute Time | Male | Female |
| Less than 5 Minutes | 2 (2.8%) | 7 (20.0%) |
| 5 to 9 Minutes | 4 (5.6%) | 0 (0.0%) |
| 10 to 14 Minutes | 0 (0.0%) | 0 (0.0%) |
| 15 to 19 Minutes | 3 (4.2%) | 2 (5.7%) |
| 20 to 24 Minutes | 31 (43.1%) | 3 (8.6%) |
| 25 to 29 Minutes | 32 (44.4%) | 2 (5.7%) |
| 30 to 34 Minutes | 0 (0.0%) | 21 (60.0%) |
| 35 to 39 Minutes | 0 (0.0%) | 0 (0.0%) |
| 40 to 44 Minutes | 0 (0.0%) | 0 (0.0%) |
| 45 to 59 Minutes | 0 (0.0%) | 0 (0.0%) |
| 60 to 89 Minutes | 0 (0.0%) | 0 (0.0%) |
| 90 or more Minutes | 0 (0.0%) | 0 (0.0%) |
Time of Departure to Work by Sex in Carleton
The most frequent times of departure to work in Carleton are 5:00 AM to 5:29 AM (32, 44.4%) for males and 7:00 AM to 7:29 AM (28, 80.0%) for females.
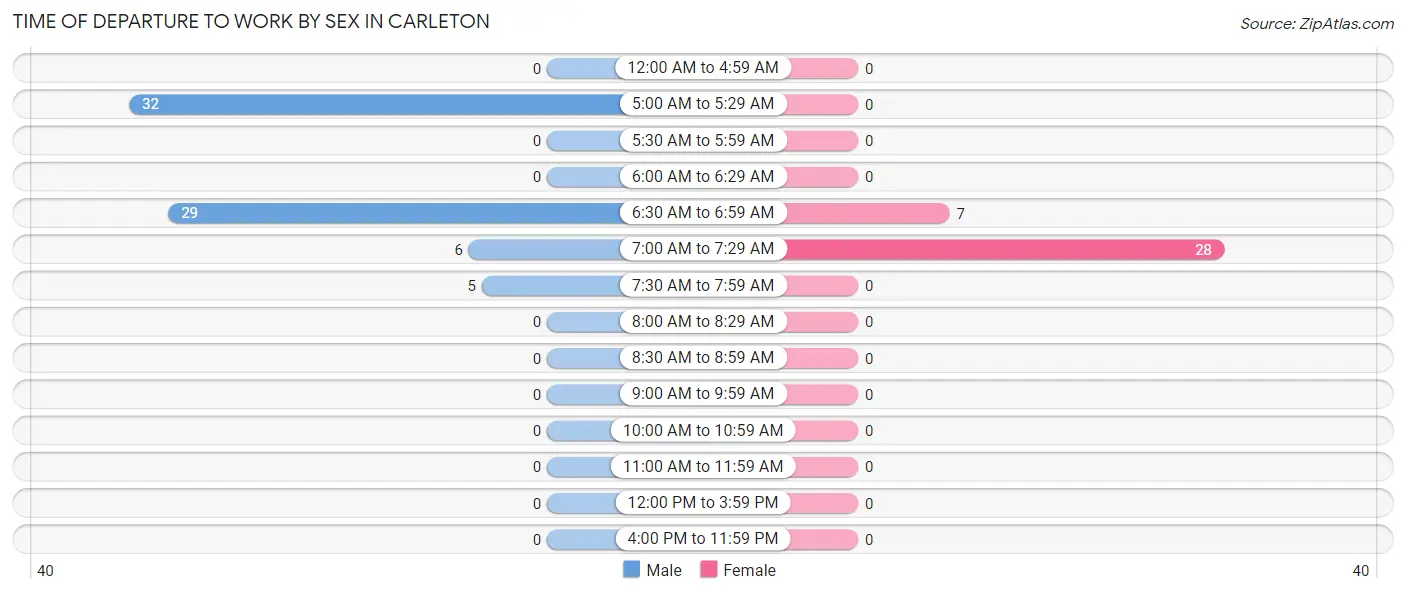
| Time of Departure | Male | Female |
| 12:00 AM to 4:59 AM | 0 (0.0%) | 0 (0.0%) |
| 5:00 AM to 5:29 AM | 32 (44.4%) | 0 (0.0%) |
| 5:30 AM to 5:59 AM | 0 (0.0%) | 0 (0.0%) |
| 6:00 AM to 6:29 AM | 0 (0.0%) | 0 (0.0%) |
| 6:30 AM to 6:59 AM | 29 (40.3%) | 7 (20.0%) |
| 7:00 AM to 7:29 AM | 6 (8.3%) | 28 (80.0%) |
| 7:30 AM to 7:59 AM | 5 (6.9%) | 0 (0.0%) |
| 8:00 AM to 8:29 AM | 0 (0.0%) | 0 (0.0%) |
| 8:30 AM to 8:59 AM | 0 (0.0%) | 0 (0.0%) |
| 9:00 AM to 9:59 AM | 0 (0.0%) | 0 (0.0%) |
| 10:00 AM to 10:59 AM | 0 (0.0%) | 0 (0.0%) |
| 11:00 AM to 11:59 AM | 0 (0.0%) | 0 (0.0%) |
| 12:00 PM to 3:59 PM | 0 (0.0%) | 0 (0.0%) |
| 4:00 PM to 11:59 PM | 0 (0.0%) | 0 (0.0%) |
| Total | 72 (100.0%) | 35 (100.0%) |
Housing Occupancy in Carleton
Occupancy by Ownership in Carleton
Of the total 52 dwellings in Carleton, owner-occupied units account for 52 (100.0%), while renter-occupied units make up 0 (0.0%).
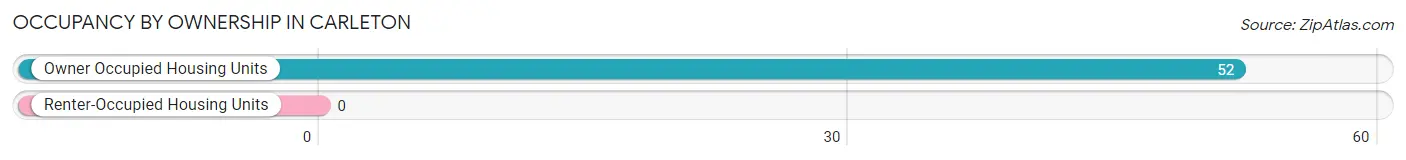
| Occupancy | # Housing Units | % Housing Units |
| Owner Occupied Housing Units | 52 | 100.0% |
| Renter-Occupied Housing Units | 0 | 0.0% |
| Total Occupied Housing Units | 52 | 100.0% |
Occupancy by Household Size in Carleton
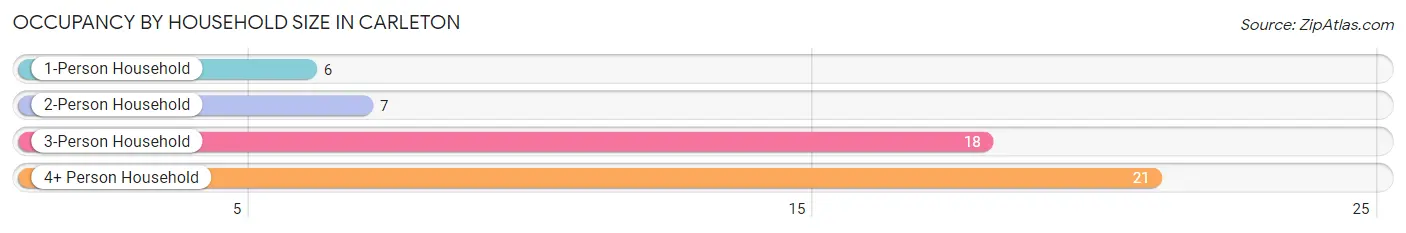
| Household Size | # Housing Units | % Housing Units |
| 1-Person Household | 6 | 11.5% |
| 2-Person Household | 7 | 13.5% |
| 3-Person Household | 18 | 34.6% |
| 4+ Person Household | 21 | 40.4% |
| Total Housing Units | 52 | 100.0% |
Occupancy by Ownership by Household Size in Carleton
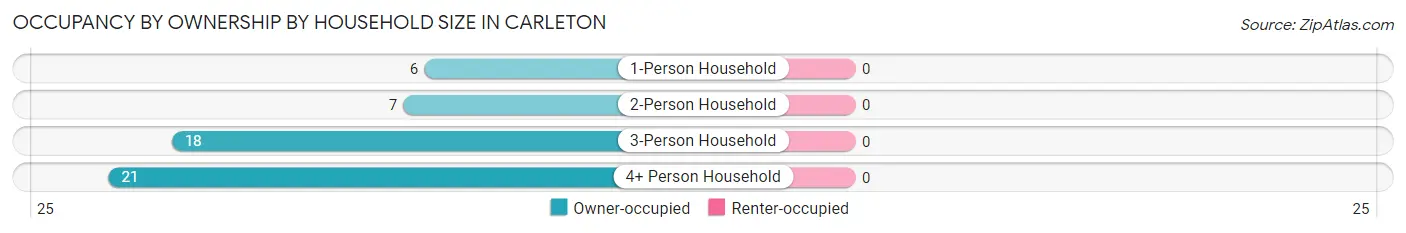
| Household Size | Owner-occupied | Renter-occupied |
| 1-Person Household | 6 (100.0%) | 0 (0.0%) |
| 2-Person Household | 7 (100.0%) | 0 (0.0%) |
| 3-Person Household | 18 (100.0%) | 0 (0.0%) |
| 4+ Person Household | 21 (100.0%) | 0 (0.0%) |
| Total Housing Units | 52 (100.0%) | 0 (0.0%) |
Occupancy by Educational Attainment in Carleton
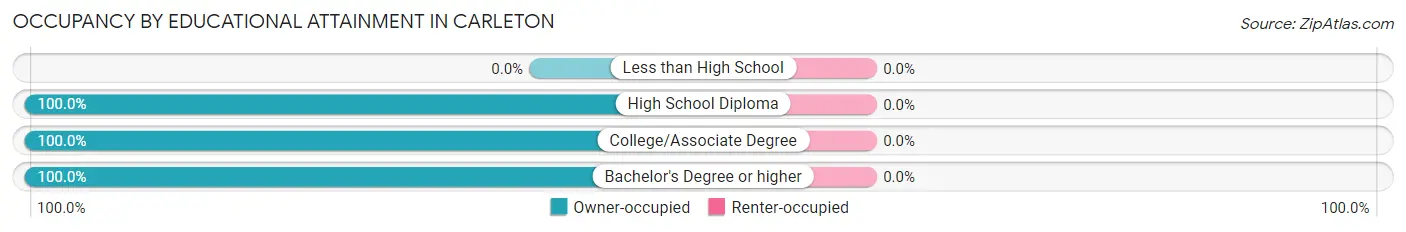
| Household Size | Owner-occupied | Renter-occupied |
| Less than High School | 0 (0.0%) | 0 (0.0%) |
| High School Diploma | 18 (100.0%) | 0 (0.0%) |
| College/Associate Degree | 13 (100.0%) | 0 (0.0%) |
| Bachelor's Degree or higher | 21 (100.0%) | 0 (0.0%) |
Occupancy by Age of Householder in Carleton
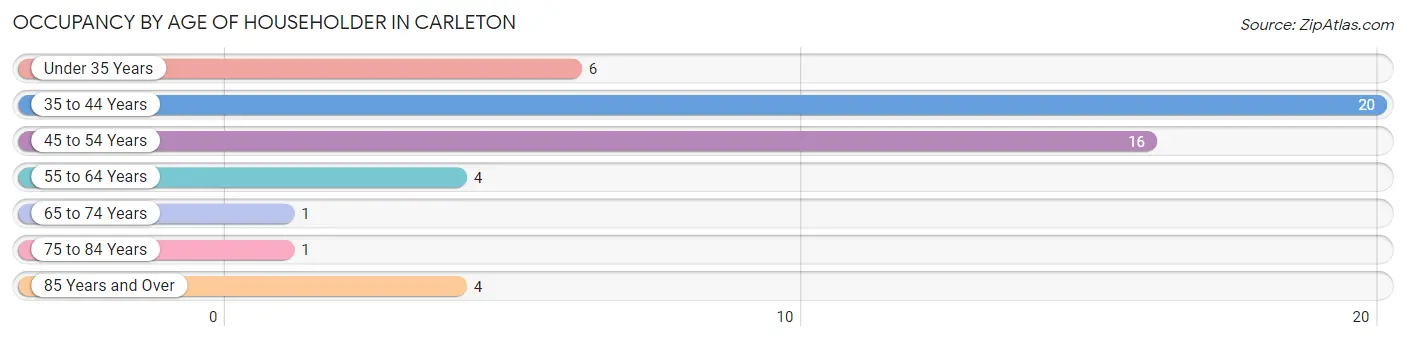
| Age Bracket | # Households | % Households |
| Under 35 Years | 6 | 11.5% |
| 35 to 44 Years | 20 | 38.5% |
| 45 to 54 Years | 16 | 30.8% |
| 55 to 64 Years | 4 | 7.7% |
| 65 to 74 Years | 1 | 1.9% |
| 75 to 84 Years | 1 | 1.9% |
| 85 Years and Over | 4 | 7.7% |
| Total | 52 | 100.0% |
Housing Finances in Carleton
Median Income by Occupancy in Carleton
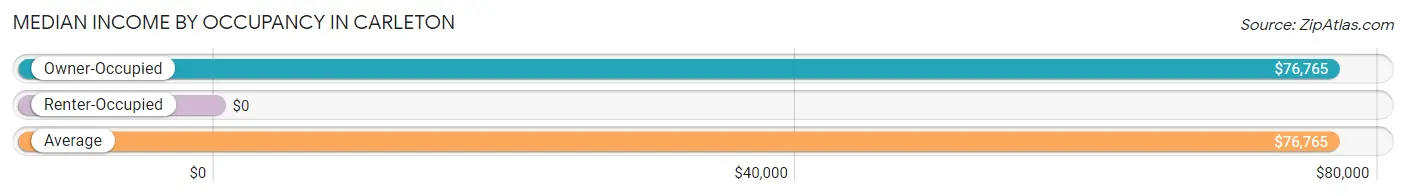
| Occupancy Type | # Households | Median Income |
| Owner-Occupied | 52 (100.0%) | $76,765 |
| Renter-Occupied | 0 (0.0%) | $0 |
| Average | 52 (100.0%) | $76,765 |
Occupancy by Householder Income Bracket in Carleton
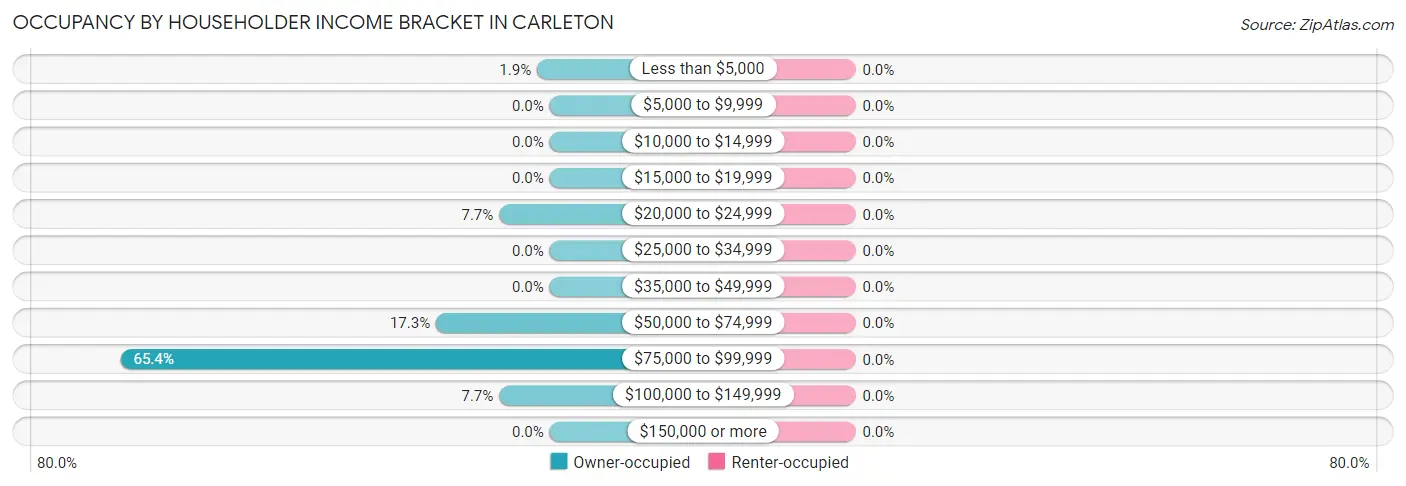
| Income Bracket | Owner-occupied | Renter-occupied |
| Less than $5,000 | 1 (1.9%) | 0 (0.0%) |
| $5,000 to $9,999 | 0 (0.0%) | 0 (0.0%) |
| $10,000 to $14,999 | 0 (0.0%) | 0 (0.0%) |
| $15,000 to $19,999 | 0 (0.0%) | 0 (0.0%) |
| $20,000 to $24,999 | 4 (7.7%) | 0 (0.0%) |
| $25,000 to $34,999 | 0 (0.0%) | 0 (0.0%) |
| $35,000 to $49,999 | 0 (0.0%) | 0 (0.0%) |
| $50,000 to $74,999 | 9 (17.3%) | 0 (0.0%) |
| $75,000 to $99,999 | 34 (65.4%) | 0 (0.0%) |
| $100,000 to $149,999 | 4 (7.7%) | 0 (0.0%) |
| $150,000 or more | 0 (0.0%) | 0 (0.0%) |
| Total | 52 (100.0%) | 0 (0.0%) |
Monthly Housing Cost Tiers in Carleton
| Monthly Cost | Owner-occupied | Renter-occupied |
| Less than $300 | 1 (1.9%) | 0 (0.0%) |
| $300 to $499 | 21 (40.4%) | 0 (0.0%) |
| $500 to $799 | 28 (53.8%) | 0 (0.0%) |
| $800 to $999 | 2 (3.8%) | 0 (0.0%) |
| $1,000 to $1,499 | 0 (0.0%) | 0 (0.0%) |
| $1,500 to $1,999 | 0 (0.0%) | 0 (0.0%) |
| $2,000 to $2,499 | 0 (0.0%) | 0 (0.0%) |
| $2,500 to $2,999 | 0 (0.0%) | 0 (0.0%) |
| $3,000 or more | 0 (0.0%) | 0 (0.0%) |
| Total | 52 (100.0%) | 0 (0.0%) |
Physical Housing Characteristics in Carleton
Housing Structures in Carleton
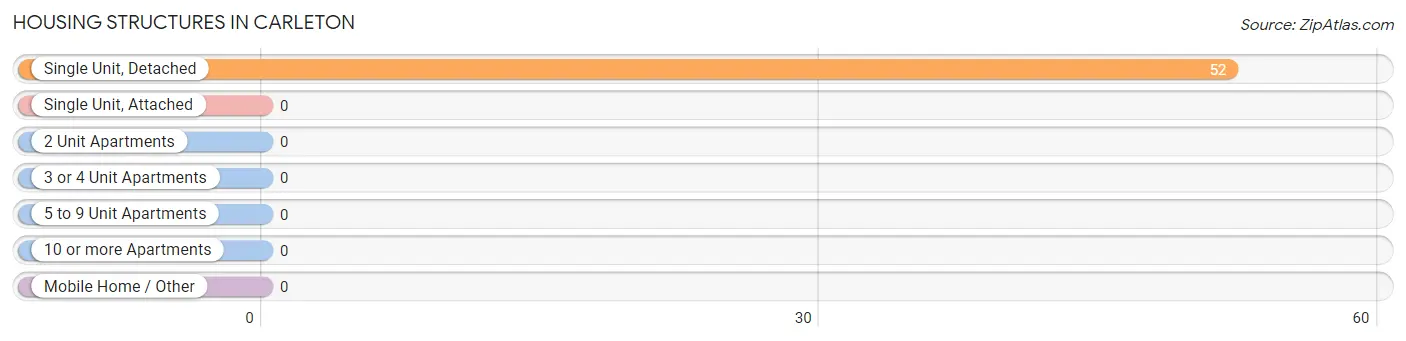
| Structure Type | # Housing Units | % Housing Units |
| Single Unit, Detached | 52 | 100.0% |
| Single Unit, Attached | 0 | 0.0% |
| 2 Unit Apartments | 0 | 0.0% |
| 3 or 4 Unit Apartments | 0 | 0.0% |
| 5 to 9 Unit Apartments | 0 | 0.0% |
| 10 or more Apartments | 0 | 0.0% |
| Mobile Home / Other | 0 | 0.0% |
| Total | 52 | 100.0% |
Housing Structures by Occupancy in Carleton
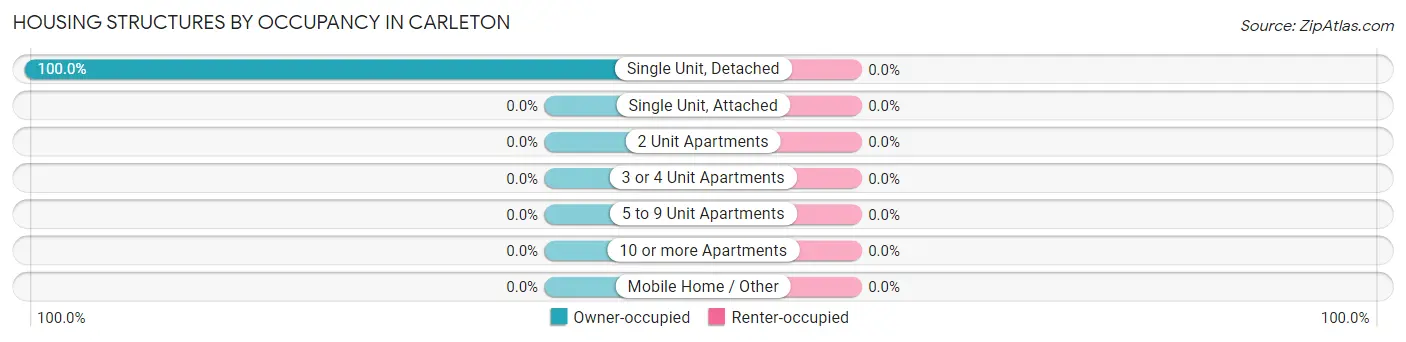
| Structure Type | Owner-occupied | Renter-occupied |
| Single Unit, Detached | 52 (100.0%) | 0 (0.0%) |
| Single Unit, Attached | 0 (0.0%) | 0 (0.0%) |
| 2 Unit Apartments | 0 (0.0%) | 0 (0.0%) |
| 3 or 4 Unit Apartments | 0 (0.0%) | 0 (0.0%) |
| 5 to 9 Unit Apartments | 0 (0.0%) | 0 (0.0%) |
| 10 or more Apartments | 0 (0.0%) | 0 (0.0%) |
| Mobile Home / Other | 0 (0.0%) | 0 (0.0%) |
| Total | 52 (100.0%) | 0 (0.0%) |
Housing Structures by Number of Rooms in Carleton
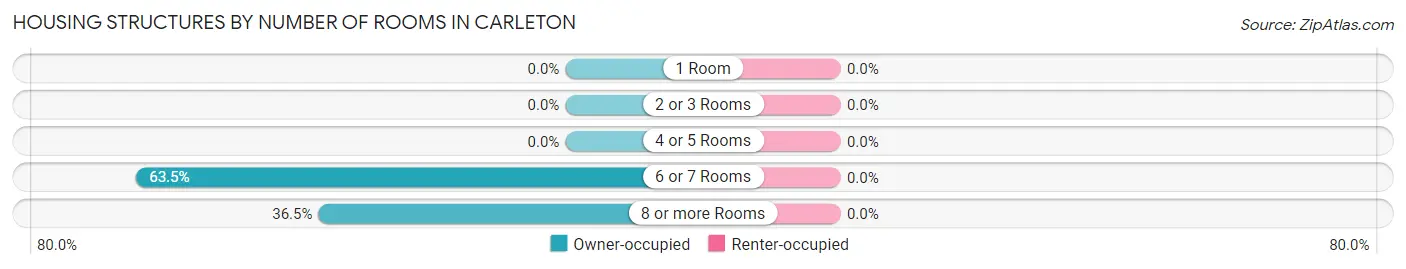
| Number of Rooms | Owner-occupied | Renter-occupied |
| 1 Room | 0 (0.0%) | 0 (0.0%) |
| 2 or 3 Rooms | 0 (0.0%) | 0 (0.0%) |
| 4 or 5 Rooms | 0 (0.0%) | 0 (0.0%) |
| 6 or 7 Rooms | 33 (63.5%) | 0 (0.0%) |
| 8 or more Rooms | 19 (36.5%) | 0 (0.0%) |
| Total | 52 (100.0%) | 0 (0.0%) |
Housing Structure by Heating Type in Carleton
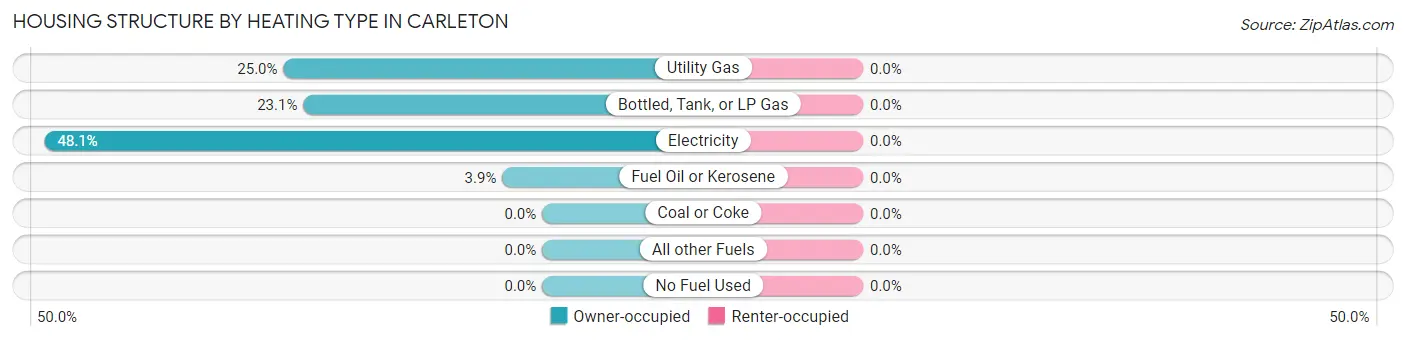
| Heating Type | Owner-occupied | Renter-occupied |
| Utility Gas | 13 (25.0%) | 0 (0.0%) |
| Bottled, Tank, or LP Gas | 12 (23.1%) | 0 (0.0%) |
| Electricity | 25 (48.1%) | 0 (0.0%) |
| Fuel Oil or Kerosene | 2 (3.8%) | 0 (0.0%) |
| Coal or Coke | 0 (0.0%) | 0 (0.0%) |
| All other Fuels | 0 (0.0%) | 0 (0.0%) |
| No Fuel Used | 0 (0.0%) | 0 (0.0%) |
| Total | 52 (100.0%) | 0 (0.0%) |
Household Vehicle Usage in Carleton
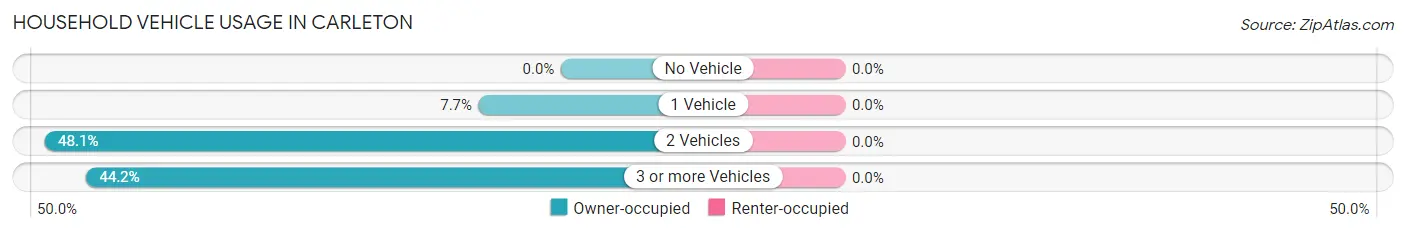
| Vehicles per Household | Owner-occupied | Renter-occupied |
| No Vehicle | 0 (0.0%) | 0 (0.0%) |
| 1 Vehicle | 4 (7.7%) | 0 (0.0%) |
| 2 Vehicles | 25 (48.1%) | 0 (0.0%) |
| 3 or more Vehicles | 23 (44.2%) | 0 (0.0%) |
| Total | 52 (100.0%) | 0 (0.0%) |
Real Estate & Mortgages in Carleton
Real Estate and Mortgage Overview in Carleton
| Characteristic | Without Mortgage | With Mortgage |
| Housing Units | 48 | 4 |
| Median Property Value | - | - |
| Median Household Income | $76,765 | $0 |
| Monthly Housing Costs | $508 | $0 |
| Real Estate Taxes | $963 | $0 |
Property Value by Mortgage Status in Carleton
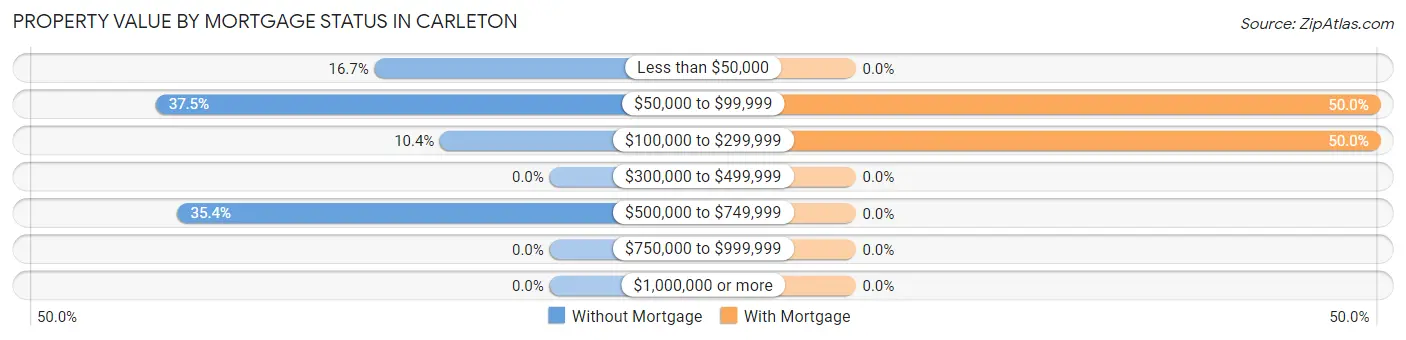
| Property Value | Without Mortgage | With Mortgage |
| Less than $50,000 | 8 (16.7%) | 0 (0.0%) |
| $50,000 to $99,999 | 18 (37.5%) | 2 (50.0%) |
| $100,000 to $299,999 | 5 (10.4%) | 2 (50.0%) |
| $300,000 to $499,999 | 0 (0.0%) | 0 (0.0%) |
| $500,000 to $749,999 | 17 (35.4%) | 0 (0.0%) |
| $750,000 to $999,999 | 0 (0.0%) | 0 (0.0%) |
| $1,000,000 or more | 0 (0.0%) | 0 (0.0%) |
| Total | 48 (100.0%) | 4 (100.0%) |
Household Income by Mortgage Status in Carleton
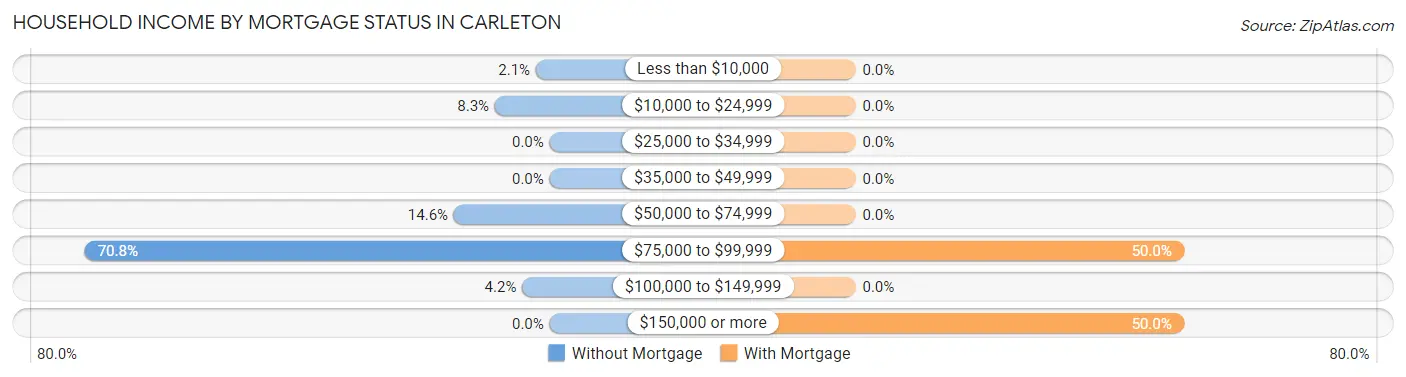
| Household Income | Without Mortgage | With Mortgage |
| Less than $10,000 | 1 (2.1%) | 0 (0.0%) |
| $10,000 to $24,999 | 4 (8.3%) | 0 (0.0%) |
| $25,000 to $34,999 | 0 (0.0%) | 0 (0.0%) |
| $35,000 to $49,999 | 0 (0.0%) | 0 (0.0%) |
| $50,000 to $74,999 | 7 (14.6%) | 0 (0.0%) |
| $75,000 to $99,999 | 34 (70.8%) | 2 (50.0%) |
| $100,000 to $149,999 | 2 (4.2%) | 0 (0.0%) |
| $150,000 or more | 0 (0.0%) | 2 (50.0%) |
| Total | 48 (100.0%) | 4 (100.0%) |
Property Value to Household Income Ratio in Carleton
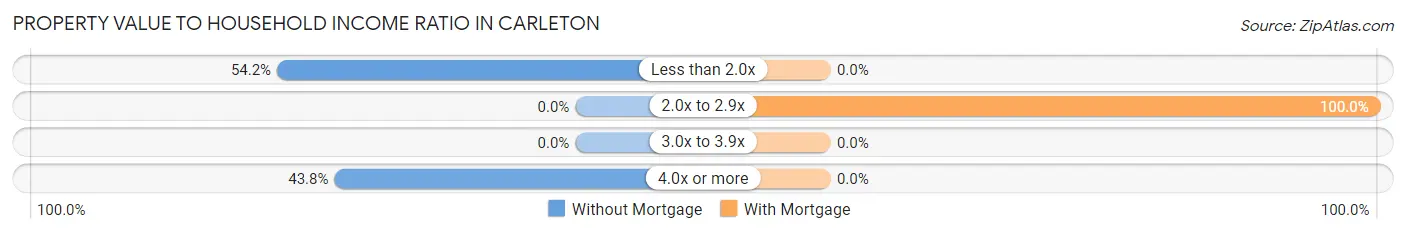
| Value-to-Income Ratio | Without Mortgage | With Mortgage |
| Less than 2.0x | 26 (54.2%) | 0 (0.0%) |
| 2.0x to 2.9x | 0 (0.0%) | 4 (100.0%) |
| 3.0x to 3.9x | 0 (0.0%) | 0 (0.0%) |
| 4.0x or more | 21 (43.8%) | 0 (0.0%) |
| Total | 48 (100.0%) | 4 (100.0%) |
Real Estate Taxes by Mortgage Status in Carleton
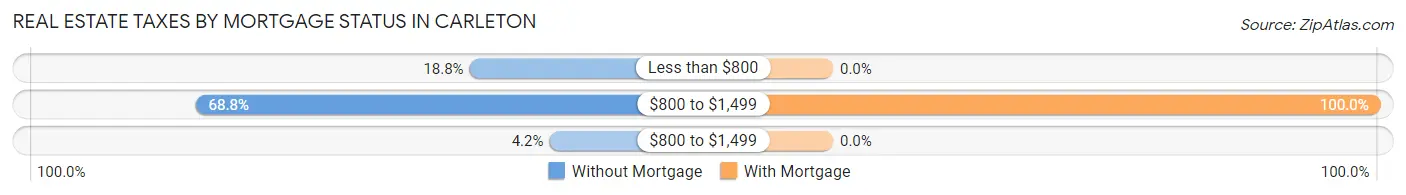
| Property Taxes | Without Mortgage | With Mortgage |
| Less than $800 | 9 (18.8%) | 0 (0.0%) |
| $800 to $1,499 | 33 (68.8%) | 4 (100.0%) |
| $800 to $1,499 | 2 (4.2%) | 0 (0.0%) |
| Total | 48 (100.0%) | 4 (100.0%) |
Health & Disability in Carleton
Health Insurance Coverage by Age in Carleton
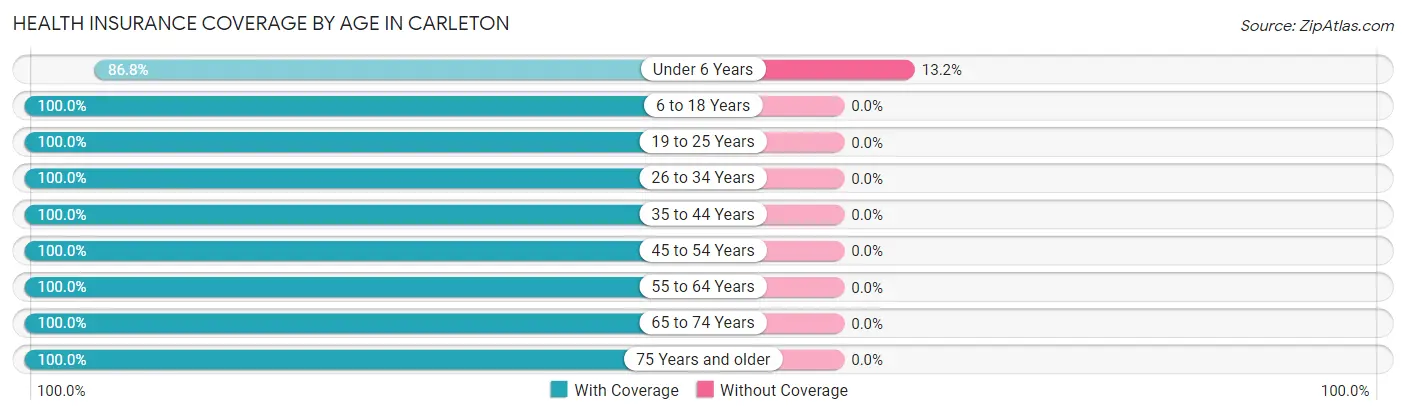
| Age Bracket | With Coverage | Without Coverage |
| Under 6 Years | 33 (86.8%) | 5 (13.2%) |
| 6 to 18 Years | 16 (100.0%) | 0 (0.0%) |
| 19 to 25 Years | 39 (100.0%) | 0 (0.0%) |
| 26 to 34 Years | 11 (100.0%) | 0 (0.0%) |
| 35 to 44 Years | 22 (100.0%) | 0 (0.0%) |
| 45 to 54 Years | 32 (100.0%) | 0 (0.0%) |
| 55 to 64 Years | 11 (100.0%) | 0 (0.0%) |
| 65 to 74 Years | 3 (100.0%) | 0 (0.0%) |
| 75 Years and older | 6 (100.0%) | 0 (0.0%) |
| Total | 173 (97.2%) | 5 (2.8%) |
Health Insurance Coverage by Citizenship Status in Carleton
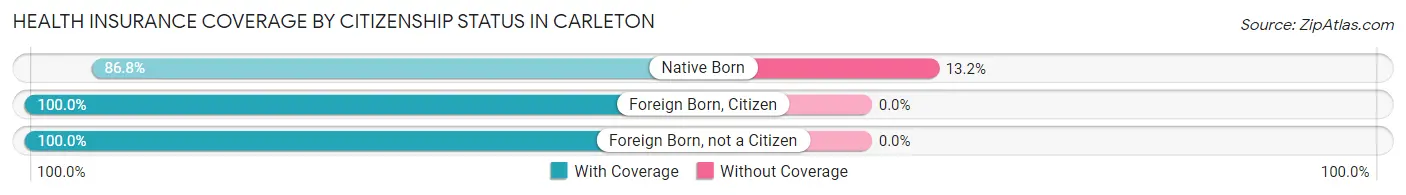
| Citizenship Status | With Coverage | Without Coverage |
| Native Born | 33 (86.8%) | 5 (13.2%) |
| Foreign Born, Citizen | 16 (100.0%) | 0 (0.0%) |
| Foreign Born, not a Citizen | 39 (100.0%) | 0 (0.0%) |
Health Insurance Coverage by Household Income in Carleton
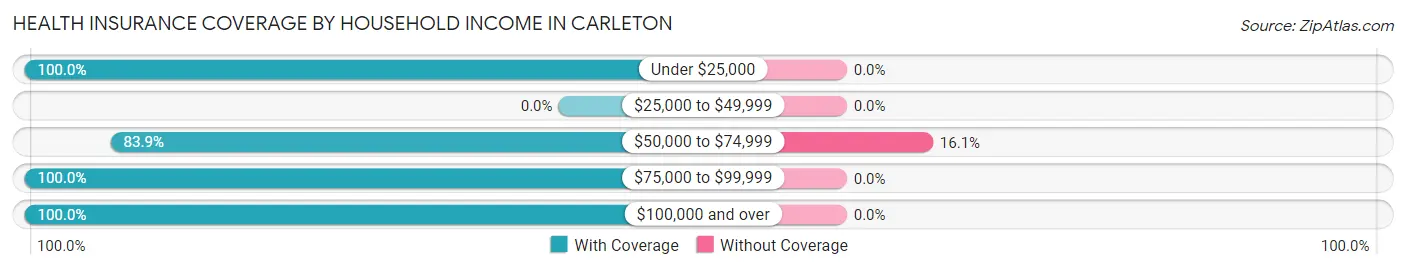
| Household Income | With Coverage | Without Coverage |
| Under $25,000 | 6 (100.0%) | 0 (0.0%) |
| $25,000 to $49,999 | 0 (0.0%) | 0 (0.0%) |
| $50,000 to $74,999 | 26 (83.9%) | 5 (16.1%) |
| $75,000 to $99,999 | 132 (100.0%) | 0 (0.0%) |
| $100,000 and over | 9 (100.0%) | 0 (0.0%) |
Public vs Private Health Insurance Coverage by Age in Carleton
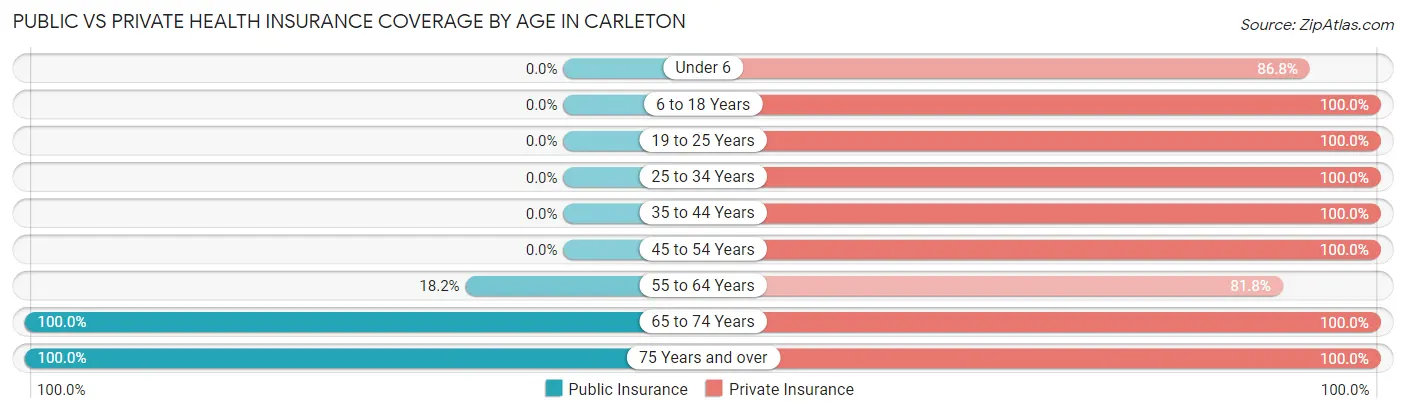
| Age Bracket | Public Insurance | Private Insurance |
| Under 6 | 0 (0.0%) | 33 (86.8%) |
| 6 to 18 Years | 0 (0.0%) | 16 (100.0%) |
| 19 to 25 Years | 0 (0.0%) | 39 (100.0%) |
| 25 to 34 Years | 0 (0.0%) | 11 (100.0%) |
| 35 to 44 Years | 0 (0.0%) | 22 (100.0%) |
| 45 to 54 Years | 0 (0.0%) | 32 (100.0%) |
| 55 to 64 Years | 2 (18.2%) | 9 (81.8%) |
| 65 to 74 Years | 3 (100.0%) | 3 (100.0%) |
| 75 Years and over | 6 (100.0%) | 6 (100.0%) |
| Total | 11 (6.2%) | 171 (96.1%) |
Disability Status by Sex by Age in Carleton
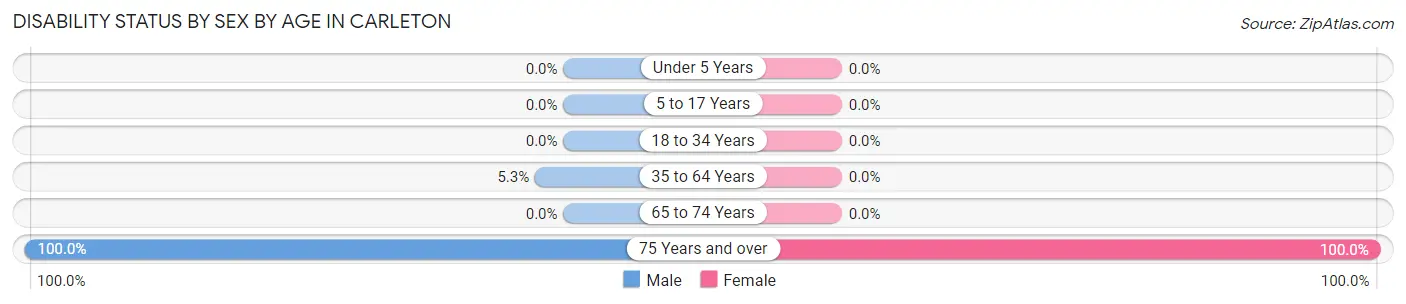
| Age Bracket | Male | Female |
| Under 5 Years | 0 (0.0%) | 0 (0.0%) |
| 5 to 17 Years | 0 (0.0%) | 0 (0.0%) |
| 18 to 34 Years | 0 (0.0%) | 0 (0.0%) |
| 35 to 64 Years | 2 (5.3%) | 0 (0.0%) |
| 65 to 74 Years | 0 (0.0%) | 0 (0.0%) |
| 75 Years and over | 5 (100.0%) | 1 (100.0%) |
Disability Class by Sex by Age in Carleton
Disability Class: Hearing Difficulty
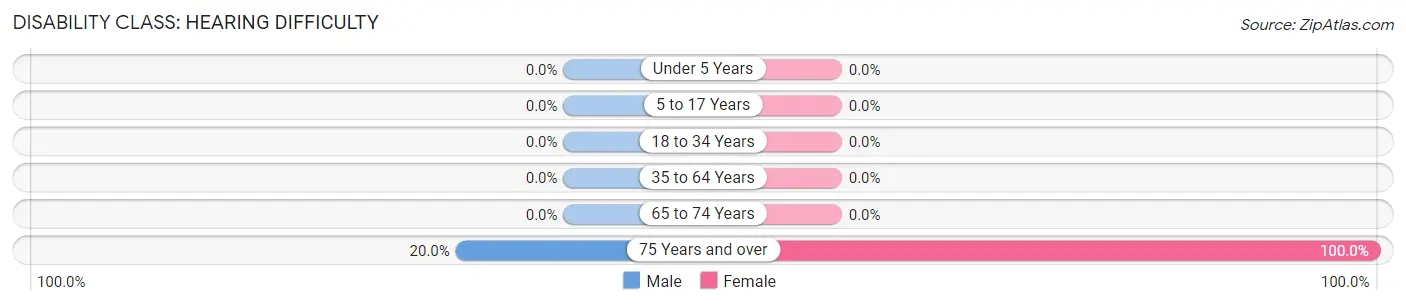
| Age Bracket | Male | Female |
| Under 5 Years | 0 (0.0%) | 0 (0.0%) |
| 5 to 17 Years | 0 (0.0%) | 0 (0.0%) |
| 18 to 34 Years | 0 (0.0%) | 0 (0.0%) |
| 35 to 64 Years | 0 (0.0%) | 0 (0.0%) |
| 65 to 74 Years | 0 (0.0%) | 0 (0.0%) |
| 75 Years and over | 1 (20.0%) | 1 (100.0%) |
Disability Class: Vision Difficulty
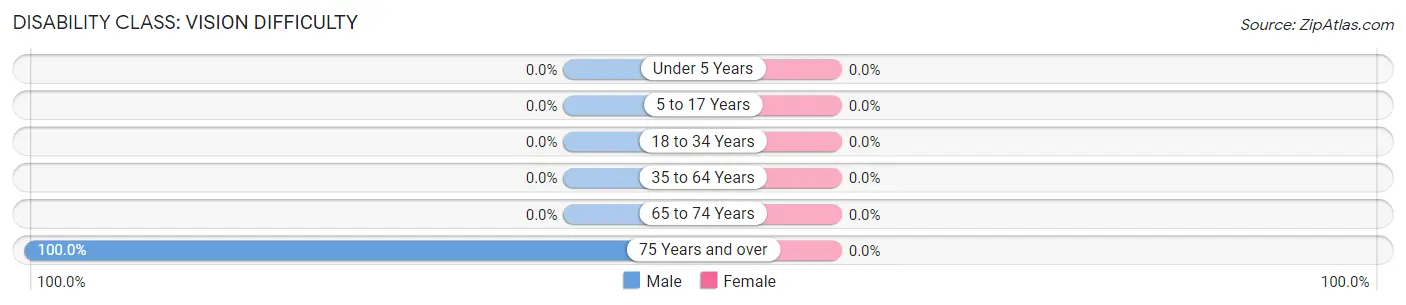
| Age Bracket | Male | Female |
| Under 5 Years | 0 (0.0%) | 0 (0.0%) |
| 5 to 17 Years | 0 (0.0%) | 0 (0.0%) |
| 18 to 34 Years | 0 (0.0%) | 0 (0.0%) |
| 35 to 64 Years | 0 (0.0%) | 0 (0.0%) |
| 65 to 74 Years | 0 (0.0%) | 0 (0.0%) |
| 75 Years and over | 5 (100.0%) | 0 (0.0%) |
Disability Class: Cognitive Difficulty

| Age Bracket | Male | Female |
| 5 to 17 Years | 0 (0.0%) | 0 (0.0%) |
| 18 to 34 Years | 0 (0.0%) | 0 (0.0%) |
| 35 to 64 Years | 0 (0.0%) | 0 (0.0%) |
| 65 to 74 Years | 0 (0.0%) | 0 (0.0%) |
| 75 Years and over | 0 (0.0%) | 0 (0.0%) |
Disability Class: Ambulatory Difficulty
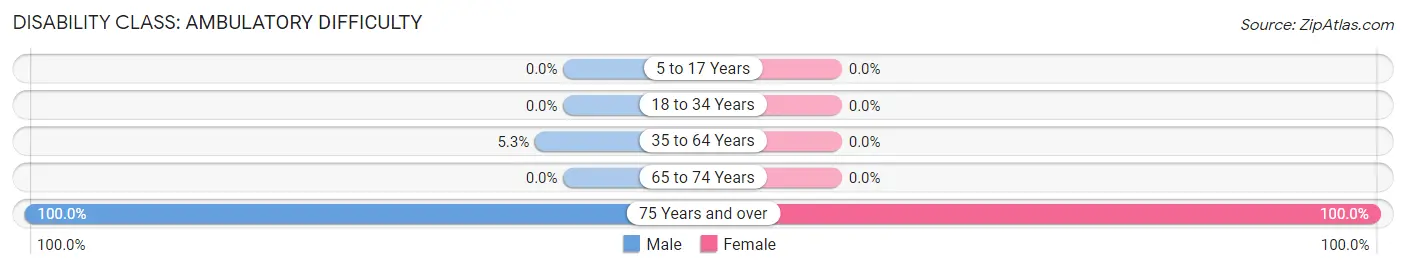
| Age Bracket | Male | Female |
| 5 to 17 Years | 0 (0.0%) | 0 (0.0%) |
| 18 to 34 Years | 0 (0.0%) | 0 (0.0%) |
| 35 to 64 Years | 2 (5.3%) | 0 (0.0%) |
| 65 to 74 Years | 0 (0.0%) | 0 (0.0%) |
| 75 Years and over | 5 (100.0%) | 1 (100.0%) |
Disability Class: Self-Care Difficulty
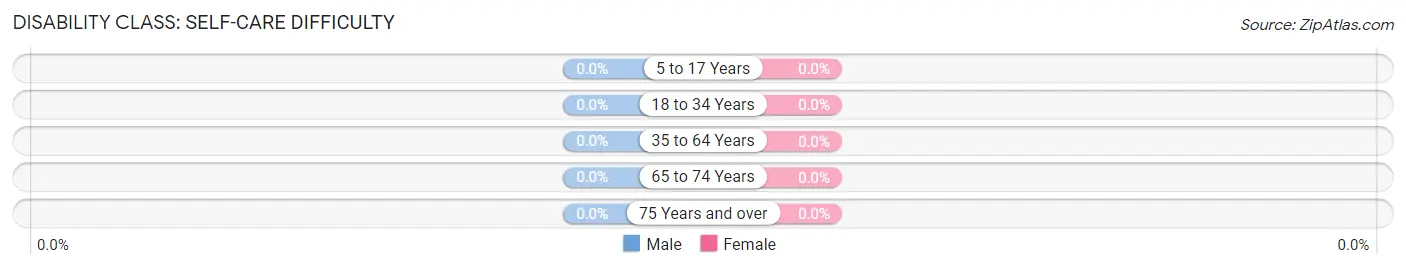
| Age Bracket | Male | Female |
| 5 to 17 Years | 0 (0.0%) | 0 (0.0%) |
| 18 to 34 Years | 0 (0.0%) | 0 (0.0%) |
| 35 to 64 Years | 0 (0.0%) | 0 (0.0%) |
| 65 to 74 Years | 0 (0.0%) | 0 (0.0%) |
| 75 Years and over | 0 (0.0%) | 0 (0.0%) |
Technology Access in Carleton
Computing Device Access in Carleton
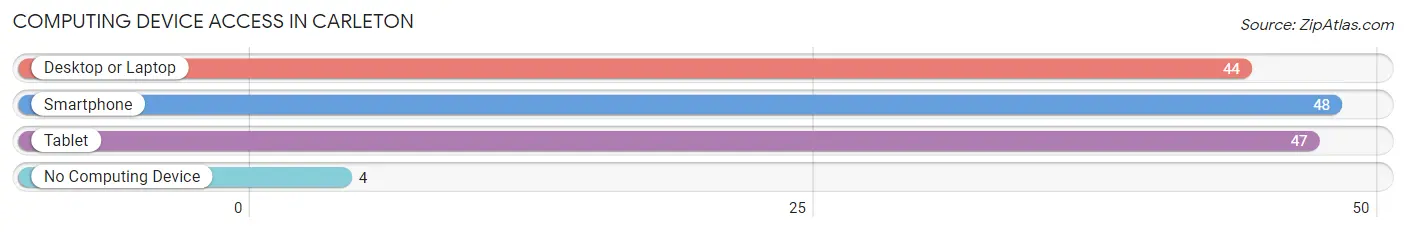
| Device Type | # Households | % Households |
| Desktop or Laptop | 44 | 84.6% |
| Smartphone | 48 | 92.3% |
| Tablet | 47 | 90.4% |
| No Computing Device | 4 | 7.7% |
| Total | 52 | 100.0% |
Internet Access in Carleton
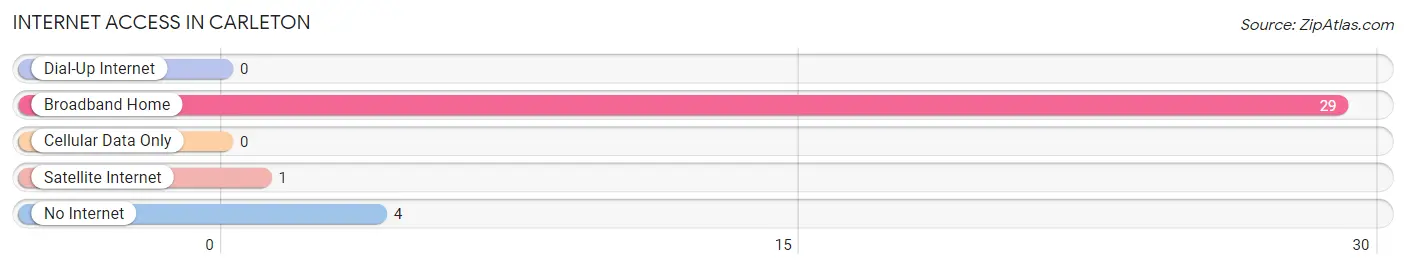
| Internet Type | # Households | % Households |
| Dial-Up Internet | 0 | 0.0% |
| Broadband Home | 29 | 55.8% |
| Cellular Data Only | 0 | 0.0% |
| Satellite Internet | 1 | 1.9% |
| No Internet | 4 | 7.7% |
| Total | 52 | 100.0% |
Carleton Summary
Carleton is a small village located in the state of Nebraska, in the United States. It is located in the southeastern corner of the state, in Thayer County. The village is situated on the banks of the Big Blue River, and is surrounded by rolling hills and farmland. The population of Carleton was estimated to be around 500 people in 2020.
History
Carleton was founded in 1871 by a group of settlers from Ohio. The village was named after the Carleton family, who were among the first settlers. The Carletons were farmers and ranchers, and the village was established as a trading post for the surrounding area.
The village grew slowly over the years, and by the early 1900s, it had become a thriving community. The village was home to a variety of businesses, including a general store, a blacksmith shop, a hotel, and a post office.
In the 1920s, the village was connected to the rest of the state by a railroad line. This allowed for the transportation of goods and people to and from Carleton. The railroad also allowed for the development of a local dairy industry, which provided milk and other dairy products to the surrounding area.
Geography
Carleton is located in the southeastern corner of Nebraska, in Thayer County. The village is situated on the banks of the Big Blue River, and is surrounded by rolling hills and farmland. The village is located approximately 30 miles from the state capital of Lincoln.
The climate in Carleton is generally mild, with hot summers and cold winters. The average temperature in the summer is around 80 degrees Fahrenheit, and the average temperature in the winter is around 20 degrees Fahrenheit.
Economy
The economy of Carleton is largely based on agriculture. The village is home to several farms, which produce a variety of crops, including corn, soybeans, and wheat. The village also has a small dairy industry, which produces milk and other dairy products for the surrounding area.
In addition to agriculture, Carleton is home to a variety of small businesses, including a general store, a hardware store, and a post office. The village also has a few restaurants and bars, which provide a variety of services to the local community.
Demographics
The population of Carleton was estimated to be around 500 people in 2020. The majority of the population is white, with a small percentage of African Americans, Hispanics, and Native Americans. The median age of the population is around 40 years old.
The median household income in Carleton is around $45,000 per year. The unemployment rate in the village is around 4%, which is slightly lower than the national average. The poverty rate in the village is around 10%, which is slightly higher than the national average.
Conclusion
Carleton is a small village located in the southeastern corner of Nebraska. The village was founded in 1871 by a group of settlers from Ohio, and has since grown into a thriving community. The economy of Carleton is largely based on agriculture, and the village is home to a variety of small businesses. The population of Carleton was estimated to be around 500 people in 2020, and the median household income is around $45,000 per year.
Common Questions
What is Per Capita Income in Carleton?
Per Capita income in Carleton is $22,054.
What is the Median Family Income in Carleton?
Median Family Income in Carleton is $73,333.
What is the Median Household income in Carleton?
Median Household Income in Carleton is $76,765.
What is Inequality or Gini Index in Carleton?
Inequality or Gini Index in Carleton is 0.14.
What is the Total Population of Carleton?
Total Population of Carleton is 178.
What is the Total Male Population of Carleton?
Total Male Population of Carleton is 123.
What is the Total Female Population of Carleton?
Total Female Population of Carleton is 55.
What is the Ratio of Males per 100 Females in Carleton?
There are 223.64 Males per 100 Females in Carleton.
What is the Ratio of Females per 100 Males in Carleton?
There are 44.72 Females per 100 Males in Carleton.
What is the Median Population Age in Carleton?
Median Population Age in Carleton is 25.4 Years.
What is the Average Family Size in Carleton
Average Family Size in Carleton is 3.6 People.
What is the Average Household Size in Carleton
Average Household Size in Carleton is 3.4 People.
How Large is the Labor Force in Carleton?
There are 114 People in the Labor Forcein in Carleton.
What is the Percentage of People in the Labor Force in Carleton?
90.5% of People are in the Labor Force in Carleton.