Weston, NE Map & Demographics
Weston Map
Weston Overview
$28,393
PER CAPITA INCOME
$65,000
AVG FAMILY INCOME
$60,208
AVG HOUSEHOLD INCOME
13.4%
WAGE / INCOME GAP [ % ]
86.6¢/ $1
WAGE / INCOME GAP [ $ ]
0.34
INEQUALITY / GINI INDEX
254
TOTAL POPULATION
136
MALE POPULATION
118
FEMALE POPULATION
115.25
MALES / 100 FEMALES
86.76
FEMALES / 100 MALES
50.5
MEDIAN AGE
2.5
AVG FAMILY SIZE
2.2
AVG HOUSEHOLD SIZE
127
LABOR FORCE [ PEOPLE ]
61.4%
PERCENT IN LABOR FORCE
3.1%
UNEMPLOYMENT RATE
Weston Zip Codes
Weston Area Codes
Income in Weston
Income Overview in Weston
Per Capita Income in Weston is $28,393, while median incomes of families and households are $65,000 and $60,208 respectively.
| Characteristic | Number | Measure |
| Per Capita Income | 254 | $28,393 |
| Median Family Income | 82 | $65,000 |
| Mean Family Income | 82 | $74,798 |
| Median Household Income | 115 | $60,208 |
| Mean Household Income | 115 | $63,983 |
| Income Deficit | 82 | $0 |
| Wage / Income Gap (%) | 254 | 13.37% |
| Wage / Income Gap ($) | 254 | 86.63¢ per $1 |
| Gini / Inequality Index | 254 | 0.34 |
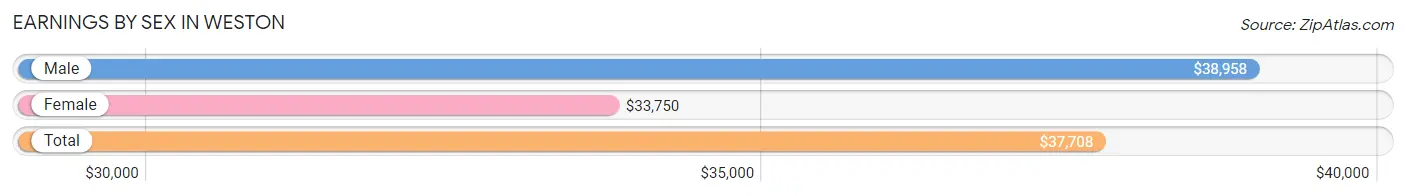
Earnings by Sex in Weston
Average Earnings in Weston are $37,708, $38,958 for men and $33,750 for women, a difference of 13.4%.
| Sex | Number | Average Earnings |
| Male | 73 (54.9%) | $38,958 |
| Female | 60 (45.1%) | $33,750 |
| Total | 133 (100.0%) | $37,708 |
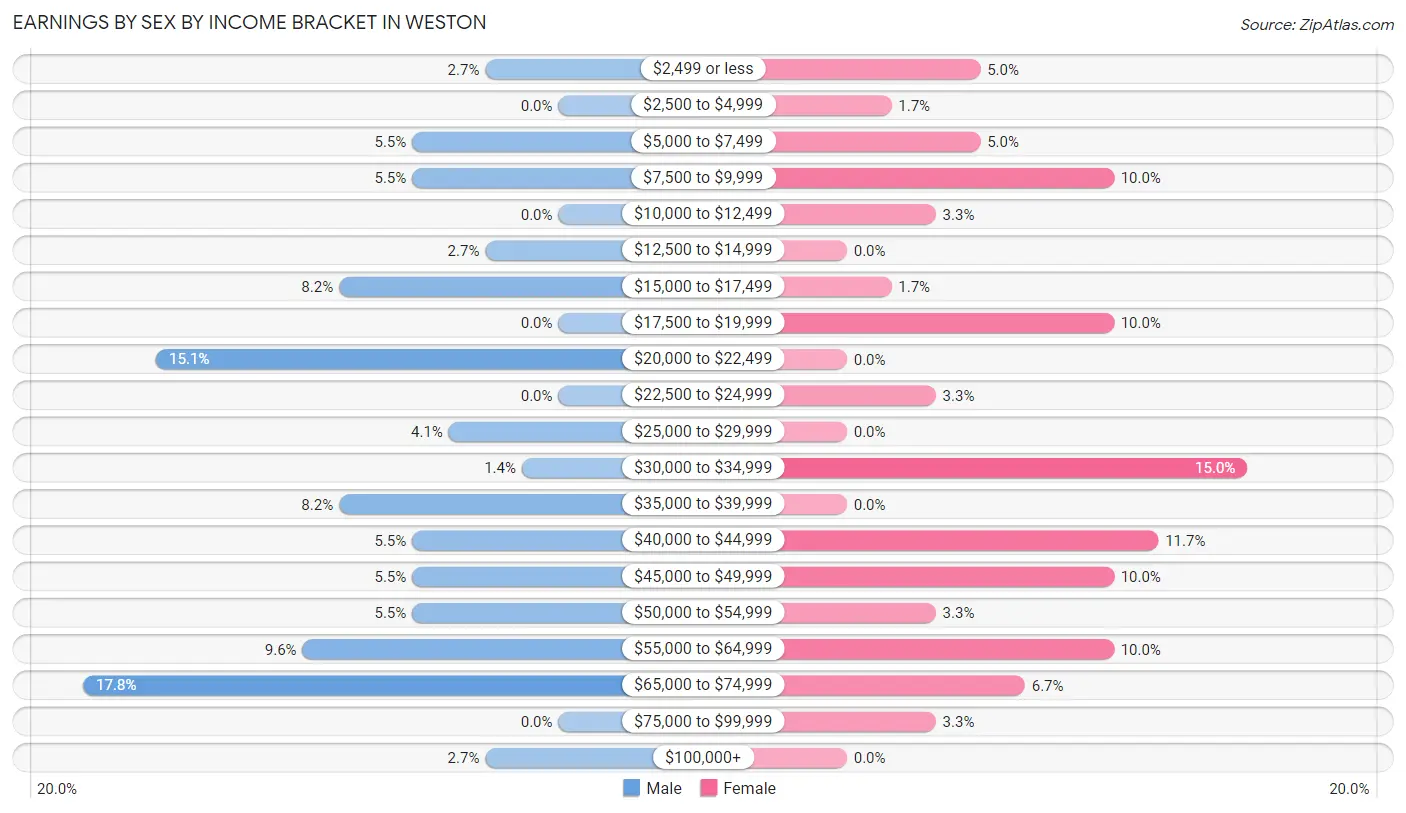
Earnings by Sex by Income Bracket in Weston
The most common earnings brackets in Weston are $65,000 to $74,999 for men (13 | 17.8%) and $30,000 to $34,999 for women (9 | 15.0%).
| Income | Male | Female |
| $2,499 or less | 2 (2.7%) | 3 (5.0%) |
| $2,500 to $4,999 | 0 (0.0%) | 1 (1.7%) |
| $5,000 to $7,499 | 4 (5.5%) | 3 (5.0%) |
| $7,500 to $9,999 | 4 (5.5%) | 6 (10.0%) |
| $10,000 to $12,499 | 0 (0.0%) | 2 (3.3%) |
| $12,500 to $14,999 | 2 (2.7%) | 0 (0.0%) |
| $15,000 to $17,499 | 6 (8.2%) | 1 (1.7%) |
| $17,500 to $19,999 | 0 (0.0%) | 6 (10.0%) |
| $20,000 to $22,499 | 11 (15.1%) | 0 (0.0%) |
| $22,500 to $24,999 | 0 (0.0%) | 2 (3.3%) |
| $25,000 to $29,999 | 3 (4.1%) | 0 (0.0%) |
| $30,000 to $34,999 | 1 (1.4%) | 9 (15.0%) |
| $35,000 to $39,999 | 6 (8.2%) | 0 (0.0%) |
| $40,000 to $44,999 | 4 (5.5%) | 7 (11.7%) |
| $45,000 to $49,999 | 4 (5.5%) | 6 (10.0%) |
| $50,000 to $54,999 | 4 (5.5%) | 2 (3.3%) |
| $55,000 to $64,999 | 7 (9.6%) | 6 (10.0%) |
| $65,000 to $74,999 | 13 (17.8%) | 4 (6.7%) |
| $75,000 to $99,999 | 0 (0.0%) | 2 (3.3%) |
| $100,000+ | 2 (2.7%) | 0 (0.0%) |
| Total | 73 (100.0%) | 60 (100.0%) |
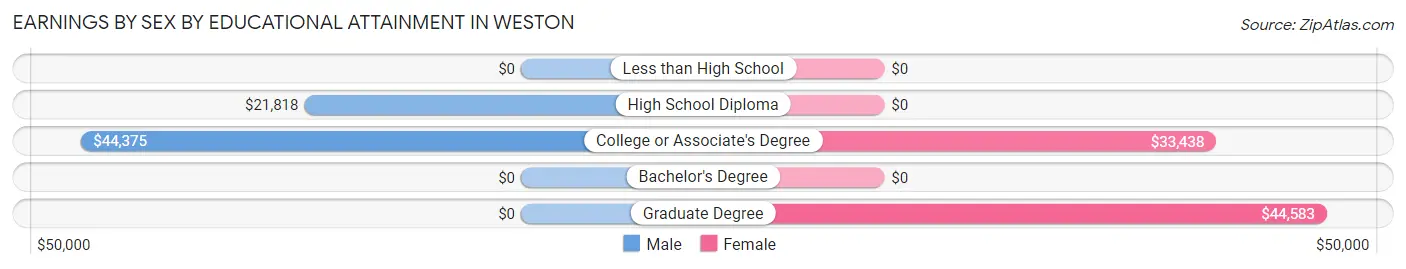
Earnings by Sex by Educational Attainment in Weston
Average earnings in Weston are $38,542 for men and $34,375 for women, a difference of 10.8%. Men with an educational attainment of college or associate's degree enjoy the highest average annual earnings of $44,375, while those with high school diploma education earn the least with $21,818. Women with an educational attainment of graduate degree earn the most with the average annual earnings of $44,583, while those with college or associate's degree education have the smallest earnings of $33,438.
| Educational Attainment | Male Income | Female Income |
| Less than High School | - | - |
| High School Diploma | $21,818 | $0 |
| College or Associate's Degree | $44,375 | $33,438 |
| Bachelor's Degree | - | - |
| Graduate Degree | - | - |
| Total | $38,542 | $34,375 |
Family Income in Weston
Family Income Brackets in Weston
According to the Weston family income data, there are 39 families falling into the $50,000 to $74,999 income range, which is the most common income bracket and makes up 47.6% of all families.
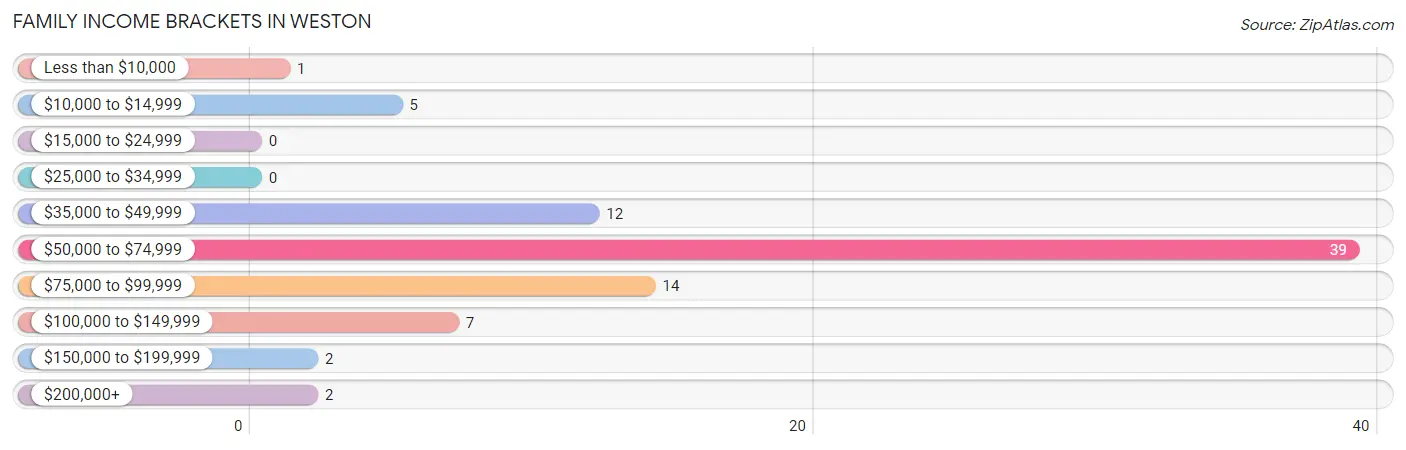
| Income Bracket | # Families | % Families |
| Less than $10,000 | 1 | 1.2% |
| $10,000 to $14,999 | 5 | 6.1% |
| $15,000 to $24,999 | 0 | 0.0% |
| $25,000 to $34,999 | 0 | 0.0% |
| $35,000 to $49,999 | 12 | 14.6% |
| $50,000 to $74,999 | 39 | 47.6% |
| $75,000 to $99,999 | 14 | 17.1% |
| $100,000 to $149,999 | 7 | 8.5% |
| $150,000 to $199,999 | 2 | 2.4% |
| $200,000+ | 2 | 2.4% |
Family Income by Famaliy Size in Weston
3-person families (14 | 17.1%) account for the highest median family income in Weston with $83,750 per family, while 2-person families (59 | 72.0%) have the highest median income of $30,938 per family member.
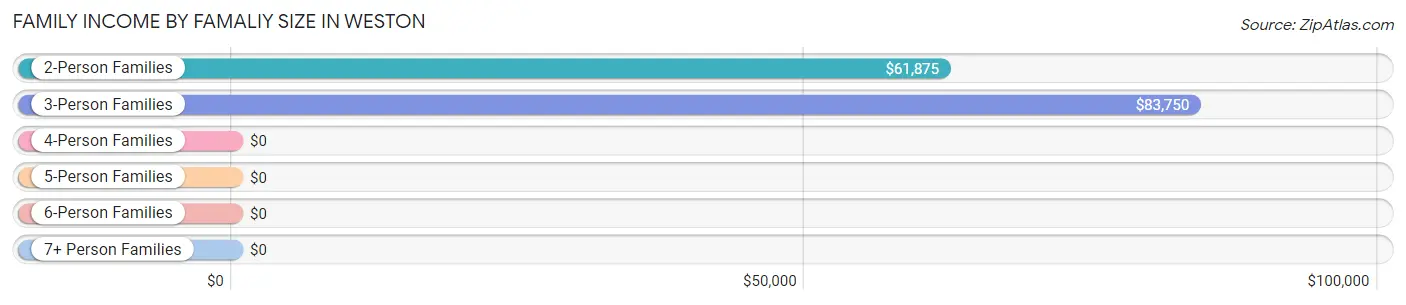
| Income Bracket | # Families | Median Income |
| 2-Person Families | 59 (72.0%) | $61,875 |
| 3-Person Families | 14 (17.1%) | $83,750 |
| 4-Person Families | 2 (2.4%) | $0 |
| 5-Person Families | 4 (4.9%) | $0 |
| 6-Person Families | 3 (3.7%) | $0 |
| 7+ Person Families | 0 (0.0%) | $0 |
| Total | 82 (100.0%) | $65,000 |
Family Income by Number of Earners in Weston
The median family income in Weston is $65,000, with families comprising 3+ earners (5) having the highest median family income of $131,875, while families with 1 earner (35) have the lowest median family income of $50,625, accounting for 6.1% and 42.7% of families, respectively.
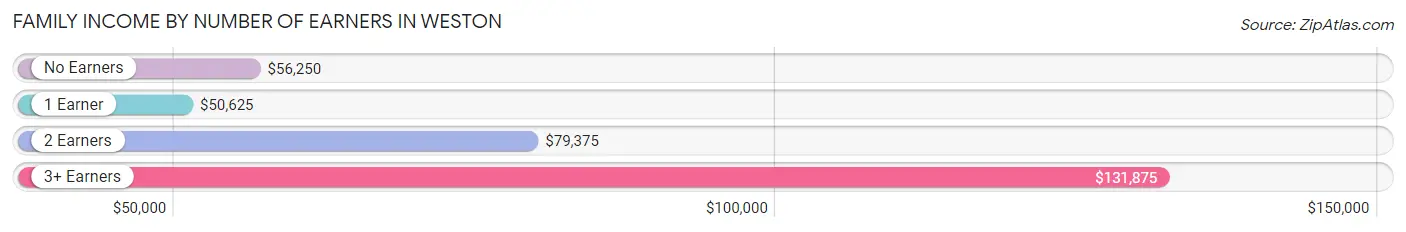
| Number of Earners | # Families | Median Income |
| No Earners | 11 (13.4%) | $56,250 |
| 1 Earner | 35 (42.7%) | $50,625 |
| 2 Earners | 31 (37.8%) | $79,375 |
| 3+ Earners | 5 (6.1%) | $131,875 |
| Total | 82 (100.0%) | $65,000 |
Household Income in Weston
Household Income Brackets in Weston
With 50 households falling in the category, the $50,000 to $74,999 income range is the most frequent in Weston, accounting for 43.5% of all households. In contrast, only 2 households (1.7%) fall into the less than $10,000 income bracket, making it the least populous group.
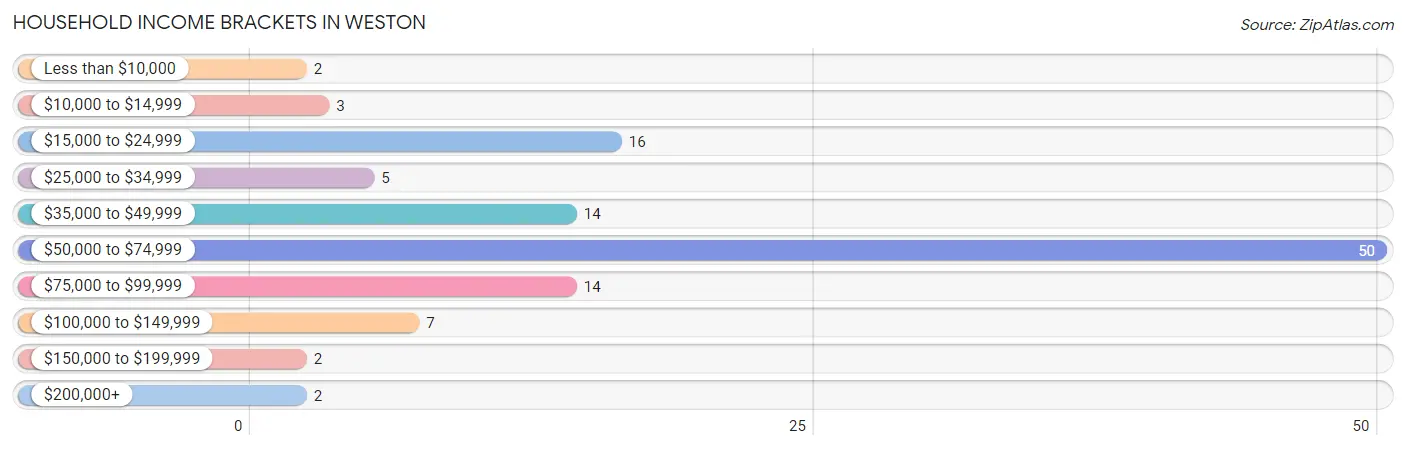
| Income Bracket | # Households | % Households |
| Less than $10,000 | 2 | 1.7% |
| $10,000 to $14,999 | 3 | 2.6% |
| $15,000 to $24,999 | 16 | 13.9% |
| $25,000 to $34,999 | 5 | 4.3% |
| $35,000 to $49,999 | 14 | 12.2% |
| $50,000 to $74,999 | 50 | 43.5% |
| $75,000 to $99,999 | 14 | 12.2% |
| $100,000 to $149,999 | 7 | 6.1% |
| $150,000 to $199,999 | 2 | 1.7% |
| $200,000+ | 2 | 1.7% |
Household Income by Householder Age in Weston
The median household income in Weston is $60,208, with the highest median household income of $73,438 found in the 15 to 24 years age bracket for the primary householder. A total of 10 households (8.7%) fall into this category. Meanwhile, the 65+ years age bracket for the primary householder has the lowest median household income of $52,917, with 41 households (35.6%) in this group.
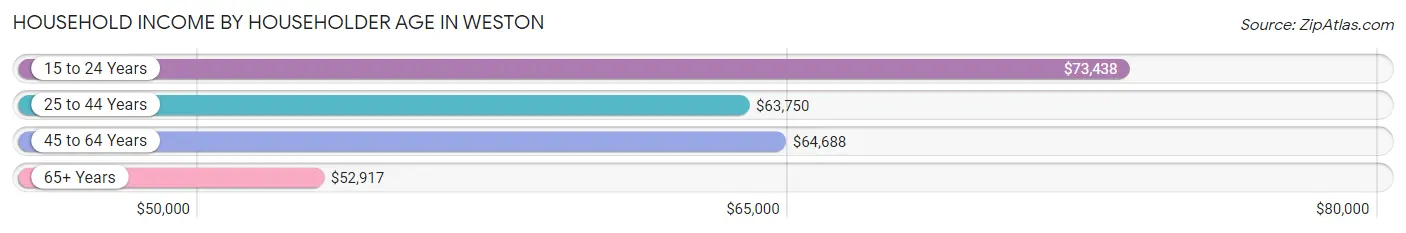
| Income Bracket | # Households | Median Income |
| 15 to 24 Years | 10 (8.7%) | $73,438 |
| 25 to 44 Years | 29 (25.2%) | $63,750 |
| 45 to 64 Years | 35 (30.4%) | $64,688 |
| 65+ Years | 41 (35.6%) | $52,917 |
| Total | 115 (100.0%) | $60,208 |
Poverty in Weston
Income Below Poverty by Sex and Age in Weston
With 14.7% poverty level for males and 11.1% for females among the residents of Weston, 6 to 11 year old males and under 5 year old females are the most vulnerable to poverty, with 5 males (50.0%) and 2 females (100.0%) in their respective age groups living below the poverty level.
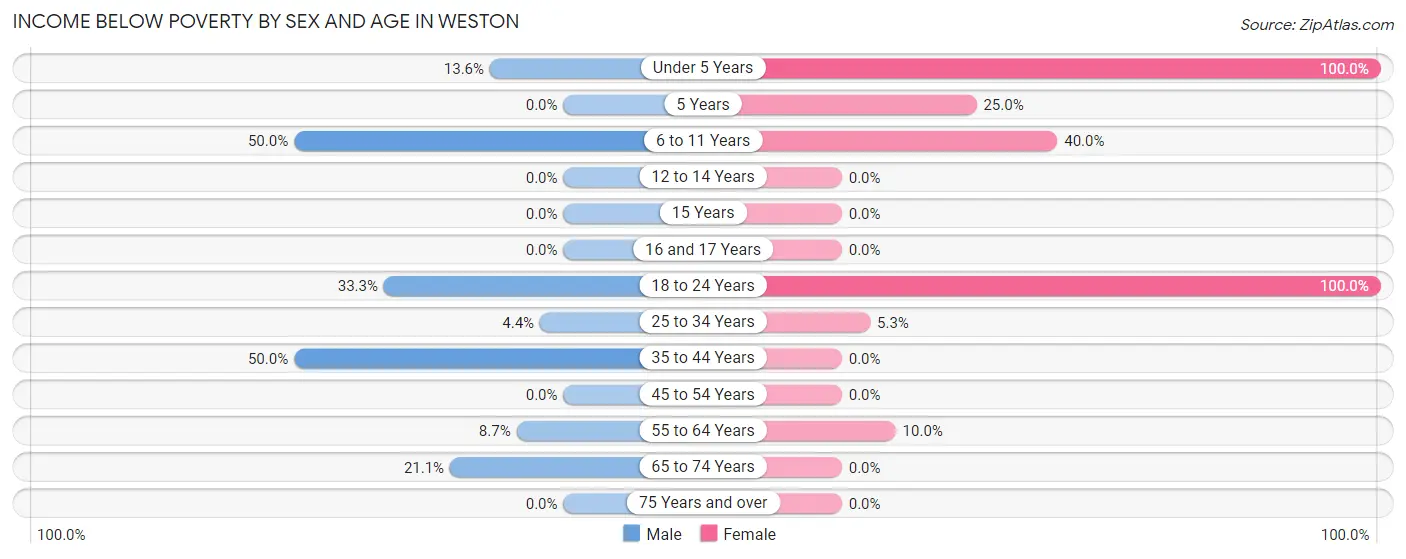
| Age Bracket | Male | Female |
| Under 5 Years | 3 (13.6%) | 2 (100.0%) |
| 5 Years | 0 (0.0%) | 1 (25.0%) |
| 6 to 11 Years | 5 (50.0%) | 2 (40.0%) |
| 12 to 14 Years | 0 (0.0%) | 0 (0.0%) |
| 15 Years | 0 (0.0%) | 0 (0.0%) |
| 16 and 17 Years | 0 (0.0%) | 0 (0.0%) |
| 18 to 24 Years | 2 (33.3%) | 4 (100.0%) |
| 25 to 34 Years | 1 (4.3%) | 1 (5.3%) |
| 35 to 44 Years | 3 (50.0%) | 0 (0.0%) |
| 45 to 54 Years | 0 (0.0%) | 0 (0.0%) |
| 55 to 64 Years | 2 (8.7%) | 3 (10.0%) |
| 65 to 74 Years | 4 (21.0%) | 0 (0.0%) |
| 75 Years and over | 0 (0.0%) | 0 (0.0%) |
| Total | 20 (14.7%) | 13 (11.1%) |
Income Above Poverty by Sex and Age in Weston
According to the poverty statistics in Weston, males aged 16 and 17 years and females aged 12 to 14 years are the age groups that are most secure financially, with 100.0% of males and 100.0% of females in these age groups living above the poverty line.
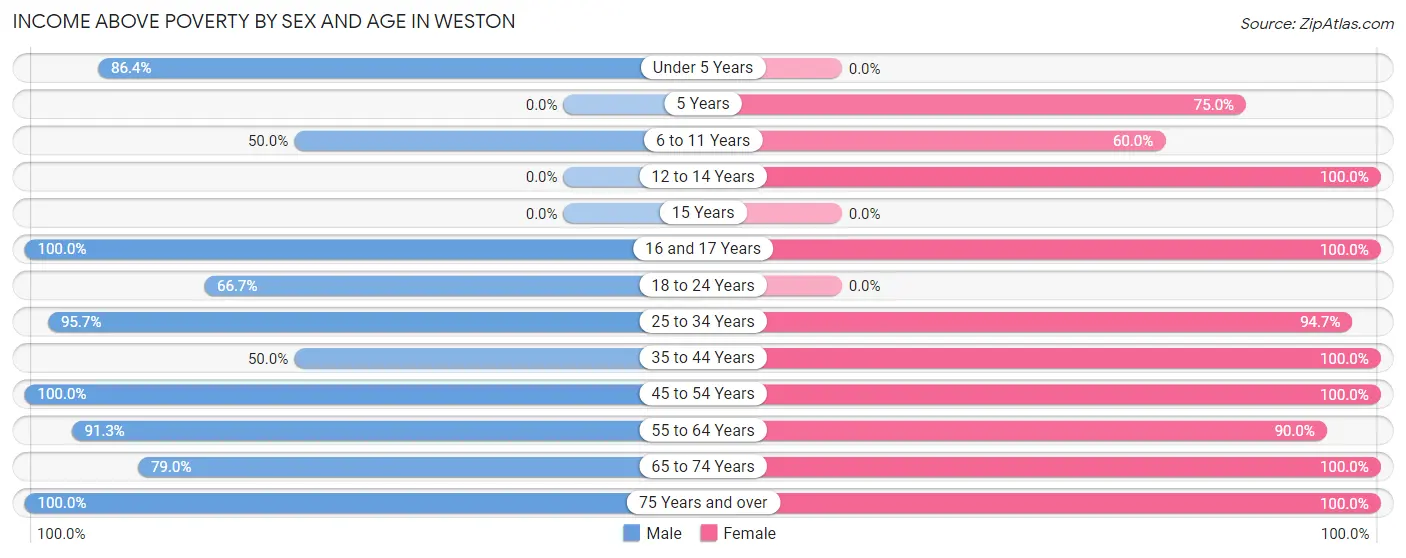
| Age Bracket | Male | Female |
| Under 5 Years | 19 (86.4%) | 0 (0.0%) |
| 5 Years | 0 (0.0%) | 3 (75.0%) |
| 6 to 11 Years | 5 (50.0%) | 3 (60.0%) |
| 12 to 14 Years | 0 (0.0%) | 3 (100.0%) |
| 15 Years | 0 (0.0%) | 0 (0.0%) |
| 16 and 17 Years | 10 (100.0%) | 1 (100.0%) |
| 18 to 24 Years | 4 (66.7%) | 0 (0.0%) |
| 25 to 34 Years | 22 (95.7%) | 18 (94.7%) |
| 35 to 44 Years | 3 (50.0%) | 4 (100.0%) |
| 45 to 54 Years | 9 (100.0%) | 7 (100.0%) |
| 55 to 64 Years | 21 (91.3%) | 27 (90.0%) |
| 65 to 74 Years | 15 (78.9%) | 20 (100.0%) |
| 75 Years and over | 8 (100.0%) | 18 (100.0%) |
| Total | 116 (85.3%) | 104 (88.9%) |
Income Below Poverty Among Married-Couple Families in Weston
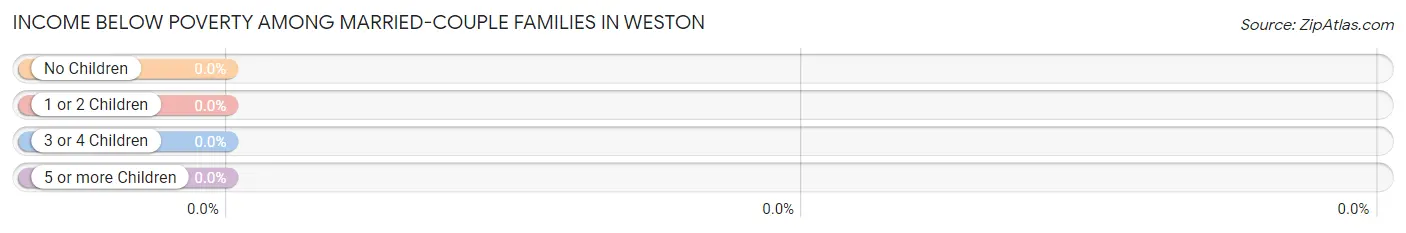
| Children | Above Poverty | Below Poverty |
| No Children | 43 (100.0%) | 0 (0.0%) |
| 1 or 2 Children | 15 (100.0%) | 0 (0.0%) |
| 3 or 4 Children | 0 (0.0%) | 0 (0.0%) |
| 5 or more Children | 0 (0.0%) | 0 (0.0%) |
| Total | 58 (100.0%) | 0 (0.0%) |
Income Below Poverty Among Single-Parent Households in Weston
According to the poverty data in Weston, 18.8% or 3 single-father households and 37.5% or 3 single-mother households are living below the poverty line. Among single-father households, those with 1 or 2 children have the highest poverty rate, with 3 households (33.3%) experiencing poverty. Likewise, among single-mother households, those with 5 or more children have the highest poverty rate, with 1 households (100.0%) falling below the poverty line.
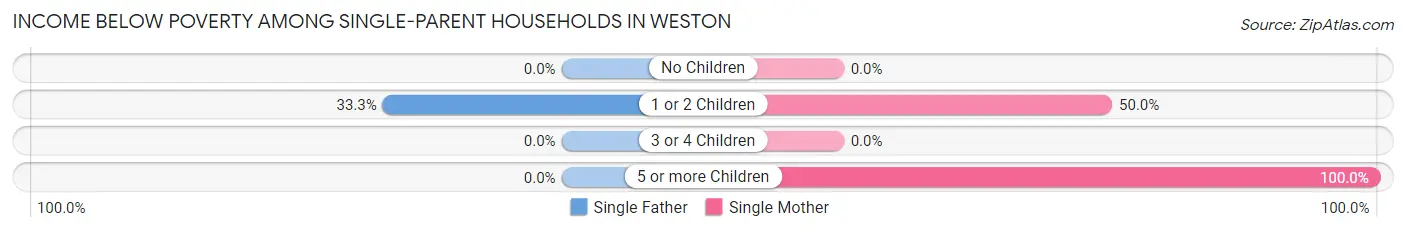
| Children | Single Father | Single Mother |
| No Children | 0 (0.0%) | 0 (0.0%) |
| 1 or 2 Children | 3 (33.3%) | 2 (50.0%) |
| 3 or 4 Children | 0 (0.0%) | 0 (0.0%) |
| 5 or more Children | 0 (0.0%) | 1 (100.0%) |
| Total | 3 (18.8%) | 3 (37.5%) |
Income Below Poverty Among Married-Couple vs Single-Parent Households in Weston
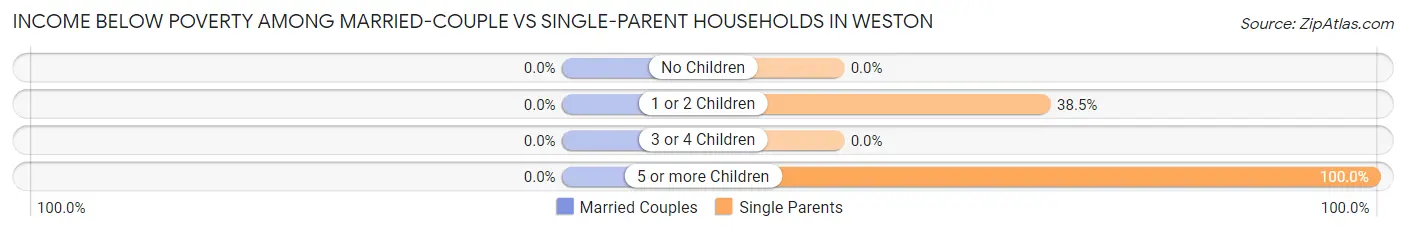
| Children | Married-Couple Families | Single-Parent Households |
| No Children | 0 (0.0%) | 0 (0.0%) |
| 1 or 2 Children | 0 (0.0%) | 5 (38.5%) |
| 3 or 4 Children | 0 (0.0%) | 0 (0.0%) |
| 5 or more Children | 0 (0.0%) | 1 (100.0%) |
| Total | 0 (0.0%) | 6 (25.0%) |
Race in Weston
The most populous races in Weston are White / Caucasian (251 | 98.8%), Hispanic or Latino (3 | 1.2%), and Two or more Races (3 | 1.2%).
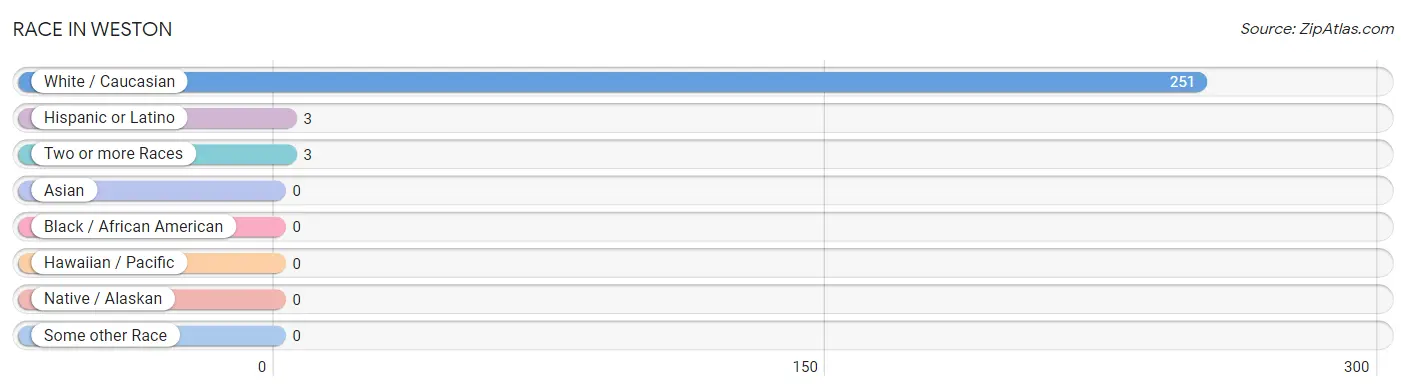
| Race | # Population | % Population |
| Asian | 0 | 0.0% |
| Black / African American | 0 | 0.0% |
| Hawaiian / Pacific | 0 | 0.0% |
| Hispanic or Latino | 3 | 1.2% |
| Native / Alaskan | 0 | 0.0% |
| White / Caucasian | 251 | 98.8% |
| Two or more Races | 3 | 1.2% |
| Some other Race | 0 | 0.0% |
| Total | 254 | 100.0% |
Ancestry in Weston
The most populous ancestries reported in Weston are Czech (80 | 31.5%), German (71 | 28.0%), Irish (29 | 11.4%), English (25 | 9.8%), and Polish (17 | 6.7%), together accounting for 87.4% of all Weston residents.
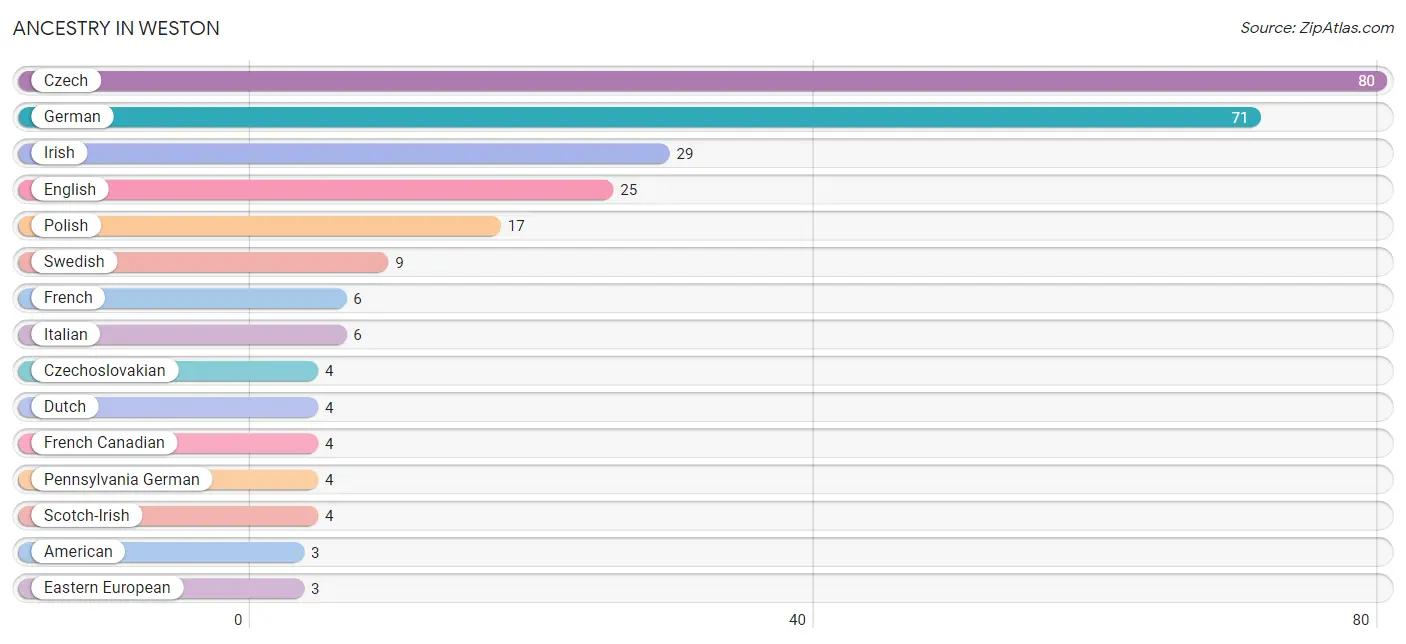
| Ancestry | # Population | % Population |
| American | 3 | 1.2% |
| Czech | 80 | 31.5% |
| Czechoslovakian | 4 | 1.6% |
| Dutch | 4 | 1.6% |
| Eastern European | 3 | 1.2% |
| English | 25 | 9.8% |
| European | 2 | 0.8% |
| French | 6 | 2.4% |
| French Canadian | 4 | 1.6% |
| German | 71 | 28.0% |
| Irish | 29 | 11.4% |
| Italian | 6 | 2.4% |
| Lithuanian | 1 | 0.4% |
| Mexican | 3 | 1.2% |
| Pennsylvania German | 4 | 1.6% |
| Polish | 17 | 6.7% |
| Scotch-Irish | 4 | 1.6% |
| Swedish | 9 | 3.5% | View All 18 Rows |
Immigrants in Weston

| Immigration Origin | # Population | % Population | View All 0 Rows |
Sex and Age in Weston
Sex and Age in Weston
The most populous age groups in Weston are Under 5 Years (22 | 16.2%) for men and 60 to 64 Years (19 | 16.1%) for women.
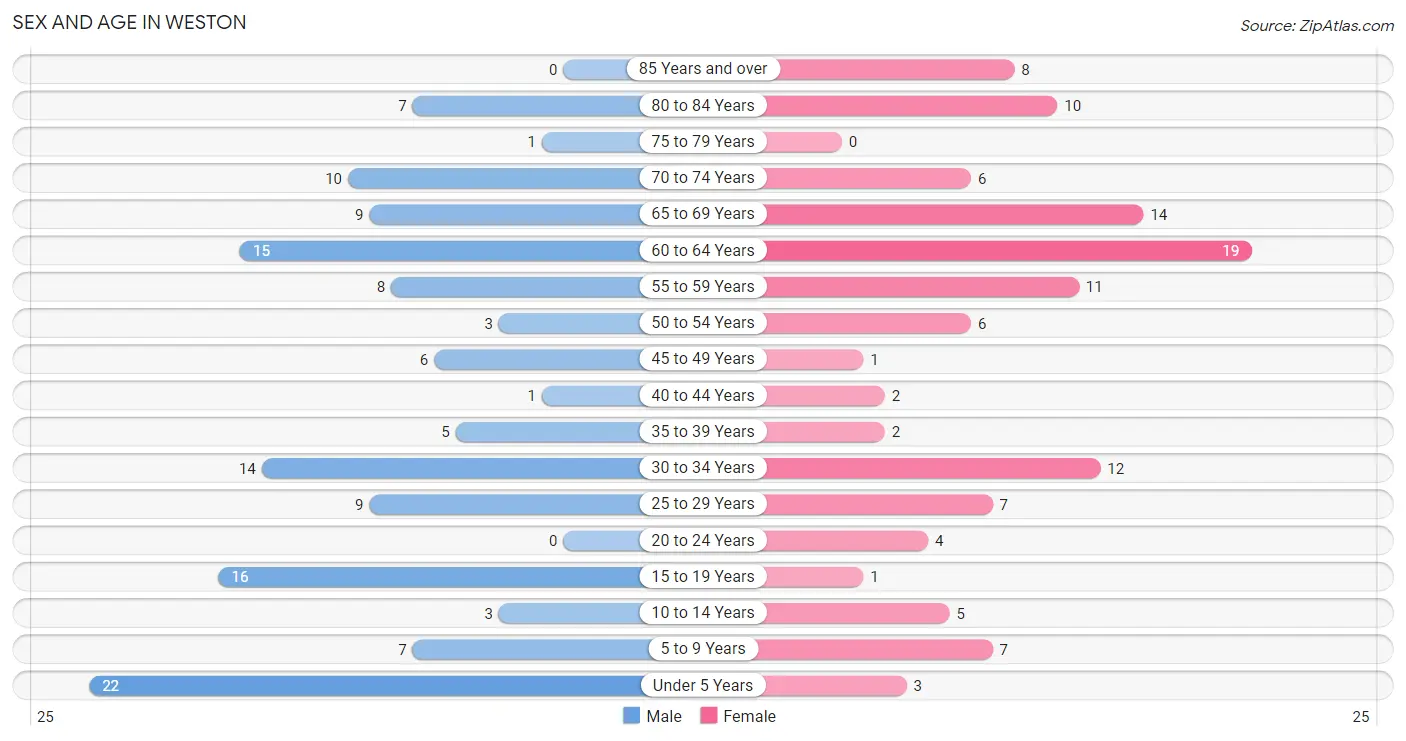
| Age Bracket | Male | Female |
| Under 5 Years | 22 (16.2%) | 3 (2.5%) |
| 5 to 9 Years | 7 (5.1%) | 7 (5.9%) |
| 10 to 14 Years | 3 (2.2%) | 5 (4.2%) |
| 15 to 19 Years | 16 (11.8%) | 1 (0.9%) |
| 20 to 24 Years | 0 (0.0%) | 4 (3.4%) |
| 25 to 29 Years | 9 (6.6%) | 7 (5.9%) |
| 30 to 34 Years | 14 (10.3%) | 12 (10.2%) |
| 35 to 39 Years | 5 (3.7%) | 2 (1.7%) |
| 40 to 44 Years | 1 (0.7%) | 2 (1.7%) |
| 45 to 49 Years | 6 (4.4%) | 1 (0.9%) |
| 50 to 54 Years | 3 (2.2%) | 6 (5.1%) |
| 55 to 59 Years | 8 (5.9%) | 11 (9.3%) |
| 60 to 64 Years | 15 (11.0%) | 19 (16.1%) |
| 65 to 69 Years | 9 (6.6%) | 14 (11.9%) |
| 70 to 74 Years | 10 (7.3%) | 6 (5.1%) |
| 75 to 79 Years | 1 (0.7%) | 0 (0.0%) |
| 80 to 84 Years | 7 (5.1%) | 10 (8.5%) |
| 85 Years and over | 0 (0.0%) | 8 (6.8%) |
| Total | 136 (100.0%) | 118 (100.0%) |
Families and Households in Weston
Median Family Size in Weston
The median family size in Weston is 2.52 persons per family, with single female/mother families (8 | 9.8%) accounting for the largest median family size of 4.25 persons per family. On the other hand, single male/father families (16 | 19.5%) represent the smallest median family size with 1.81 persons per family.
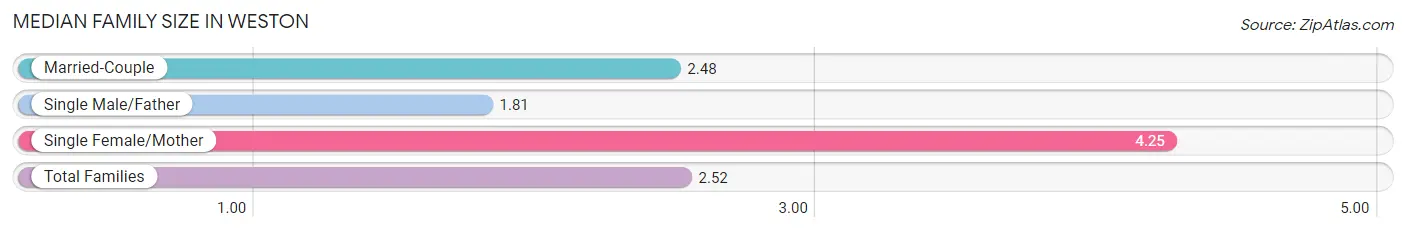
| Family Type | # Families | Family Size |
| Married-Couple | 58 (70.7%) | 2.48 |
| Single Male/Father | 16 (19.5%) | 1.81 |
| Single Female/Mother | 8 (9.8%) | 4.25 |
| Total Families | 82 (100.0%) | 2.52 |
Median Household Size in Weston
The median household size in Weston is 2.21 persons per household, with single female/mother households (8 | 7.0%) accounting for the largest median household size of 4.75 persons per household. non-family households (33 | 28.7%) represent the smallest median household size with 1.15 persons per household.
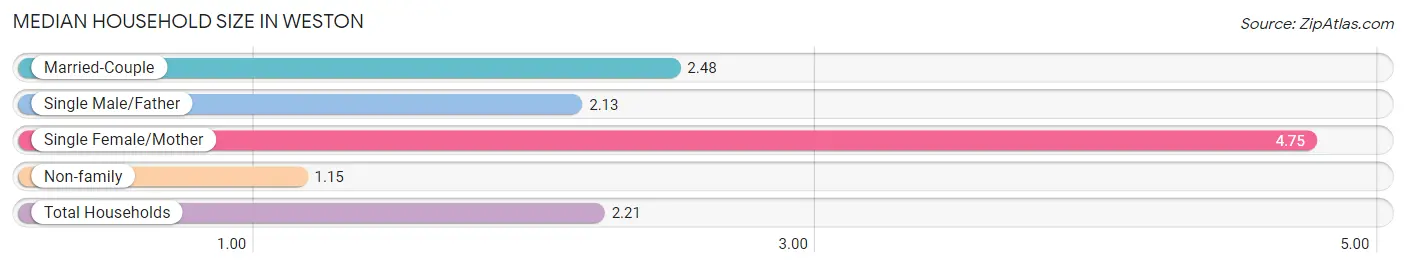
| Household Type | # Households | Household Size |
| Married-Couple | 58 (50.4%) | 2.48 |
| Single Male/Father | 16 (13.9%) | 2.13 |
| Single Female/Mother | 8 (7.0%) | 4.75 |
| Non-family | 33 (28.7%) | 1.15 |
| Total Households | 115 (100.0%) | 2.21 |
Household Size by Marriage Status in Weston
Out of a total of 115 households in Weston, 82 (71.3%) are family households, while 33 (28.7%) are nonfamily households. The most numerous type of family households are 2-person households, comprising 56, and the most common type of nonfamily households are 1-person households, comprising 27.
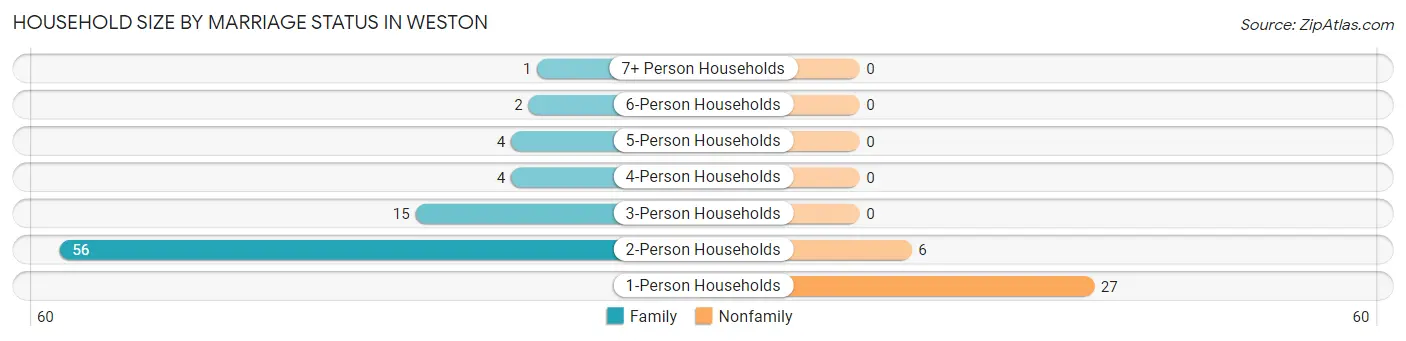
| Household Size | Family Households | Nonfamily Households |
| 1-Person Households | - | 27 (23.5%) |
| 2-Person Households | 56 (48.7%) | 6 (5.2%) |
| 3-Person Households | 15 (13.0%) | 0 (0.0%) |
| 4-Person Households | 4 (3.5%) | 0 (0.0%) |
| 5-Person Households | 4 (3.5%) | 0 (0.0%) |
| 6-Person Households | 2 (1.7%) | 0 (0.0%) |
| 7+ Person Households | 1 (0.9%) | 0 (0.0%) |
| Total | 82 (71.3%) | 33 (28.7%) |
Female Fertility in Weston
Fertility by Age in Weston
| Age Bracket | Women with Births | Births / 1,000 Women |
| 15 to 19 years | 0 (0.0%) | 0.0 |
| 20 to 34 years | 0 (0.0%) | 0.0 |
| 35 to 50 years | 0 (0.0%) | 0.0 |
| Total | 0 (0.0%) | 0.0 |
Fertility by Age by Marriage Status in Weston
| Age Bracket | Married | Unmarried |
| 15 to 19 years | 0 (0.0%) | 0 (0.0%) |
| 20 to 34 years | 0 (0.0%) | 0 (0.0%) |
| 35 to 50 years | 0 (0.0%) | 0 (0.0%) |
| Total | 0 (0.0%) | 0 (0.0%) |
Fertility by Education in Weston
| Educational Attainment | Women with Births | Births / 1,000 Women |
| Less than High School | 0 (0.0%) | 0.0 |
| High School Diploma | 0 (0.0%) | 0.0 |
| College or Associate's Degree | 0 (0.0%) | 0.0 |
| Bachelor's Degree | 0 (0.0%) | 0.0 |
| Graduate Degree | 0 (0.0%) | 0.0 |
| Total | 0 (0.0%) | 0.0 |
Fertility by Education by Marriage Status in Weston
| Educational Attainment | Married | Unmarried |
| Less than High School | 0 (0.0%) | 0 (0.0%) |
| High School Diploma | 0 (0.0%) | 0 (0.0%) |
| College or Associate's Degree | 0 (0.0%) | 0 (0.0%) |
| Bachelor's Degree | 0 (0.0%) | 0 (0.0%) |
| Graduate Degree | 0 (0.0%) | 0 (0.0%) |
| Total | 0 (0.0%) | 0 (0.0%) |
Employment Characteristics in Weston
Employment by Class of Employer in Weston
Among the 122 employed individuals in Weston, private company employees (68 | 55.7%), not-for-profit organizations (15 | 12.3%), and local government employees (15 | 12.3%) make up the most common classes of employment.
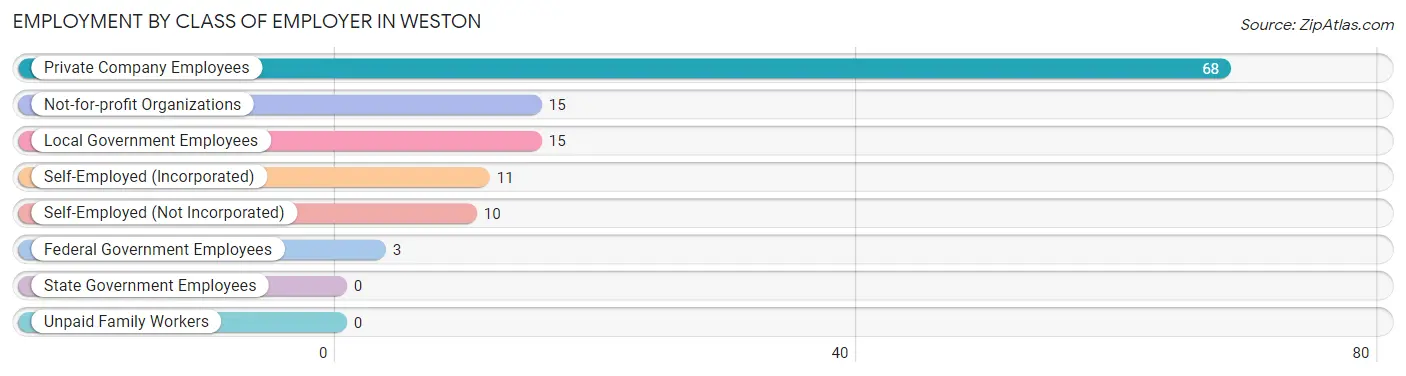
| Employer Class | # Employees | % Employees |
| Private Company Employees | 68 | 55.7% |
| Self-Employed (Incorporated) | 11 | 9.0% |
| Self-Employed (Not Incorporated) | 10 | 8.2% |
| Not-for-profit Organizations | 15 | 12.3% |
| Local Government Employees | 15 | 12.3% |
| State Government Employees | 0 | 0.0% |
| Federal Government Employees | 3 | 2.5% |
| Unpaid Family Workers | 0 | 0.0% |
| Total | 122 | 100.0% |
Employment Status by Age in Weston
According to the labor force statistics for Weston, out of the total population over 16 years of age (207), 61.4% or 127 individuals are in the labor force, with 3.1% or 4 of them unemployed. The age group with the highest labor force participation rate is 25 to 29 years, with 100.0% or 16 individuals in the labor force. Within the labor force, the 60 to 64 years age range has the highest percentage of unemployed individuals, with 14.8% or 4 of them being unemployed.
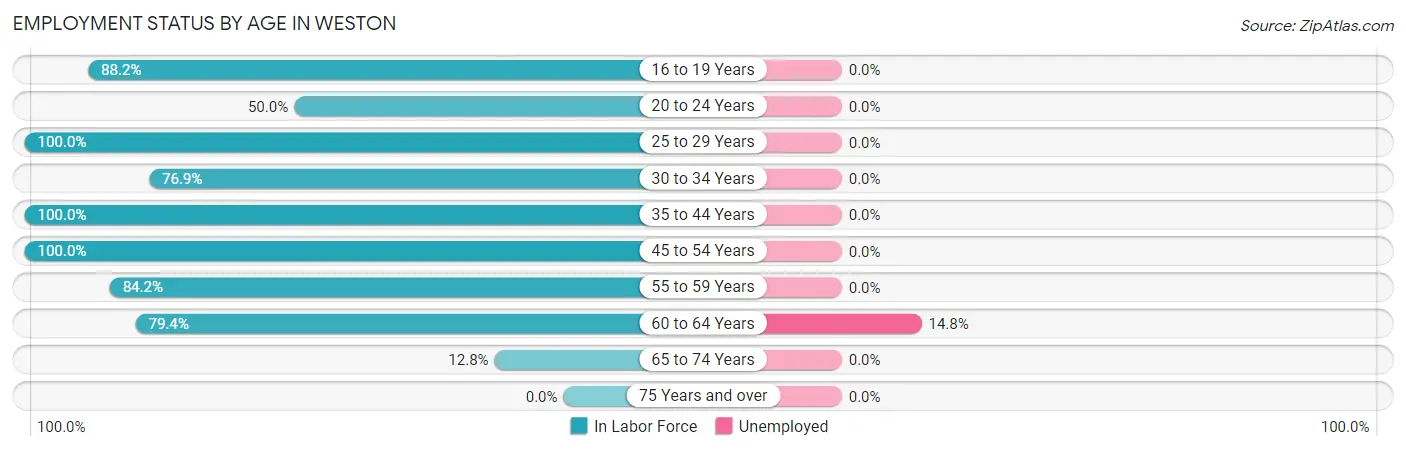
| Age Bracket | In Labor Force | Unemployed |
| 16 to 19 Years | 15 (88.2%) | 0 (0.0%) |
| 20 to 24 Years | 2 (50.0%) | 0 (0.0%) |
| 25 to 29 Years | 16 (100.0%) | 0 (0.0%) |
| 30 to 34 Years | 20 (76.9%) | 0 (0.0%) |
| 35 to 44 Years | 10 (100.0%) | 0 (0.0%) |
| 45 to 54 Years | 16 (100.0%) | 0 (0.0%) |
| 55 to 59 Years | 16 (84.2%) | 0 (0.0%) |
| 60 to 64 Years | 27 (79.4%) | 4 (14.8%) |
| 65 to 74 Years | 5 (12.8%) | 0 (0.0%) |
| 75 Years and over | 0 (0.0%) | 0 (0.0%) |
| Total | 127 (61.4%) | 4 (3.1%) |
Employment Status by Educational Attainment in Weston
According to labor force statistics for Weston, 86.8% of individuals (105) out of the total population between 25 and 64 years of age (121) are in the labor force, with 3.8% or 4 of them being unemployed. The group with the highest labor force participation rate are those with the educational attainment of bachelor's degree or higher, with 100.0% or 14 individuals in the labor force. Within the labor force, individuals with high school diploma education have the highest percentage of unemployment, with 7.8% or 4 of them being unemployed.
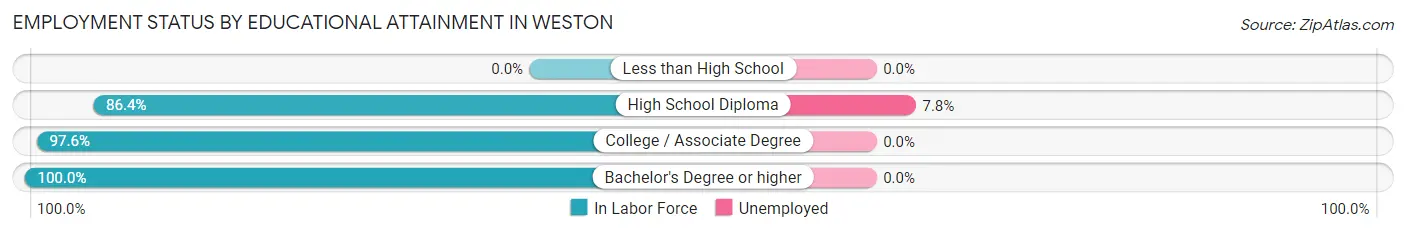
| Educational Attainment | In Labor Force | Unemployed |
| Less than High School | 0 (0.0%) | 0 (0.0%) |
| High School Diploma | 51 (86.4%) | 5 (7.8%) |
| College / Associate Degree | 40 (97.6%) | 0 (0.0%) |
| Bachelor's Degree or higher | 14 (100.0%) | 0 (0.0%) |
| Total | 105 (86.8%) | 5 (3.8%) |
Employment Occupations by Sex in Weston
Management, Business, Science and Arts Occupations
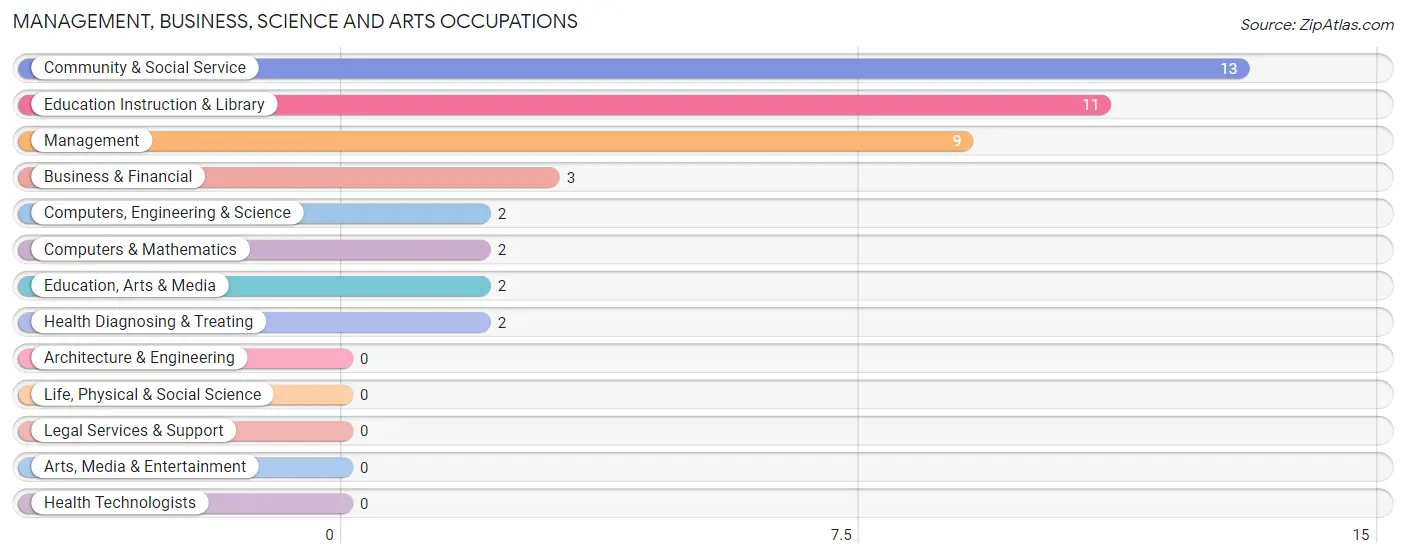
The most common Management, Business, Science and Arts occupations in Weston are Community & Social Service (13 | 10.6%), Education Instruction & Library (11 | 8.9%), Management (9 | 7.3%), Business & Financial (3 | 2.4%), and Computers, Engineering & Science (2 | 1.6%).
Management, Business, Science and Arts Occupations by Sex
Within the Management, Business, Science and Arts occupations in Weston, the most male-oriented occupations are Business & Financial (100.0%), Computers, Engineering & Science (100.0%), and Computers & Mathematics (100.0%), while the most female-oriented occupations are Education, Arts & Media (100.0%), Health Diagnosing & Treating (100.0%), and Community & Social Service (84.6%).
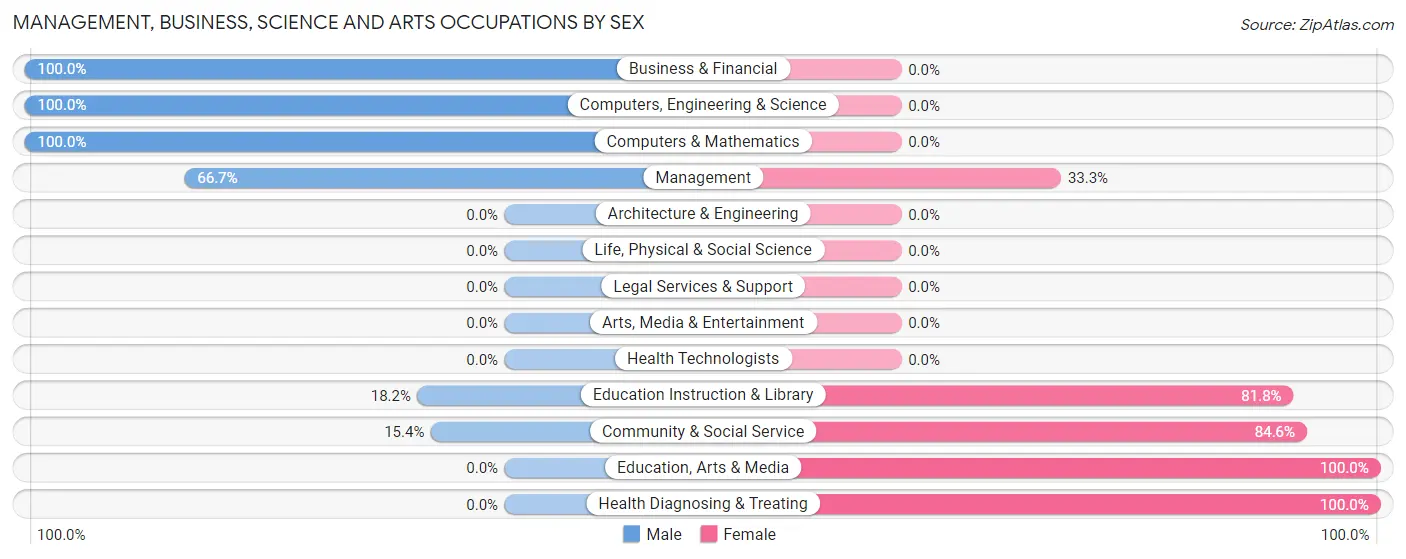
| Occupation | Male | Female |
| Management | 6 (66.7%) | 3 (33.3%) |
| Business & Financial | 3 (100.0%) | 0 (0.0%) |
| Computers, Engineering & Science | 2 (100.0%) | 0 (0.0%) |
| Computers & Mathematics | 2 (100.0%) | 0 (0.0%) |
| Architecture & Engineering | 0 (0.0%) | 0 (0.0%) |
| Life, Physical & Social Science | 0 (0.0%) | 0 (0.0%) |
| Community & Social Service | 2 (15.4%) | 11 (84.6%) |
| Education, Arts & Media | 0 (0.0%) | 2 (100.0%) |
| Legal Services & Support | 0 (0.0%) | 0 (0.0%) |
| Education Instruction & Library | 2 (18.2%) | 9 (81.8%) |
| Arts, Media & Entertainment | 0 (0.0%) | 0 (0.0%) |
| Health Diagnosing & Treating | 0 (0.0%) | 2 (100.0%) |
| Health Technologists | 0 (0.0%) | 0 (0.0%) |
| Total (Category) | 13 (44.8%) | 16 (55.2%) |
| Total (Overall) | 65 (52.8%) | 58 (47.1%) |
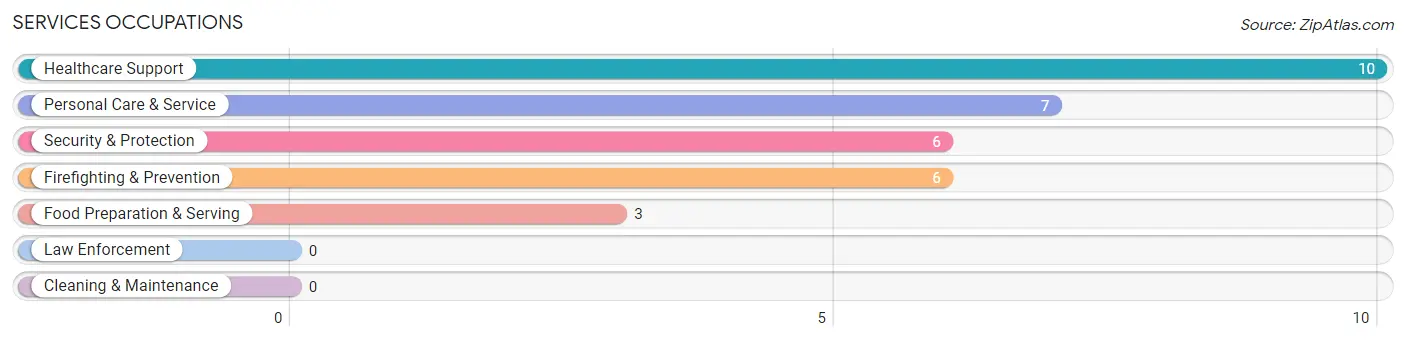
Services Occupations
The most common Services occupations in Weston are Healthcare Support (10 | 8.1%), Personal Care & Service (7 | 5.7%), Security & Protection (6 | 4.9%), Firefighting & Prevention (6 | 4.9%), and Food Preparation & Serving (3 | 2.4%).
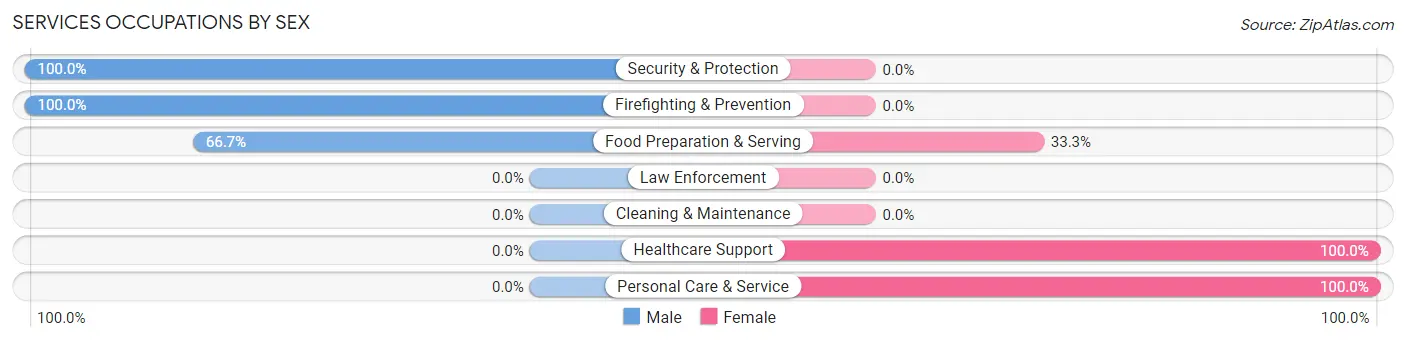
Services Occupations by Sex
Within the Services occupations in Weston, the most male-oriented occupations are Security & Protection (100.0%), Firefighting & Prevention (100.0%), and Food Preparation & Serving (66.7%), while the most female-oriented occupations are Healthcare Support (100.0%), Personal Care & Service (100.0%), and Food Preparation & Serving (33.3%).
| Occupation | Male | Female |
| Healthcare Support | 0 (0.0%) | 10 (100.0%) |
| Security & Protection | 6 (100.0%) | 0 (0.0%) |
| Firefighting & Prevention | 6 (100.0%) | 0 (0.0%) |
| Law Enforcement | 0 (0.0%) | 0 (0.0%) |
| Food Preparation & Serving | 2 (66.7%) | 1 (33.3%) |
| Cleaning & Maintenance | 0 (0.0%) | 0 (0.0%) |
| Personal Care & Service | 0 (0.0%) | 7 (100.0%) |
| Total (Category) | 8 (30.8%) | 18 (69.2%) |
| Total (Overall) | 65 (52.8%) | 58 (47.1%) |
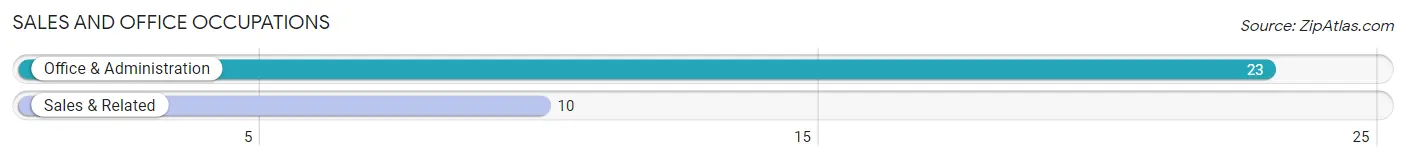
Sales and Office Occupations
The most common Sales and Office occupations in Weston are Office & Administration (23 | 18.7%), and Sales & Related (10 | 8.1%).
Sales and Office Occupations by Sex

| Occupation | Male | Female |
| Sales & Related | 10 (100.0%) | 0 (0.0%) |
| Office & Administration | 6 (26.1%) | 17 (73.9%) |
| Total (Category) | 16 (48.5%) | 17 (51.5%) |
| Total (Overall) | 65 (52.8%) | 58 (47.1%) |
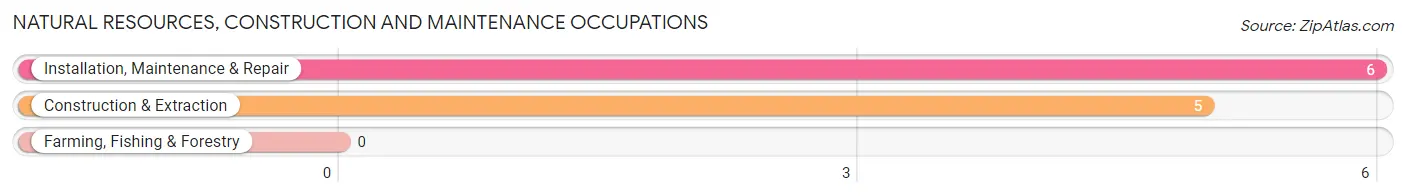
Natural Resources, Construction and Maintenance Occupations
The most common Natural Resources, Construction and Maintenance occupations in Weston are Installation, Maintenance & Repair (6 | 4.9%), and Construction & Extraction (5 | 4.1%).
Natural Resources, Construction and Maintenance Occupations by Sex
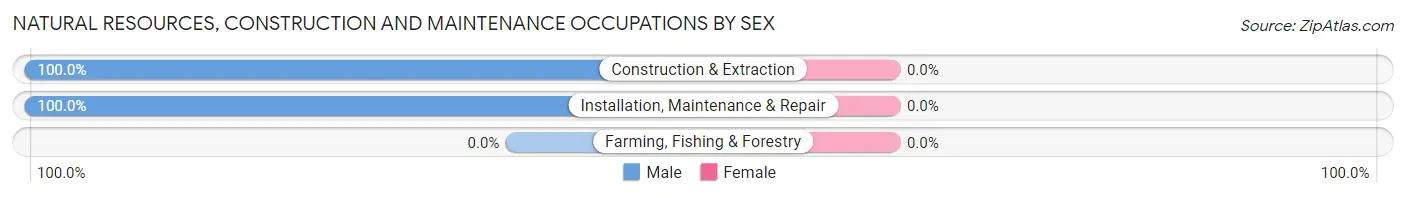
| Occupation | Male | Female |
| Farming, Fishing & Forestry | 0 (0.0%) | 0 (0.0%) |
| Construction & Extraction | 5 (100.0%) | 0 (0.0%) |
| Installation, Maintenance & Repair | 6 (100.0%) | 0 (0.0%) |
| Total (Category) | 11 (100.0%) | 0 (0.0%) |
| Total (Overall) | 65 (52.8%) | 58 (47.1%) |
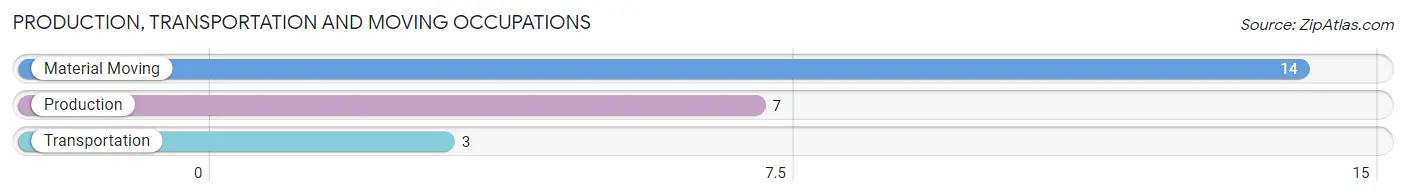
Production, Transportation and Moving Occupations
The most common Production, Transportation and Moving occupations in Weston are Material Moving (14 | 11.4%), Production (7 | 5.7%), and Transportation (3 | 2.4%).
Production, Transportation and Moving Occupations by Sex
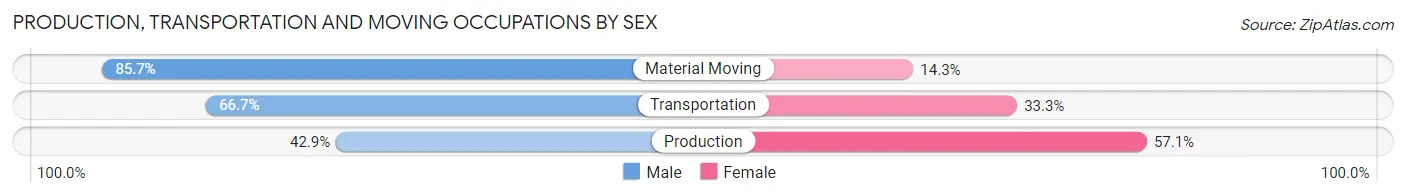
| Occupation | Male | Female |
| Production | 3 (42.9%) | 4 (57.1%) |
| Transportation | 2 (66.7%) | 1 (33.3%) |
| Material Moving | 12 (85.7%) | 2 (14.3%) |
| Total (Category) | 17 (70.8%) | 7 (29.2%) |
| Total (Overall) | 65 (52.8%) | 58 (47.1%) |
Employment Industries by Sex in Weston
Employment Industries in Weston
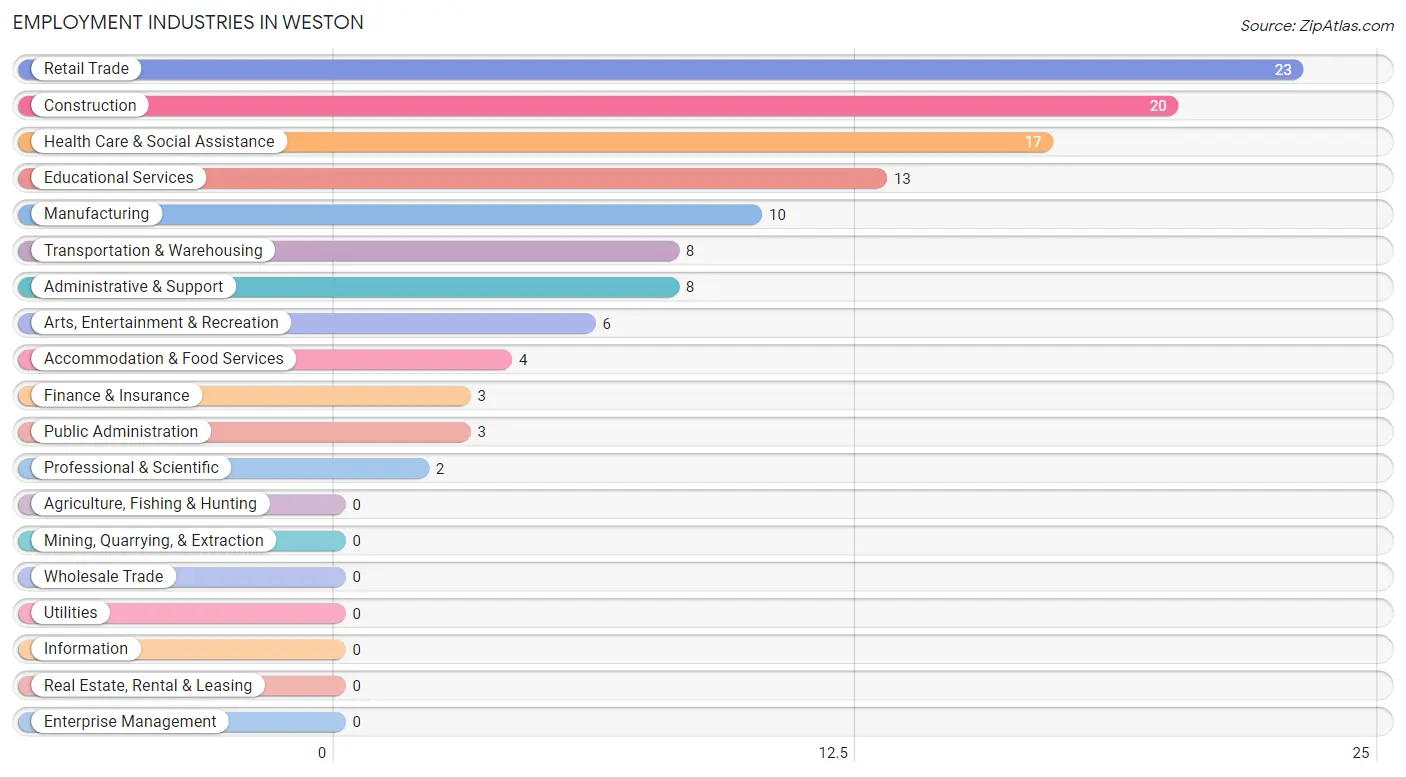
The major employment industries in Weston include Retail Trade (23 | 18.7%), Construction (20 | 16.3%), Health Care & Social Assistance (17 | 13.8%), Educational Services (13 | 10.6%), and Manufacturing (10 | 8.1%).
Employment Industries by Sex in Weston
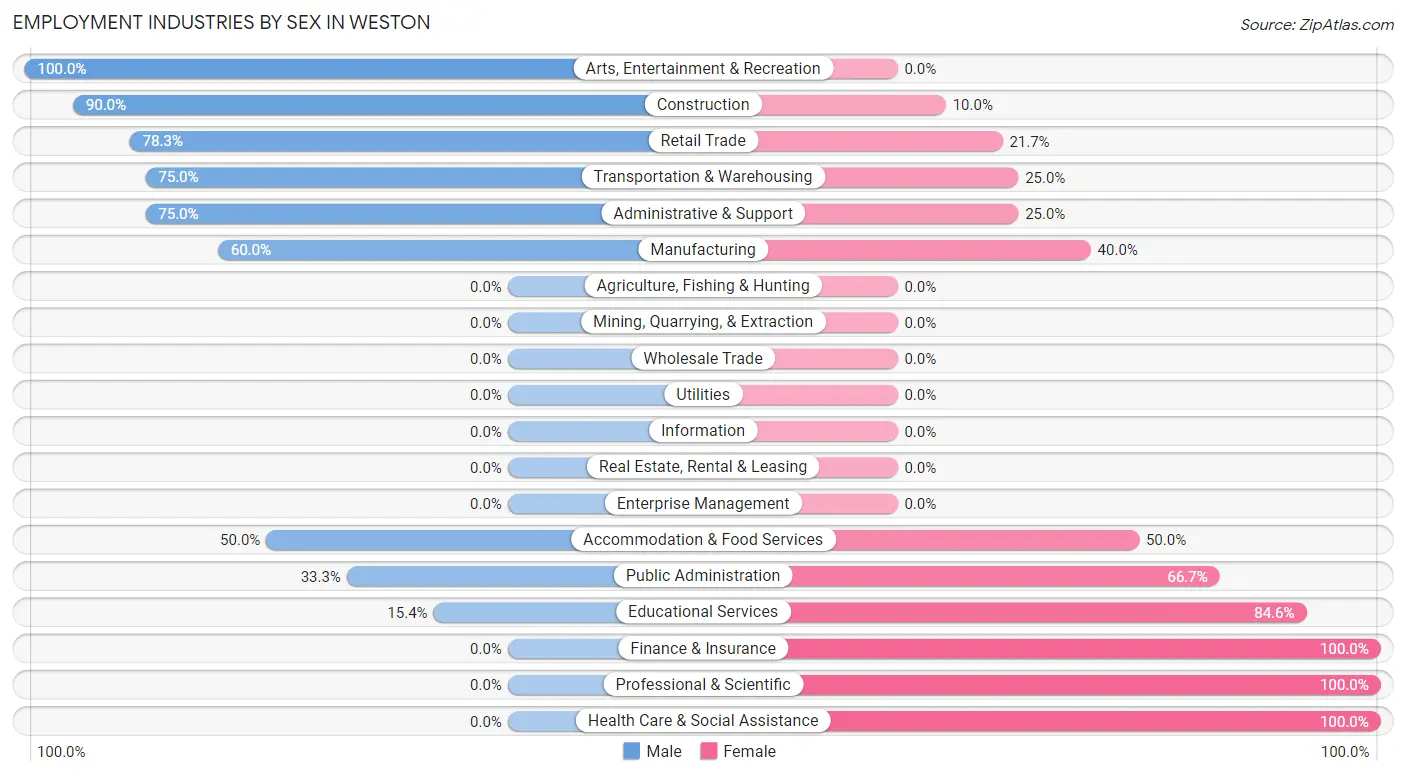
The Weston industries that see more men than women are Arts, Entertainment & Recreation (100.0%), Construction (90.0%), and Retail Trade (78.3%), whereas the industries that tend to have a higher number of women are Finance & Insurance (100.0%), Professional & Scientific (100.0%), and Health Care & Social Assistance (100.0%).
| Industry | Male | Female |
| Agriculture, Fishing & Hunting | 0 (0.0%) | 0 (0.0%) |
| Mining, Quarrying, & Extraction | 0 (0.0%) | 0 (0.0%) |
| Construction | 18 (90.0%) | 2 (10.0%) |
| Manufacturing | 6 (60.0%) | 4 (40.0%) |
| Wholesale Trade | 0 (0.0%) | 0 (0.0%) |
| Retail Trade | 18 (78.3%) | 5 (21.7%) |
| Transportation & Warehousing | 6 (75.0%) | 2 (25.0%) |
| Utilities | 0 (0.0%) | 0 (0.0%) |
| Information | 0 (0.0%) | 0 (0.0%) |
| Finance & Insurance | 0 (0.0%) | 3 (100.0%) |
| Real Estate, Rental & Leasing | 0 (0.0%) | 0 (0.0%) |
| Professional & Scientific | 0 (0.0%) | 2 (100.0%) |
| Enterprise Management | 0 (0.0%) | 0 (0.0%) |
| Administrative & Support | 6 (75.0%) | 2 (25.0%) |
| Educational Services | 2 (15.4%) | 11 (84.6%) |
| Health Care & Social Assistance | 0 (0.0%) | 17 (100.0%) |
| Arts, Entertainment & Recreation | 6 (100.0%) | 0 (0.0%) |
| Accommodation & Food Services | 2 (50.0%) | 2 (50.0%) |
| Public Administration | 1 (33.3%) | 2 (66.7%) |
| Total | 65 (52.8%) | 58 (47.1%) |
Education in Weston
School Enrollment in Weston
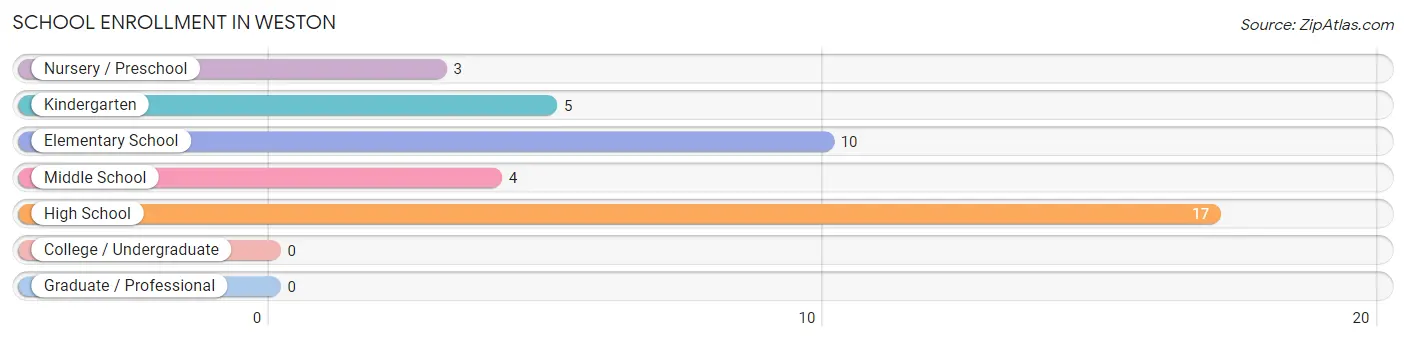
The most common levels of schooling among the 39 students in Weston are high school (17 | 43.6%), elementary school (10 | 25.6%), and kindergarten (5 | 12.8%).
| School Level | # Students | % Students |
| Nursery / Preschool | 3 | 7.7% |
| Kindergarten | 5 | 12.8% |
| Elementary School | 10 | 25.6% |
| Middle School | 4 | 10.3% |
| High School | 17 | 43.6% |
| College / Undergraduate | 0 | 0.0% |
| Graduate / Professional | 0 | 0.0% |
| Total | 39 | 100.0% |
School Enrollment by Age by Funding Source in Weston
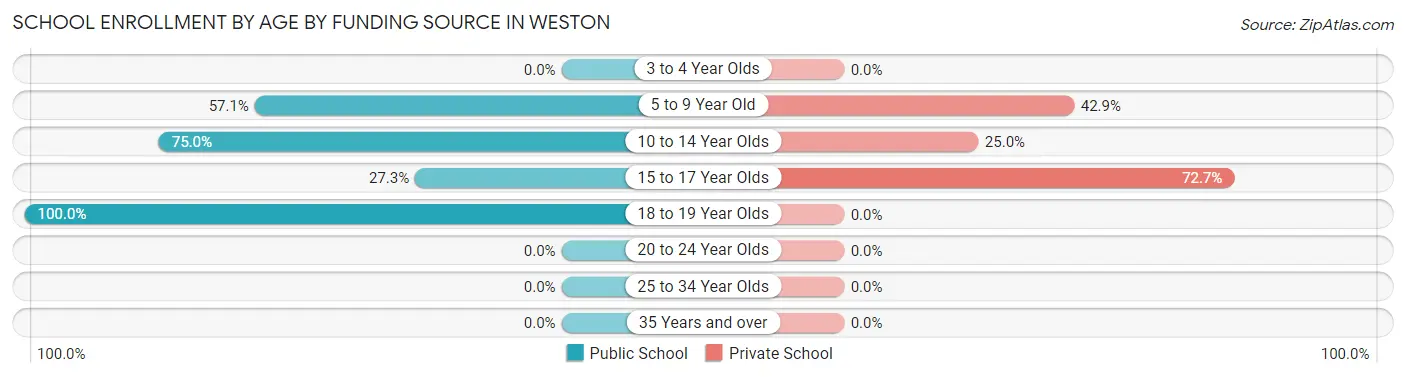
Out of a total of 39 students who are enrolled in schools in Weston, 16 (41.0%) attend a private institution, while the remaining 23 (59.0%) are enrolled in public schools. The age group of 15 to 17 year olds has the highest likelihood of being enrolled in private schools, with 8 (72.7% in the age bracket) enrolled. Conversely, the age group of 18 to 19 year olds has the lowest likelihood of being enrolled in a private school, with 6 (100.0% in the age bracket) attending a public institution.
| Age Bracket | Public School | Private School |
| 3 to 4 Year Olds | 0 (0.0%) | 0 (0.0%) |
| 5 to 9 Year Old | 8 (57.1%) | 6 (42.9%) |
| 10 to 14 Year Olds | 6 (75.0%) | 2 (25.0%) |
| 15 to 17 Year Olds | 3 (27.3%) | 8 (72.7%) |
| 18 to 19 Year Olds | 6 (100.0%) | 0 (0.0%) |
| 20 to 24 Year Olds | 0 (0.0%) | 0 (0.0%) |
| 25 to 34 Year Olds | 0 (0.0%) | 0 (0.0%) |
| 35 Years and over | 0 (0.0%) | 0 (0.0%) |
| Total | 23 (59.0%) | 16 (41.0%) |
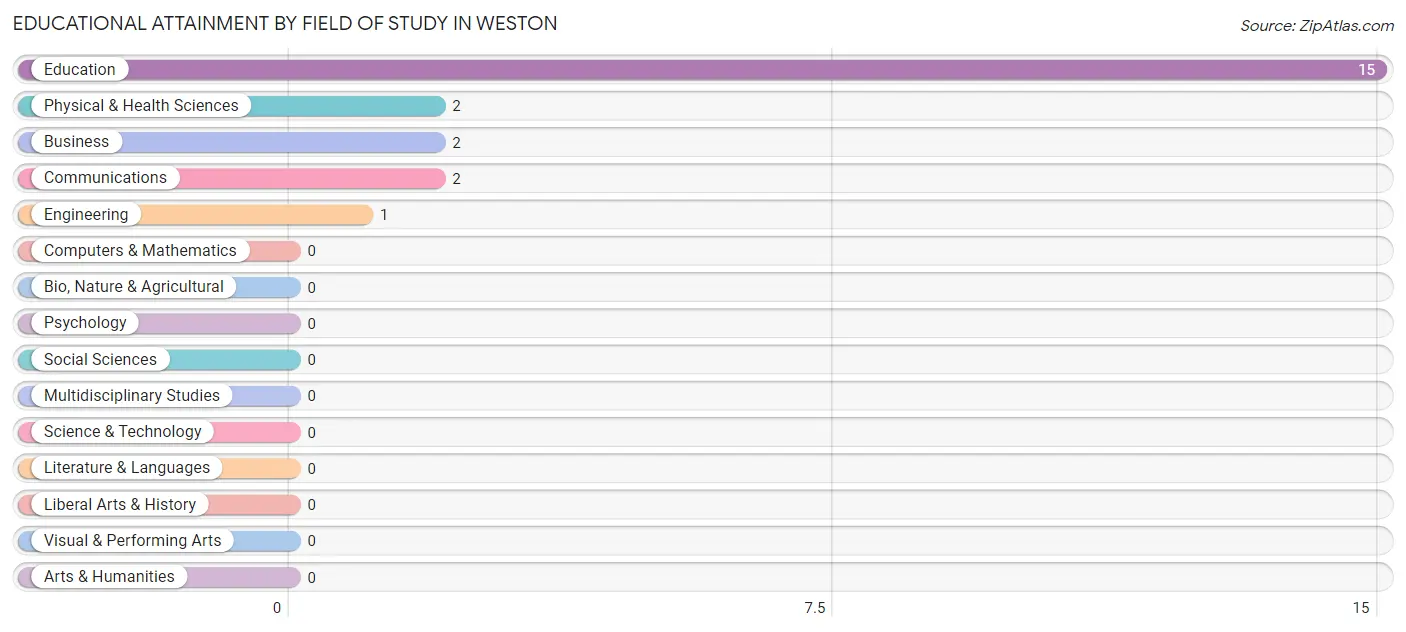
Educational Attainment by Field of Study in Weston
Education (15 | 68.2%), physical & health sciences (2 | 9.1%), business (2 | 9.1%), communications (2 | 9.1%), and engineering (1 | 4.5%) are the most common fields of study among 22 individuals in Weston who have obtained a bachelor's degree or higher.
| Field of Study | # Graduates | % Graduates |
| Computers & Mathematics | 0 | 0.0% |
| Bio, Nature & Agricultural | 0 | 0.0% |
| Physical & Health Sciences | 2 | 9.1% |
| Psychology | 0 | 0.0% |
| Social Sciences | 0 | 0.0% |
| Engineering | 1 | 4.5% |
| Multidisciplinary Studies | 0 | 0.0% |
| Science & Technology | 0 | 0.0% |
| Business | 2 | 9.1% |
| Education | 15 | 68.2% |
| Literature & Languages | 0 | 0.0% |
| Liberal Arts & History | 0 | 0.0% |
| Visual & Performing Arts | 0 | 0.0% |
| Communications | 2 | 9.1% |
| Arts & Humanities | 0 | 0.0% |
| Total | 22 | 100.0% |
Transportation & Commute in Weston
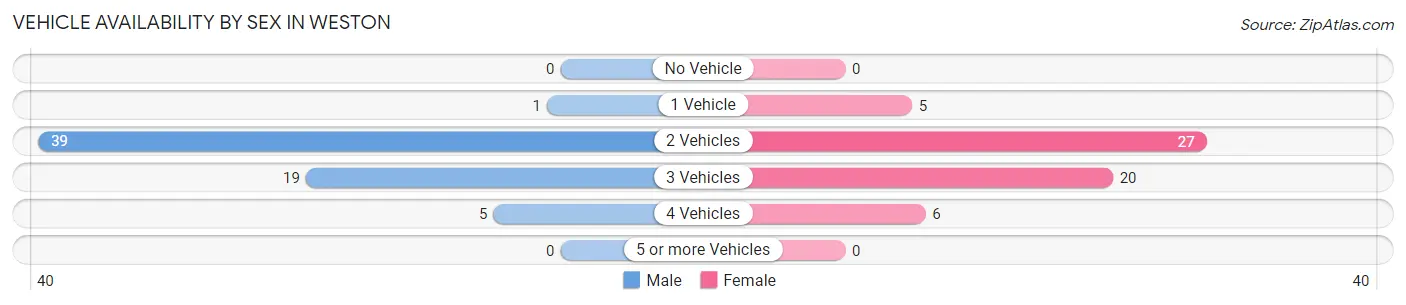
Vehicle Availability by Sex in Weston
The most prevalent vehicle ownership categories in Weston are males with 2 vehicles (39, accounting for 60.9%) and females with 2 vehicles (27, making up 67.2%).
| Vehicles Available | Male | Female |
| No Vehicle | 0 (0.0%) | 0 (0.0%) |
| 1 Vehicle | 1 (1.6%) | 5 (8.6%) |
| 2 Vehicles | 39 (60.9%) | 27 (46.6%) |
| 3 Vehicles | 19 (29.7%) | 20 (34.5%) |
| 4 Vehicles | 5 (7.8%) | 6 (10.3%) |
| 5 or more Vehicles | 0 (0.0%) | 0 (0.0%) |
| Total | 64 (100.0%) | 58 (100.0%) |
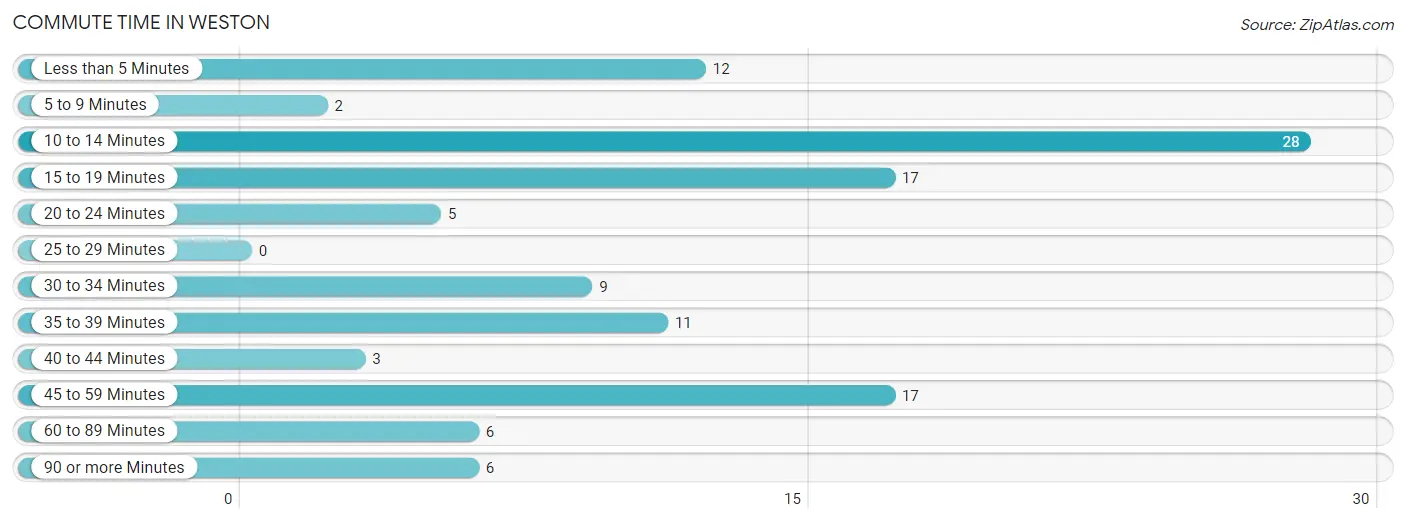
Commute Time in Weston
The most frequently occuring commute durations in Weston are 10 to 14 minutes (28 commuters, 24.1%), 15 to 19 minutes (17 commuters, 14.7%), and 45 to 59 minutes (17 commuters, 14.7%).
| Commute Time | # Commuters | % Commuters |
| Less than 5 Minutes | 12 | 10.3% |
| 5 to 9 Minutes | 2 | 1.7% |
| 10 to 14 Minutes | 28 | 24.1% |
| 15 to 19 Minutes | 17 | 14.7% |
| 20 to 24 Minutes | 5 | 4.3% |
| 25 to 29 Minutes | 0 | 0.0% |
| 30 to 34 Minutes | 9 | 7.8% |
| 35 to 39 Minutes | 11 | 9.5% |
| 40 to 44 Minutes | 3 | 2.6% |
| 45 to 59 Minutes | 17 | 14.7% |
| 60 to 89 Minutes | 6 | 5.2% |
| 90 or more Minutes | 6 | 5.2% |
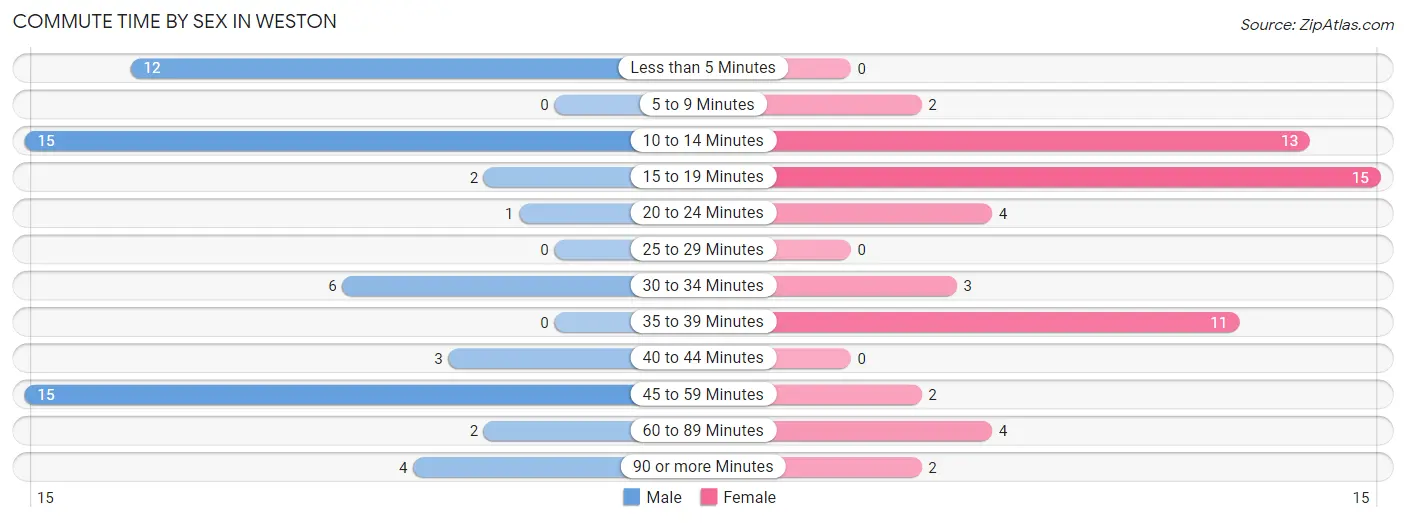
Commute Time by Sex in Weston
The most common commute times in Weston are 10 to 14 minutes (15 commuters, 25.0%) for males and 15 to 19 minutes (15 commuters, 26.8%) for females.
| Commute Time | Male | Female |
| Less than 5 Minutes | 12 (20.0%) | 0 (0.0%) |
| 5 to 9 Minutes | 0 (0.0%) | 2 (3.6%) |
| 10 to 14 Minutes | 15 (25.0%) | 13 (23.2%) |
| 15 to 19 Minutes | 2 (3.3%) | 15 (26.8%) |
| 20 to 24 Minutes | 1 (1.7%) | 4 (7.1%) |
| 25 to 29 Minutes | 0 (0.0%) | 0 (0.0%) |
| 30 to 34 Minutes | 6 (10.0%) | 3 (5.4%) |
| 35 to 39 Minutes | 0 (0.0%) | 11 (19.6%) |
| 40 to 44 Minutes | 3 (5.0%) | 0 (0.0%) |
| 45 to 59 Minutes | 15 (25.0%) | 2 (3.6%) |
| 60 to 89 Minutes | 2 (3.3%) | 4 (7.1%) |
| 90 or more Minutes | 4 (6.7%) | 2 (3.6%) |
Time of Departure to Work by Sex in Weston
The most frequent times of departure to work in Weston are 7:30 AM to 7:59 AM (14, 23.3%) for males and 7:00 AM to 7:29 AM (16, 28.6%) for females.
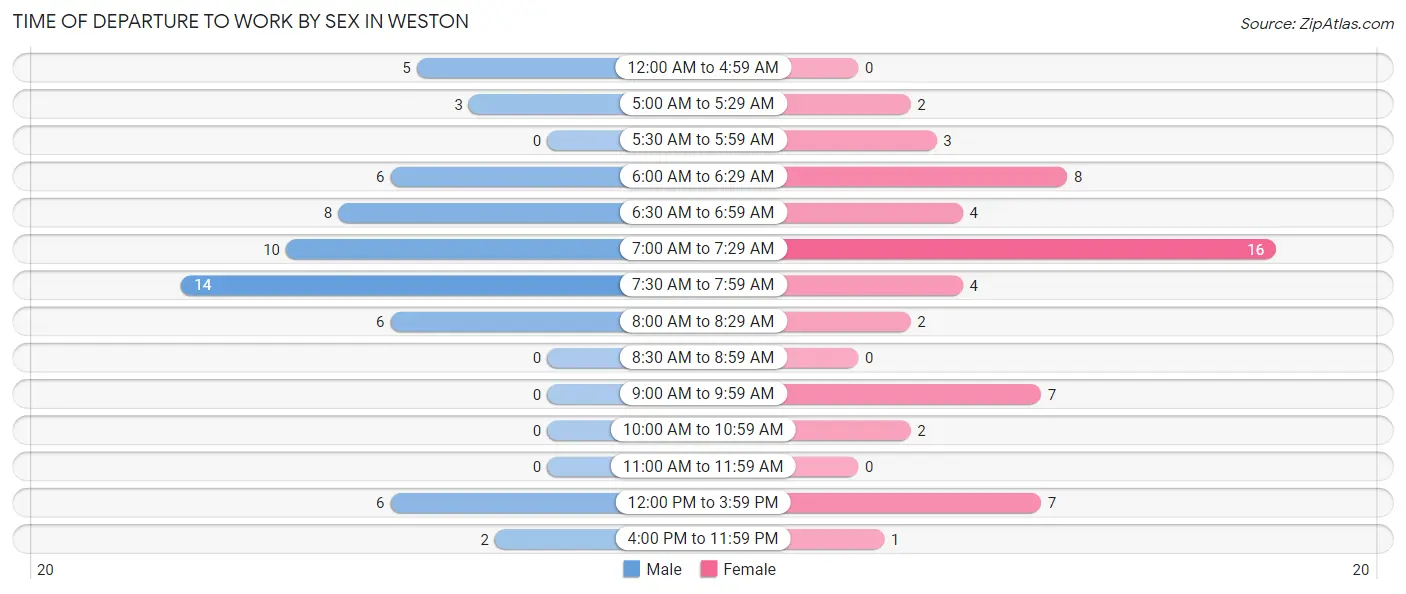
| Time of Departure | Male | Female |
| 12:00 AM to 4:59 AM | 5 (8.3%) | 0 (0.0%) |
| 5:00 AM to 5:29 AM | 3 (5.0%) | 2 (3.6%) |
| 5:30 AM to 5:59 AM | 0 (0.0%) | 3 (5.4%) |
| 6:00 AM to 6:29 AM | 6 (10.0%) | 8 (14.3%) |
| 6:30 AM to 6:59 AM | 8 (13.3%) | 4 (7.1%) |
| 7:00 AM to 7:29 AM | 10 (16.7%) | 16 (28.6%) |
| 7:30 AM to 7:59 AM | 14 (23.3%) | 4 (7.1%) |
| 8:00 AM to 8:29 AM | 6 (10.0%) | 2 (3.6%) |
| 8:30 AM to 8:59 AM | 0 (0.0%) | 0 (0.0%) |
| 9:00 AM to 9:59 AM | 0 (0.0%) | 7 (12.5%) |
| 10:00 AM to 10:59 AM | 0 (0.0%) | 2 (3.6%) |
| 11:00 AM to 11:59 AM | 0 (0.0%) | 0 (0.0%) |
| 12:00 PM to 3:59 PM | 6 (10.0%) | 7 (12.5%) |
| 4:00 PM to 11:59 PM | 2 (3.3%) | 1 (1.8%) |
| Total | 60 (100.0%) | 56 (100.0%) |
Housing Occupancy in Weston
Occupancy by Ownership in Weston
Of the total 115 dwellings in Weston, owner-occupied units account for 94 (81.7%), while renter-occupied units make up 21 (18.3%).
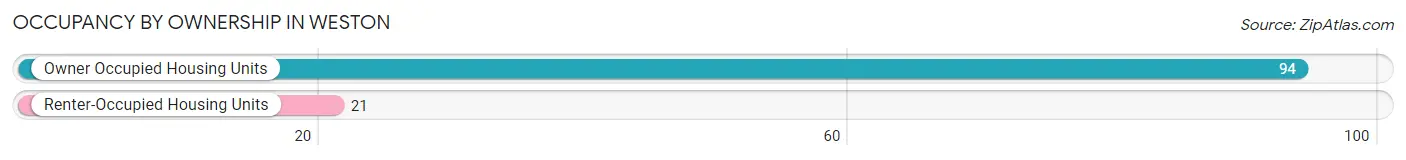
| Occupancy | # Housing Units | % Housing Units |
| Owner Occupied Housing Units | 94 | 81.7% |
| Renter-Occupied Housing Units | 21 | 18.3% |
| Total Occupied Housing Units | 115 | 100.0% |
Occupancy by Household Size in Weston
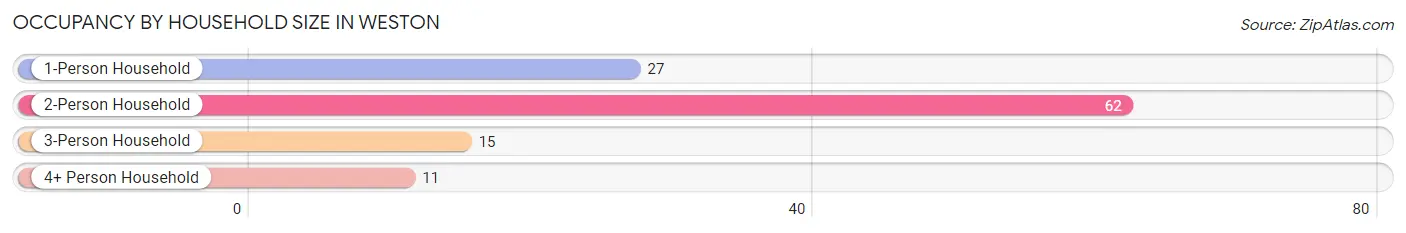
| Household Size | # Housing Units | % Housing Units |
| 1-Person Household | 27 | 23.5% |
| 2-Person Household | 62 | 53.9% |
| 3-Person Household | 15 | 13.0% |
| 4+ Person Household | 11 | 9.6% |
| Total Housing Units | 115 | 100.0% |
Occupancy by Ownership by Household Size in Weston
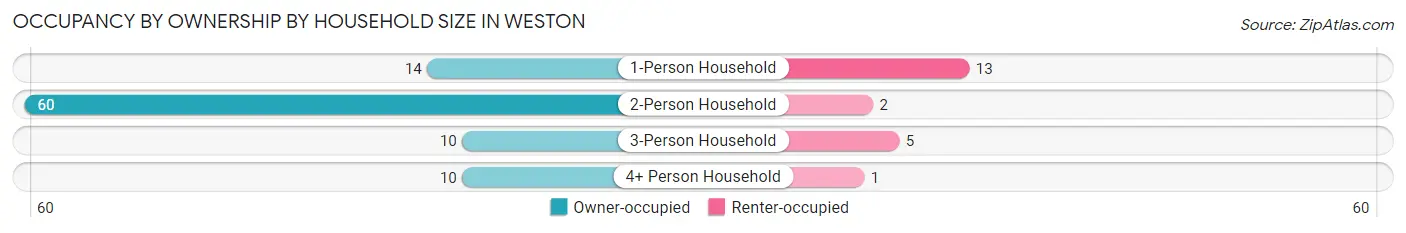
| Household Size | Owner-occupied | Renter-occupied |
| 1-Person Household | 14 (51.8%) | 13 (48.1%) |
| 2-Person Household | 60 (96.8%) | 2 (3.2%) |
| 3-Person Household | 10 (66.7%) | 5 (33.3%) |
| 4+ Person Household | 10 (90.9%) | 1 (9.1%) |
| Total Housing Units | 94 (81.7%) | 21 (18.3%) |
Occupancy by Educational Attainment in Weston
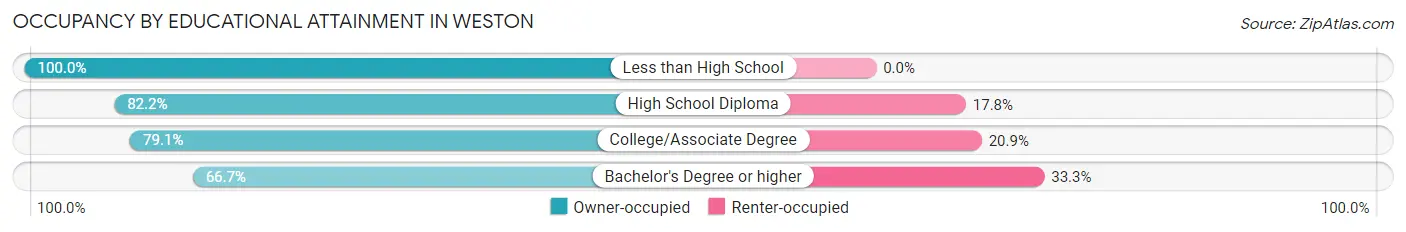
| Household Size | Owner-occupied | Renter-occupied |
| Less than High School | 15 (100.0%) | 0 (0.0%) |
| High School Diploma | 37 (82.2%) | 8 (17.8%) |
| College/Associate Degree | 34 (79.1%) | 9 (20.9%) |
| Bachelor's Degree or higher | 8 (66.7%) | 4 (33.3%) |
Occupancy by Age of Householder in Weston
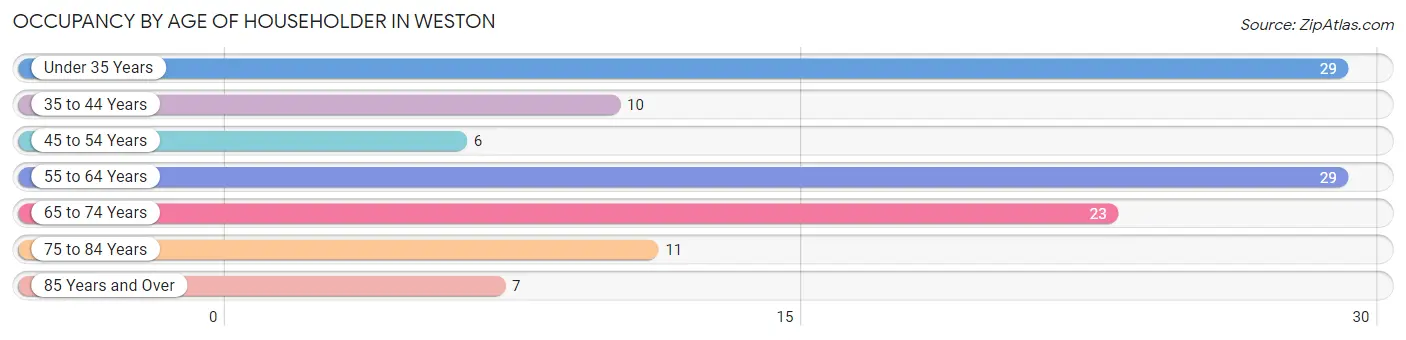
| Age Bracket | # Households | % Households |
| Under 35 Years | 29 | 25.2% |
| 35 to 44 Years | 10 | 8.7% |
| 45 to 54 Years | 6 | 5.2% |
| 55 to 64 Years | 29 | 25.2% |
| 65 to 74 Years | 23 | 20.0% |
| 75 to 84 Years | 11 | 9.6% |
| 85 Years and Over | 7 | 6.1% |
| Total | 115 | 100.0% |
Housing Finances in Weston
Median Income by Occupancy in Weston
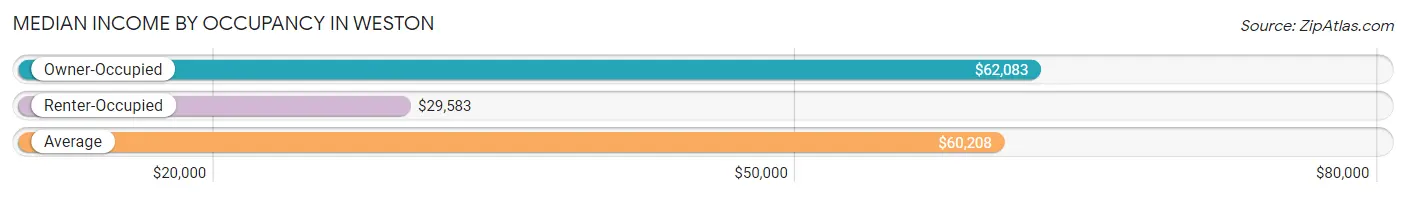
| Occupancy Type | # Households | Median Income |
| Owner-Occupied | 94 (81.7%) | $62,083 |
| Renter-Occupied | 21 (18.3%) | $29,583 |
| Average | 115 (100.0%) | $60,208 |
Occupancy by Householder Income Bracket in Weston
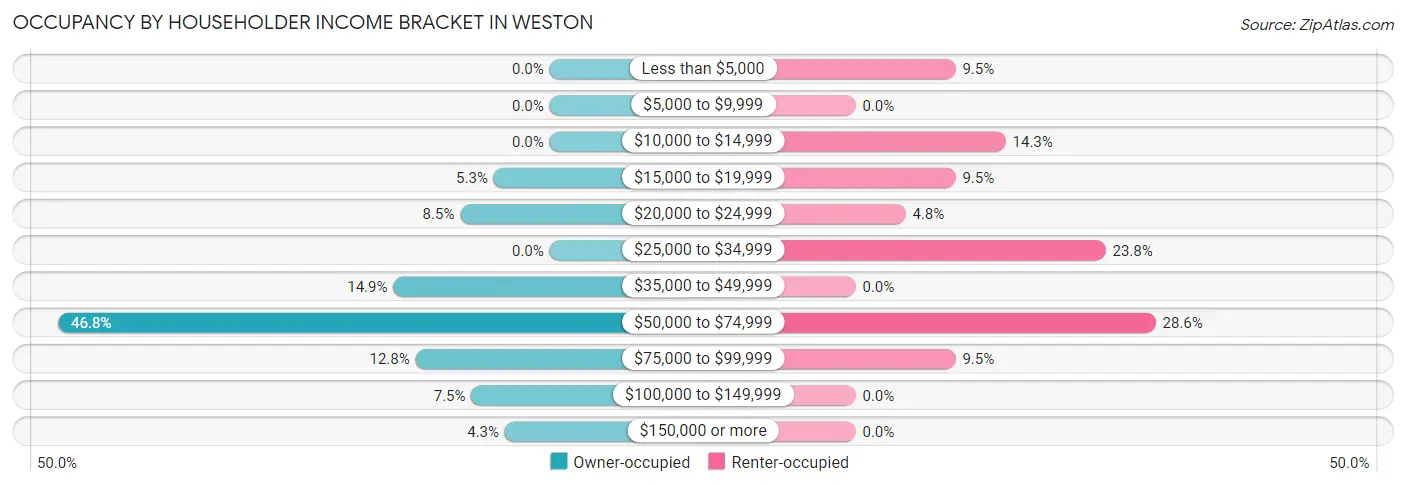
| Income Bracket | Owner-occupied | Renter-occupied |
| Less than $5,000 | 0 (0.0%) | 2 (9.5%) |
| $5,000 to $9,999 | 0 (0.0%) | 0 (0.0%) |
| $10,000 to $14,999 | 0 (0.0%) | 3 (14.3%) |
| $15,000 to $19,999 | 5 (5.3%) | 2 (9.5%) |
| $20,000 to $24,999 | 8 (8.5%) | 1 (4.8%) |
| $25,000 to $34,999 | 0 (0.0%) | 5 (23.8%) |
| $35,000 to $49,999 | 14 (14.9%) | 0 (0.0%) |
| $50,000 to $74,999 | 44 (46.8%) | 6 (28.6%) |
| $75,000 to $99,999 | 12 (12.8%) | 2 (9.5%) |
| $100,000 to $149,999 | 7 (7.4%) | 0 (0.0%) |
| $150,000 or more | 4 (4.3%) | 0 (0.0%) |
| Total | 94 (100.0%) | 21 (100.0%) |
Monthly Housing Cost Tiers in Weston
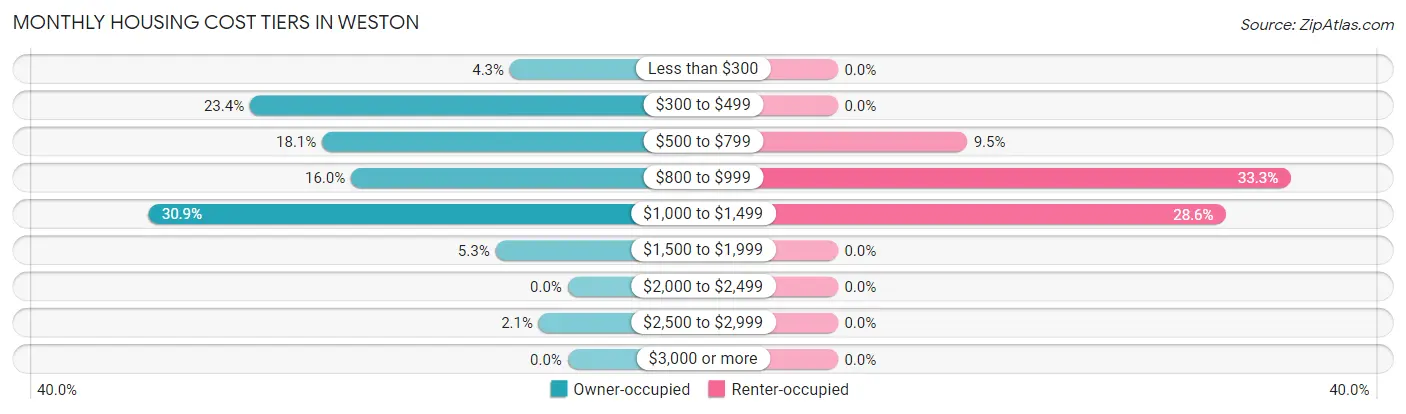
| Monthly Cost | Owner-occupied | Renter-occupied |
| Less than $300 | 4 (4.3%) | 0 (0.0%) |
| $300 to $499 | 22 (23.4%) | 0 (0.0%) |
| $500 to $799 | 17 (18.1%) | 2 (9.5%) |
| $800 to $999 | 15 (16.0%) | 7 (33.3%) |
| $1,000 to $1,499 | 29 (30.8%) | 6 (28.6%) |
| $1,500 to $1,999 | 5 (5.3%) | 0 (0.0%) |
| $2,000 to $2,499 | 0 (0.0%) | 0 (0.0%) |
| $2,500 to $2,999 | 2 (2.1%) | 0 (0.0%) |
| $3,000 or more | 0 (0.0%) | 0 (0.0%) |
| Total | 94 (100.0%) | 21 (100.0%) |
Physical Housing Characteristics in Weston
Housing Structures in Weston
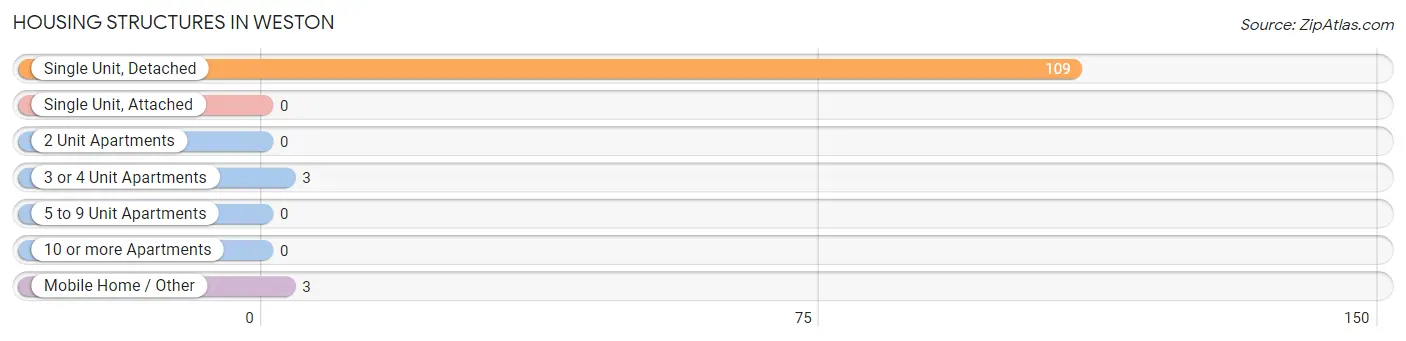
| Structure Type | # Housing Units | % Housing Units |
| Single Unit, Detached | 109 | 94.8% |
| Single Unit, Attached | 0 | 0.0% |
| 2 Unit Apartments | 0 | 0.0% |
| 3 or 4 Unit Apartments | 3 | 2.6% |
| 5 to 9 Unit Apartments | 0 | 0.0% |
| 10 or more Apartments | 0 | 0.0% |
| Mobile Home / Other | 3 | 2.6% |
| Total | 115 | 100.0% |
Housing Structures by Occupancy in Weston
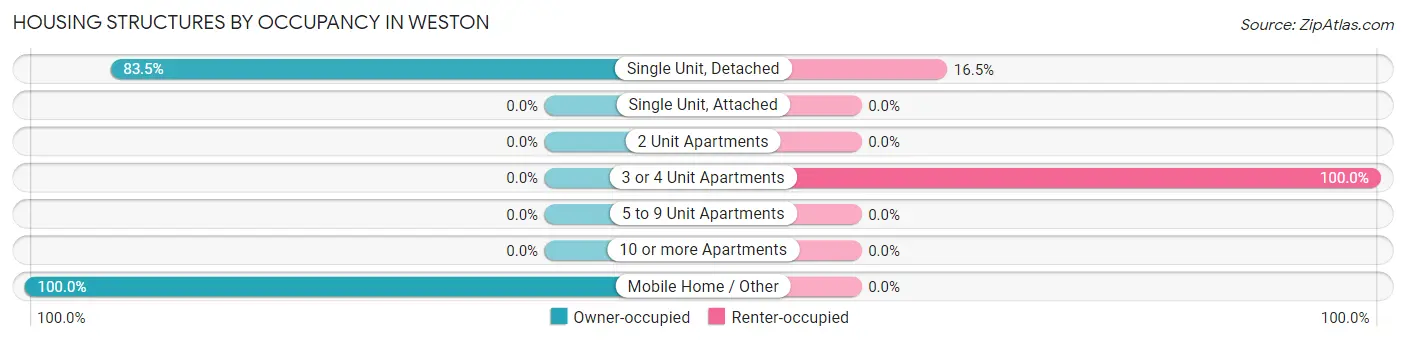
| Structure Type | Owner-occupied | Renter-occupied |
| Single Unit, Detached | 91 (83.5%) | 18 (16.5%) |
| Single Unit, Attached | 0 (0.0%) | 0 (0.0%) |
| 2 Unit Apartments | 0 (0.0%) | 0 (0.0%) |
| 3 or 4 Unit Apartments | 0 (0.0%) | 3 (100.0%) |
| 5 to 9 Unit Apartments | 0 (0.0%) | 0 (0.0%) |
| 10 or more Apartments | 0 (0.0%) | 0 (0.0%) |
| Mobile Home / Other | 3 (100.0%) | 0 (0.0%) |
| Total | 94 (81.7%) | 21 (18.3%) |
Housing Structures by Number of Rooms in Weston
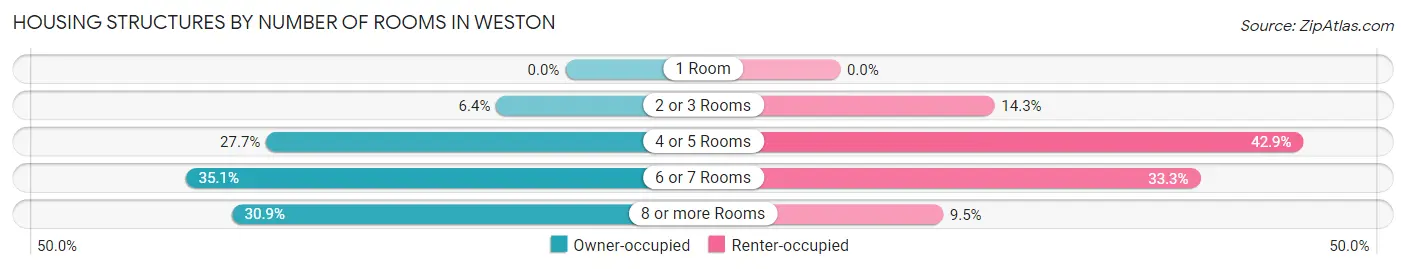
| Number of Rooms | Owner-occupied | Renter-occupied |
| 1 Room | 0 (0.0%) | 0 (0.0%) |
| 2 or 3 Rooms | 6 (6.4%) | 3 (14.3%) |
| 4 or 5 Rooms | 26 (27.7%) | 9 (42.9%) |
| 6 or 7 Rooms | 33 (35.1%) | 7 (33.3%) |
| 8 or more Rooms | 29 (30.8%) | 2 (9.5%) |
| Total | 94 (100.0%) | 21 (100.0%) |
Housing Structure by Heating Type in Weston
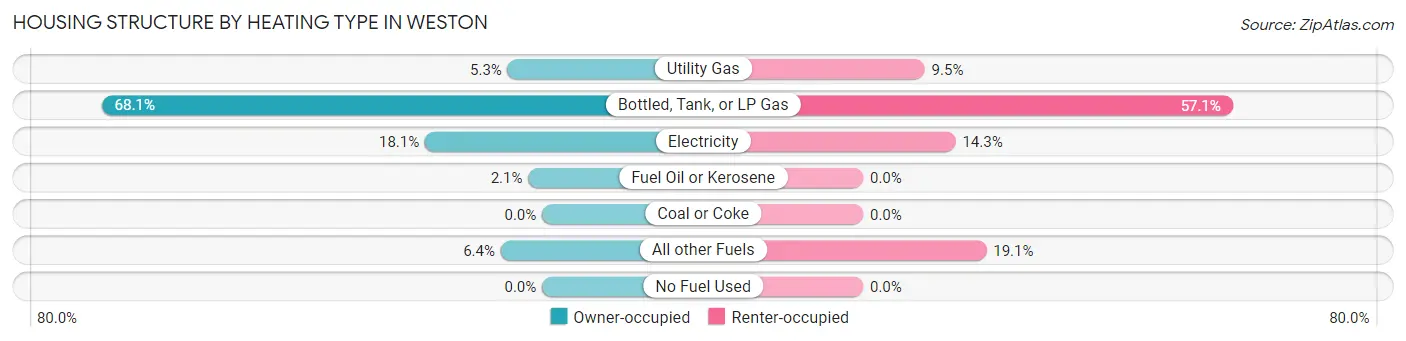
| Heating Type | Owner-occupied | Renter-occupied |
| Utility Gas | 5 (5.3%) | 2 (9.5%) |
| Bottled, Tank, or LP Gas | 64 (68.1%) | 12 (57.1%) |
| Electricity | 17 (18.1%) | 3 (14.3%) |
| Fuel Oil or Kerosene | 2 (2.1%) | 0 (0.0%) |
| Coal or Coke | 0 (0.0%) | 0 (0.0%) |
| All other Fuels | 6 (6.4%) | 4 (19.1%) |
| No Fuel Used | 0 (0.0%) | 0 (0.0%) |
| Total | 94 (100.0%) | 21 (100.0%) |
Household Vehicle Usage in Weston
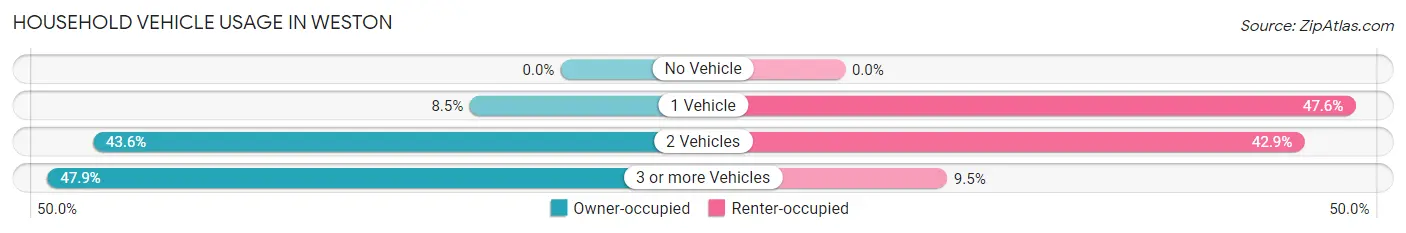
| Vehicles per Household | Owner-occupied | Renter-occupied |
| No Vehicle | 0 (0.0%) | 0 (0.0%) |
| 1 Vehicle | 8 (8.5%) | 10 (47.6%) |
| 2 Vehicles | 41 (43.6%) | 9 (42.9%) |
| 3 or more Vehicles | 45 (47.9%) | 2 (9.5%) |
| Total | 94 (100.0%) | 21 (100.0%) |
Real Estate & Mortgages in Weston
Real Estate and Mortgage Overview in Weston
| Characteristic | Without Mortgage | With Mortgage |
| Housing Units | 50 | 44 |
| Median Property Value | $96,700 | $110,000 |
| Median Household Income | $42,500 | $4 |
| Monthly Housing Costs | $467 | $0 |
| Real Estate Taxes | $1,347 | $0 |
Property Value by Mortgage Status in Weston
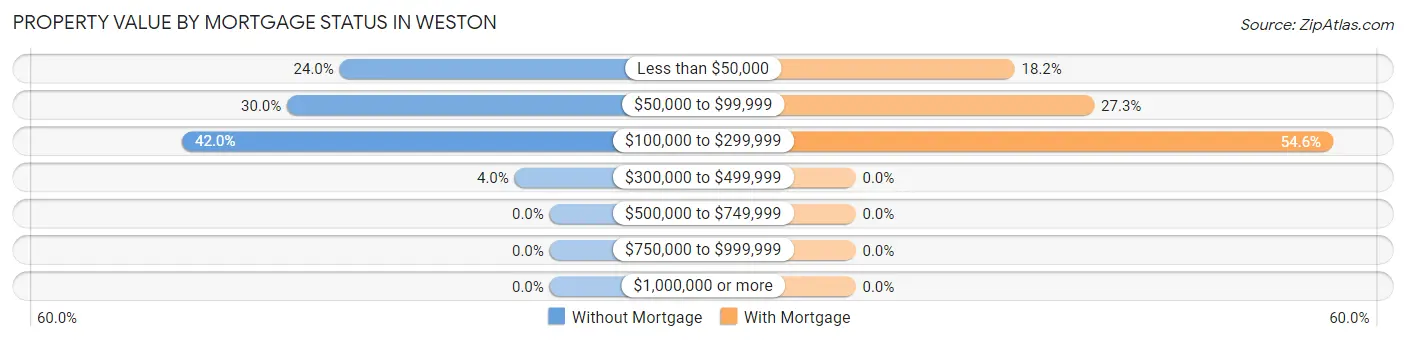
| Property Value | Without Mortgage | With Mortgage |
| Less than $50,000 | 12 (24.0%) | 8 (18.2%) |
| $50,000 to $99,999 | 15 (30.0%) | 12 (27.3%) |
| $100,000 to $299,999 | 21 (42.0%) | 24 (54.5%) |
| $300,000 to $499,999 | 2 (4.0%) | 0 (0.0%) |
| $500,000 to $749,999 | 0 (0.0%) | 0 (0.0%) |
| $750,000 to $999,999 | 0 (0.0%) | 0 (0.0%) |
| $1,000,000 or more | 0 (0.0%) | 0 (0.0%) |
| Total | 50 (100.0%) | 44 (100.0%) |
Household Income by Mortgage Status in Weston
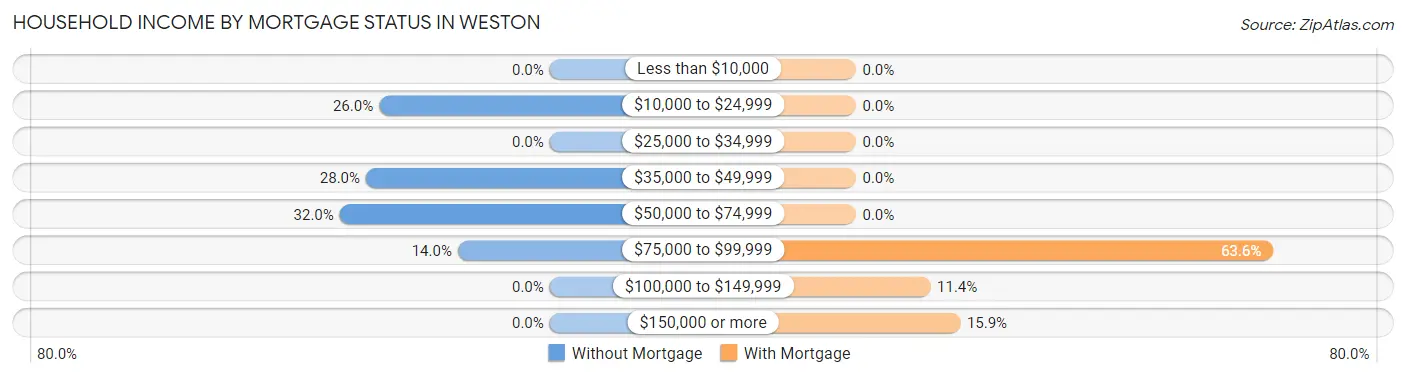
| Household Income | Without Mortgage | With Mortgage |
| Less than $10,000 | 0 (0.0%) | 0 (0.0%) |
| $10,000 to $24,999 | 13 (26.0%) | 0 (0.0%) |
| $25,000 to $34,999 | 0 (0.0%) | 0 (0.0%) |
| $35,000 to $49,999 | 14 (28.0%) | 0 (0.0%) |
| $50,000 to $74,999 | 16 (32.0%) | 0 (0.0%) |
| $75,000 to $99,999 | 7 (14.0%) | 28 (63.6%) |
| $100,000 to $149,999 | 0 (0.0%) | 5 (11.4%) |
| $150,000 or more | 0 (0.0%) | 7 (15.9%) |
| Total | 50 (100.0%) | 44 (100.0%) |
Property Value to Household Income Ratio in Weston
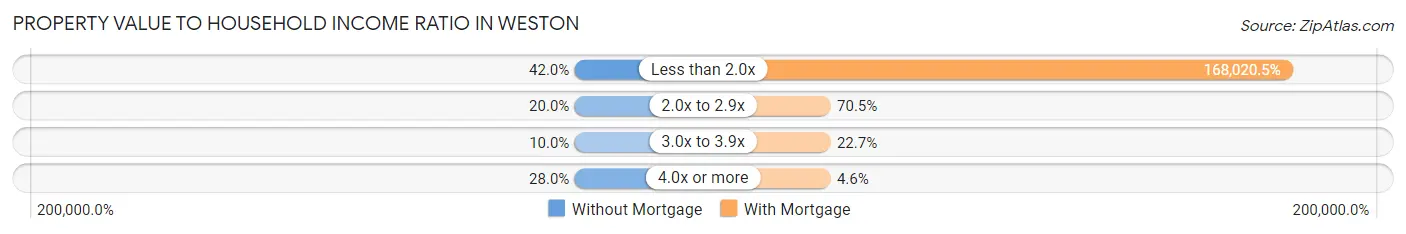
| Value-to-Income Ratio | Without Mortgage | With Mortgage |
| Less than 2.0x | 21 (42.0%) | 73,929 (168,020.5%) |
| 2.0x to 2.9x | 10 (20.0%) | 31 (70.5%) |
| 3.0x to 3.9x | 5 (10.0%) | 10 (22.7%) |
| 4.0x or more | 14 (28.0%) | 2 (4.5%) |
| Total | 50 (100.0%) | 44 (100.0%) |
Real Estate Taxes by Mortgage Status in Weston
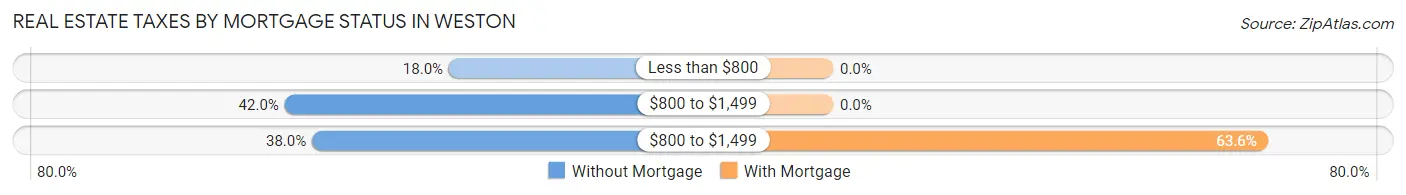
| Property Taxes | Without Mortgage | With Mortgage |
| Less than $800 | 9 (18.0%) | 0 (0.0%) |
| $800 to $1,499 | 21 (42.0%) | 0 (0.0%) |
| $800 to $1,499 | 19 (38.0%) | 28 (63.6%) |
| Total | 50 (100.0%) | 44 (100.0%) |
Health & Disability in Weston
Health Insurance Coverage by Age in Weston
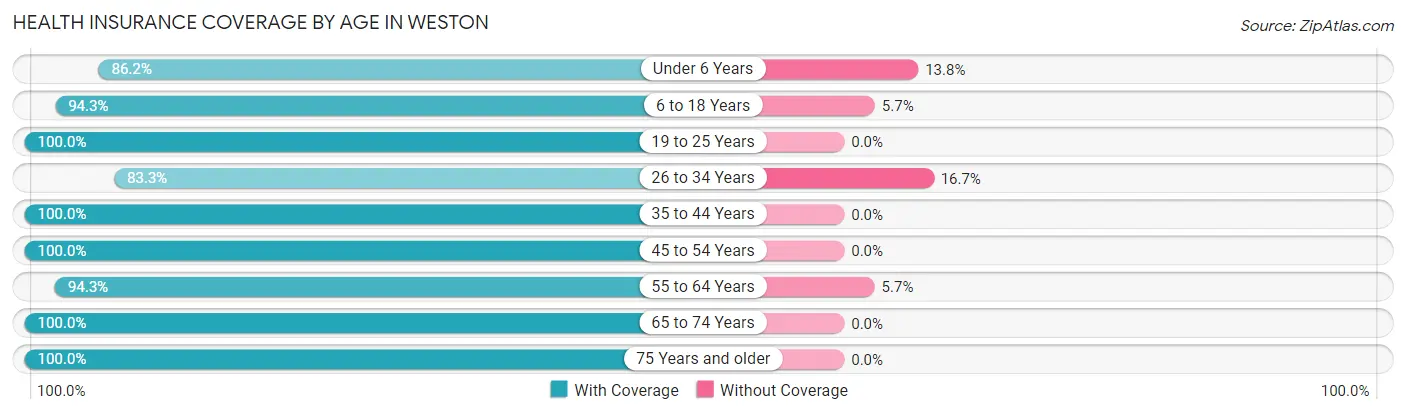
| Age Bracket | With Coverage | Without Coverage |
| Under 6 Years | 25 (86.2%) | 4 (13.8%) |
| 6 to 18 Years | 33 (94.3%) | 2 (5.7%) |
| 19 to 25 Years | 4 (100.0%) | 0 (0.0%) |
| 26 to 34 Years | 35 (83.3%) | 7 (16.7%) |
| 35 to 44 Years | 10 (100.0%) | 0 (0.0%) |
| 45 to 54 Years | 16 (100.0%) | 0 (0.0%) |
| 55 to 64 Years | 50 (94.3%) | 3 (5.7%) |
| 65 to 74 Years | 39 (100.0%) | 0 (0.0%) |
| 75 Years and older | 26 (100.0%) | 0 (0.0%) |
| Total | 238 (93.7%) | 16 (6.3%) |
Health Insurance Coverage by Citizenship Status in Weston
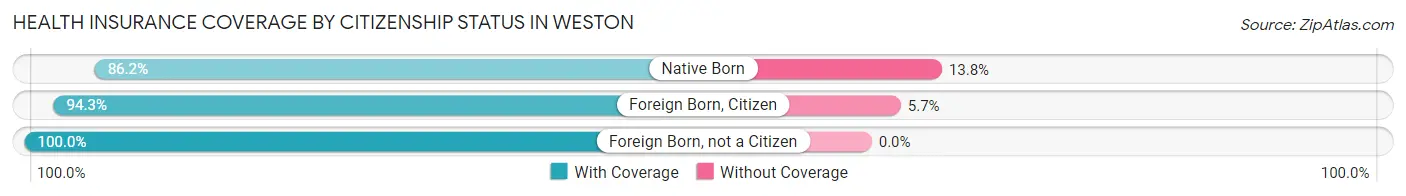
| Citizenship Status | With Coverage | Without Coverage |
| Native Born | 25 (86.2%) | 4 (13.8%) |
| Foreign Born, Citizen | 33 (94.3%) | 2 (5.7%) |
| Foreign Born, not a Citizen | 4 (100.0%) | 0 (0.0%) |
Health Insurance Coverage by Household Income in Weston
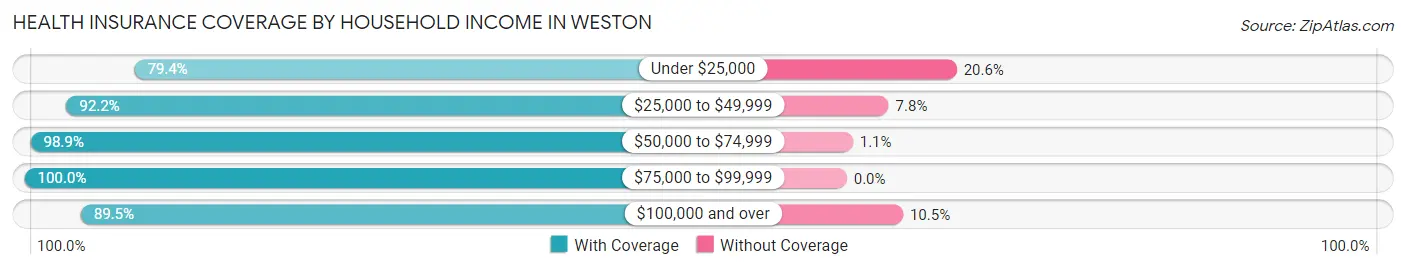
| Household Income | With Coverage | Without Coverage |
| Under $25,000 | 27 (79.4%) | 7 (20.6%) |
| $25,000 to $49,999 | 47 (92.2%) | 4 (7.8%) |
| $50,000 to $74,999 | 88 (98.9%) | 1 (1.1%) |
| $75,000 to $99,999 | 42 (100.0%) | 0 (0.0%) |
| $100,000 and over | 34 (89.5%) | 4 (10.5%) |
Public vs Private Health Insurance Coverage by Age in Weston
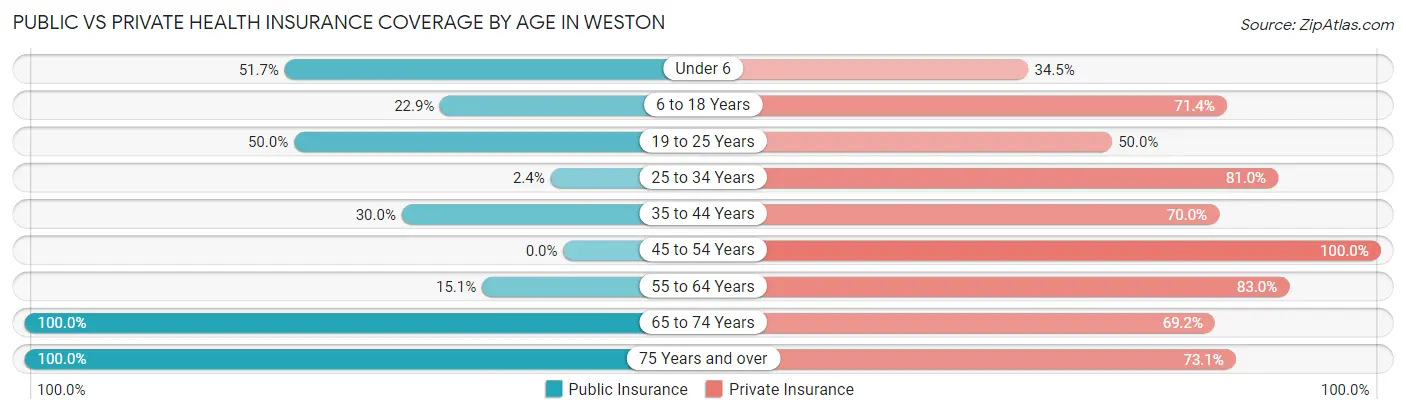
| Age Bracket | Public Insurance | Private Insurance |
| Under 6 | 15 (51.7%) | 10 (34.5%) |
| 6 to 18 Years | 8 (22.9%) | 25 (71.4%) |
| 19 to 25 Years | 2 (50.0%) | 2 (50.0%) |
| 25 to 34 Years | 1 (2.4%) | 34 (80.9%) |
| 35 to 44 Years | 3 (30.0%) | 7 (70.0%) |
| 45 to 54 Years | 0 (0.0%) | 16 (100.0%) |
| 55 to 64 Years | 8 (15.1%) | 44 (83.0%) |
| 65 to 74 Years | 39 (100.0%) | 27 (69.2%) |
| 75 Years and over | 26 (100.0%) | 19 (73.1%) |
| Total | 102 (40.2%) | 184 (72.4%) |
Disability Status by Sex by Age in Weston
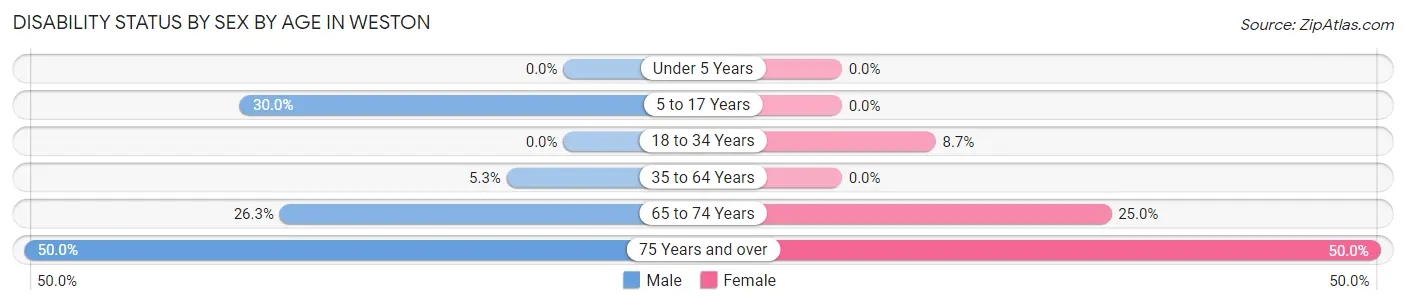
| Age Bracket | Male | Female |
| Under 5 Years | 0 (0.0%) | 0 (0.0%) |
| 5 to 17 Years | 6 (30.0%) | 0 (0.0%) |
| 18 to 34 Years | 0 (0.0%) | 2 (8.7%) |
| 35 to 64 Years | 2 (5.3%) | 0 (0.0%) |
| 65 to 74 Years | 5 (26.3%) | 5 (25.0%) |
| 75 Years and over | 4 (50.0%) | 9 (50.0%) |
Disability Class by Sex by Age in Weston
Disability Class: Hearing Difficulty
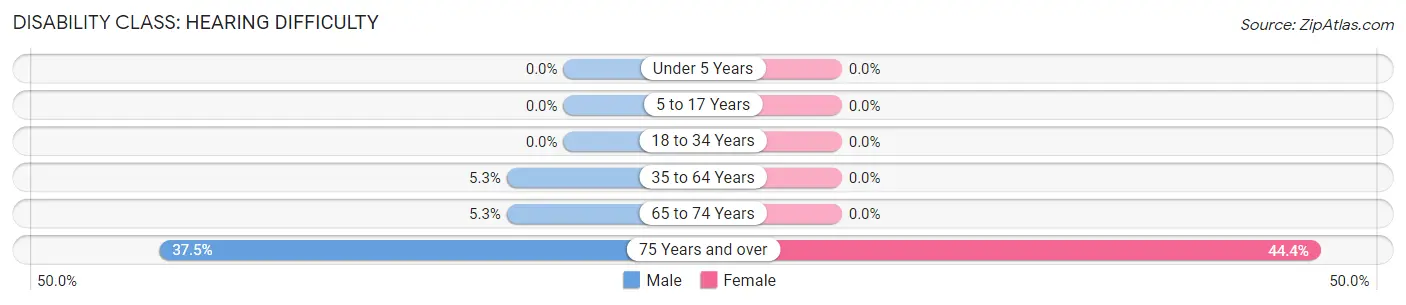
| Age Bracket | Male | Female |
| Under 5 Years | 0 (0.0%) | 0 (0.0%) |
| 5 to 17 Years | 0 (0.0%) | 0 (0.0%) |
| 18 to 34 Years | 0 (0.0%) | 0 (0.0%) |
| 35 to 64 Years | 2 (5.3%) | 0 (0.0%) |
| 65 to 74 Years | 1 (5.3%) | 0 (0.0%) |
| 75 Years and over | 3 (37.5%) | 8 (44.4%) |
Disability Class: Vision Difficulty
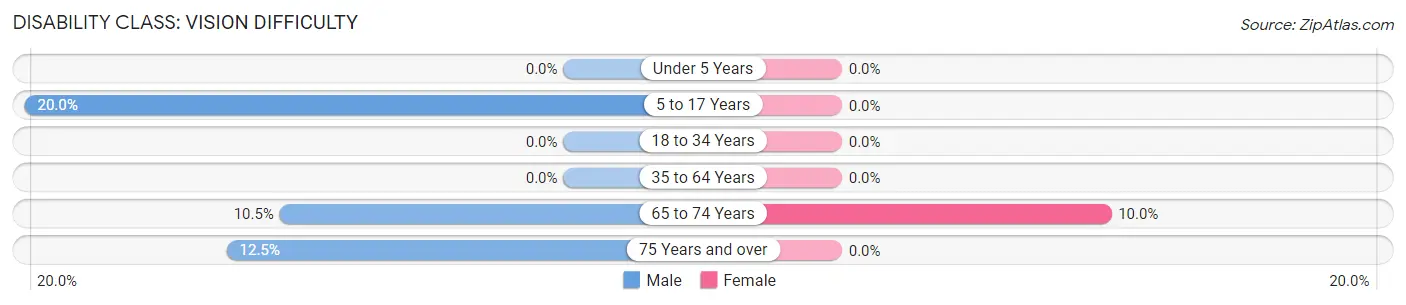
| Age Bracket | Male | Female |
| Under 5 Years | 0 (0.0%) | 0 (0.0%) |
| 5 to 17 Years | 4 (20.0%) | 0 (0.0%) |
| 18 to 34 Years | 0 (0.0%) | 0 (0.0%) |
| 35 to 64 Years | 0 (0.0%) | 0 (0.0%) |
| 65 to 74 Years | 2 (10.5%) | 2 (10.0%) |
| 75 Years and over | 1 (12.5%) | 0 (0.0%) |
Disability Class: Cognitive Difficulty
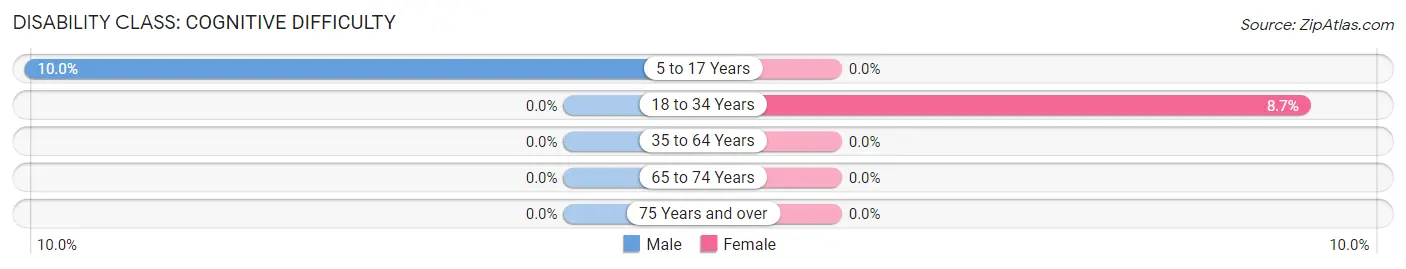
| Age Bracket | Male | Female |
| 5 to 17 Years | 2 (10.0%) | 0 (0.0%) |
| 18 to 34 Years | 0 (0.0%) | 2 (8.7%) |
| 35 to 64 Years | 0 (0.0%) | 0 (0.0%) |
| 65 to 74 Years | 0 (0.0%) | 0 (0.0%) |
| 75 Years and over | 0 (0.0%) | 0 (0.0%) |
Disability Class: Ambulatory Difficulty
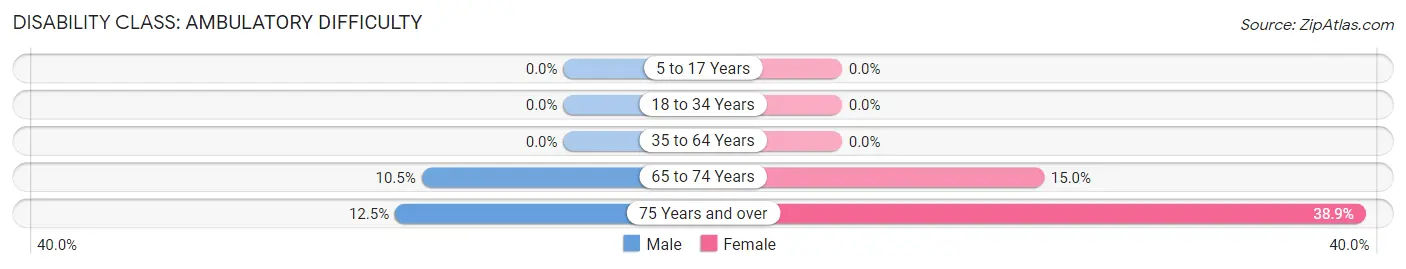
| Age Bracket | Male | Female |
| 5 to 17 Years | 0 (0.0%) | 0 (0.0%) |
| 18 to 34 Years | 0 (0.0%) | 0 (0.0%) |
| 35 to 64 Years | 0 (0.0%) | 0 (0.0%) |
| 65 to 74 Years | 2 (10.5%) | 3 (15.0%) |
| 75 Years and over | 1 (12.5%) | 7 (38.9%) |
Disability Class: Self-Care Difficulty
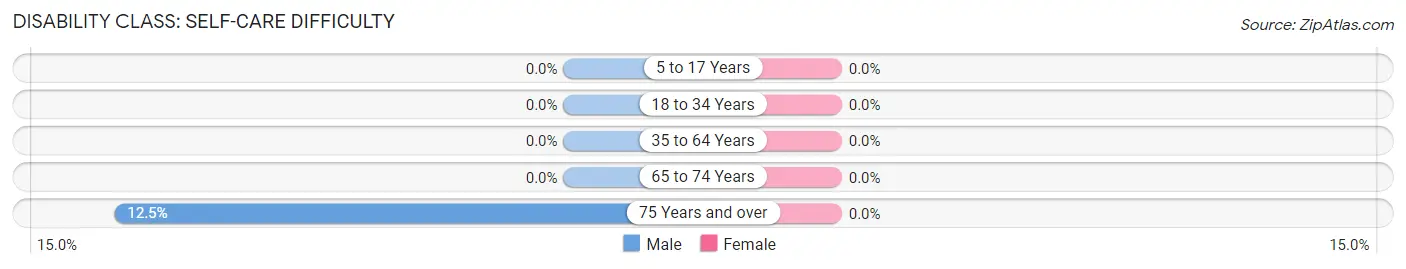
| Age Bracket | Male | Female |
| 5 to 17 Years | 0 (0.0%) | 0 (0.0%) |
| 18 to 34 Years | 0 (0.0%) | 0 (0.0%) |
| 35 to 64 Years | 0 (0.0%) | 0 (0.0%) |
| 65 to 74 Years | 0 (0.0%) | 0 (0.0%) |
| 75 Years and over | 1 (12.5%) | 0 (0.0%) |
Technology Access in Weston
Computing Device Access in Weston
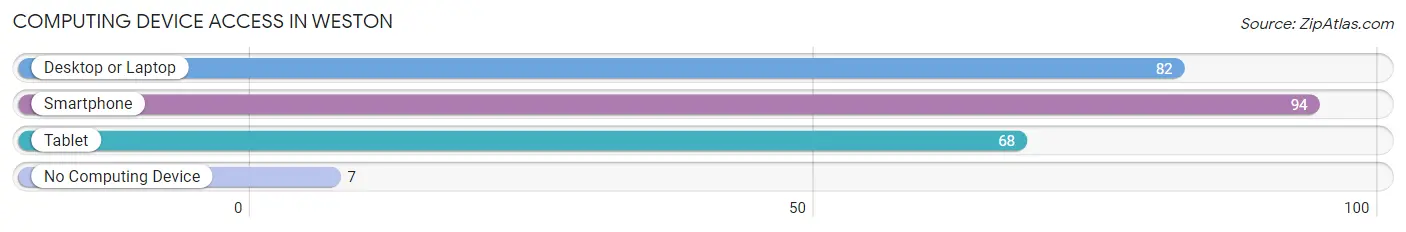
| Device Type | # Households | % Households |
| Desktop or Laptop | 82 | 71.3% |
| Smartphone | 94 | 81.7% |
| Tablet | 68 | 59.1% |
| No Computing Device | 7 | 6.1% |
| Total | 115 | 100.0% |
Internet Access in Weston
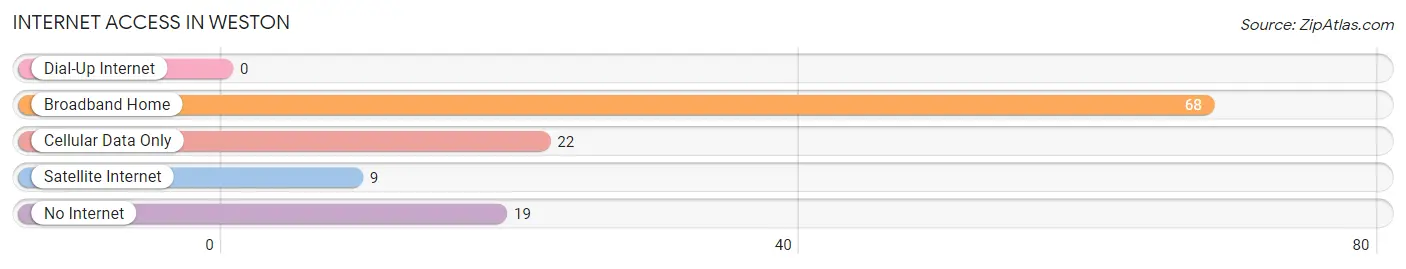
| Internet Type | # Households | % Households |
| Dial-Up Internet | 0 | 0.0% |
| Broadband Home | 68 | 59.1% |
| Cellular Data Only | 22 | 19.1% |
| Satellite Internet | 9 | 7.8% |
| No Internet | 19 | 16.5% |
| Total | 115 | 100.0% |
Weston Summary
Weston, Nebraska is a small town located in Saunders County, Nebraska. It is situated on the banks of the Platte River, approximately 30 miles west of Omaha. The town was founded in 1871 and has a population of approximately 1,000 people.
History
Weston was founded in 1871 by a group of settlers from Weston, Connecticut. The settlers were looking for a place to settle and start a new life. The town was named after the Connecticut town and was originally known as Weston Station. The town was officially incorporated in 1887.
The town was originally a farming community, but in the early 1900s, the railroad came to town and the economy shifted to a more industrial focus. The railroad brought jobs and new businesses to the area, and Weston quickly became a thriving community.
In the 1950s, Weston began to experience a population decline as people moved away to larger cities. However, in the late 1970s, the town began to experience a resurgence as people began to move back to the area. This trend has continued and Weston is now a thriving small town.
Geography
Weston is located in Saunders County, Nebraska. It is situated on the banks of the Platte River, approximately 30 miles west of Omaha. The town is located in the Great Plains region of the United States and has a humid continental climate. The average temperature in the summer is around 80 degrees Fahrenheit and in the winter it is around 20 degrees Fahrenheit.
The town is surrounded by rolling hills and farmland. The Platte River runs through the town and provides a scenic backdrop. The town is also home to several parks and recreational areas, including the Weston City Park and the Weston Nature Preserve.
Economy
Weston’s economy is largely based on agriculture and manufacturing. The town is home to several large agricultural companies, including Cargill, Inc., which is one of the largest agricultural companies in the world. The town is also home to several manufacturing companies, including a plastics manufacturer and a metal fabrication company.
The town is also home to several small businesses, including restaurants, retail stores, and service providers. The town is also home to several banks and financial institutions.
Demographics
As of the 2010 census, the population of Weston was 1,000 people. The town is predominantly white, with approximately 95% of the population being white. The town is also home to a small Hispanic population, with approximately 5% of the population being Hispanic.
The median household income in Weston is approximately $50,000, which is slightly lower than the national average. The town has a low unemployment rate, with only 3.5% of the population being unemployed.
Weston is a small town with a rich history and a bright future. The town is home to a diverse population and a thriving economy. The town is a great place to live and work, and it is a great place to raise a family.
Common Questions
What is Per Capita Income in Weston?
Per Capita income in Weston is $28,393.
What is the Median Family Income in Weston?
Median Family Income in Weston is $65,000.
What is the Median Household income in Weston?
Median Household Income in Weston is $60,208.
What is Income or Wage Gap in Weston?
Income or Wage Gap in Weston is 13.4%.
Women in Weston earn 86.6 cents for every dollar earned by a man.
What is Inequality or Gini Index in Weston?
Inequality or Gini Index in Weston is 0.34.
What is the Total Population of Weston?
Total Population of Weston is 254.
What is the Total Male Population of Weston?
Total Male Population of Weston is 136.
What is the Total Female Population of Weston?
Total Female Population of Weston is 118.
What is the Ratio of Males per 100 Females in Weston?
There are 115.25 Males per 100 Females in Weston.
What is the Ratio of Females per 100 Males in Weston?
There are 86.76 Females per 100 Males in Weston.
What is the Median Population Age in Weston?
Median Population Age in Weston is 50.5 Years.
What is the Average Family Size in Weston
Average Family Size in Weston is 2.5 People.
What is the Average Household Size in Weston
Average Household Size in Weston is 2.2 People.
How Large is the Labor Force in Weston?
There are 127 People in the Labor Forcein in Weston.
What is the Percentage of People in the Labor Force in Weston?
61.4% of People are in the Labor Force in Weston.
What is the Unemployment Rate in Weston?
Unemployment Rate in Weston is 3.1%.