Ord, NE Map & Demographics
Ord Map
Ord Overview
$30,604
PER CAPITA INCOME
$80,568
AVG FAMILY INCOME
$56,108
AVG HOUSEHOLD INCOME
20.7%
WAGE / INCOME GAP [ % ]
79.3¢/ $1
WAGE / INCOME GAP [ $ ]
0.38
INEQUALITY / GINI INDEX
2,121
TOTAL POPULATION
1,100
MALE POPULATION
1,021
FEMALE POPULATION
107.74
MALES / 100 FEMALES
92.82
FEMALES / 100 MALES
42.5
MEDIAN AGE
2.7
AVG FAMILY SIZE
2.1
AVG HOUSEHOLD SIZE
1,052
LABOR FORCE [ PEOPLE ]
62.0%
PERCENT IN LABOR FORCE
1.0%
UNEMPLOYMENT RATE
Ord Zip Codes
Ord Area Codes
Income in Ord
Income Overview in Ord
Per Capita Income in Ord is $30,604, while median incomes of families and households are $80,568 and $56,108 respectively.
| Characteristic | Number | Measure |
| Per Capita Income | 2,121 | $30,604 |
| Median Family Income | 593 | $80,568 |
| Mean Family Income | 593 | $88,210 |
| Median Household Income | 967 | $56,108 |
| Mean Household Income | 967 | $68,968 |
| Income Deficit | 593 | $0 |
| Wage / Income Gap (%) | 2,121 | 20.72% |
| Wage / Income Gap ($) | 2,121 | 79.28¢ per $1 |
| Gini / Inequality Index | 2,121 | 0.38 |
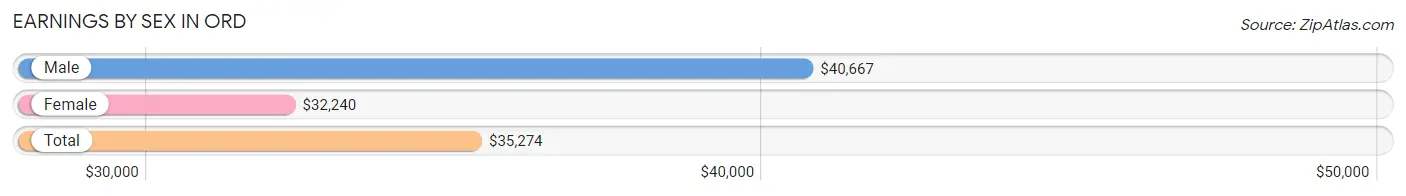
Earnings by Sex in Ord
Average Earnings in Ord are $35,274, $40,667 for men and $32,240 for women, a difference of 20.7%.
| Sex | Number | Average Earnings |
| Male | 590 (52.3%) | $40,667 |
| Female | 537 (47.6%) | $32,240 |
| Total | 1,127 (100.0%) | $35,274 |
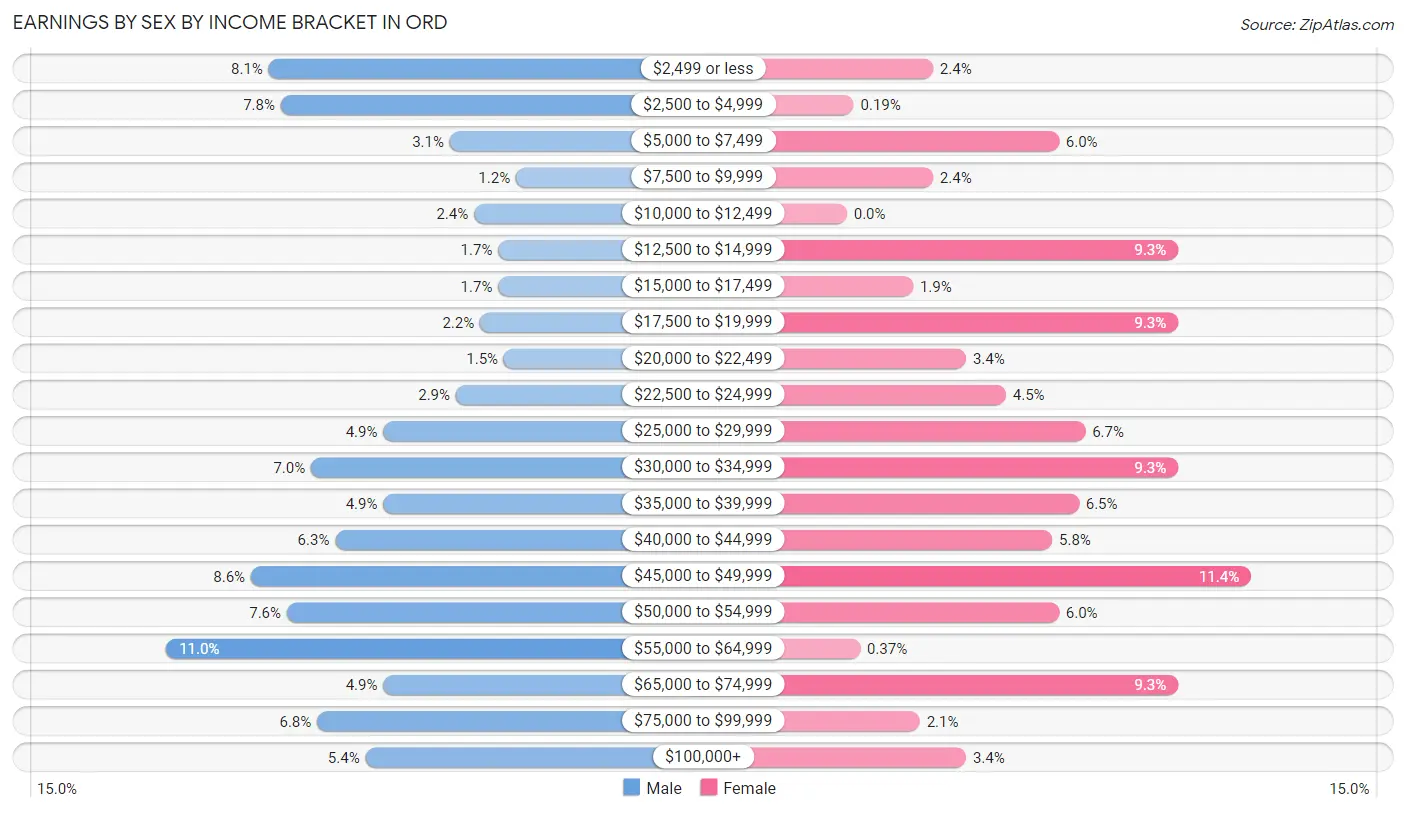
Earnings by Sex by Income Bracket in Ord
The most common earnings brackets in Ord are $55,000 to $64,999 for men (65 | 11.0%) and $45,000 to $49,999 for women (61 | 11.4%).
| Income | Male | Female |
| $2,499 or less | 48 (8.1%) | 13 (2.4%) |
| $2,500 to $4,999 | 46 (7.8%) | 1 (0.2%) |
| $5,000 to $7,499 | 18 (3.0%) | 32 (6.0%) |
| $7,500 to $9,999 | 7 (1.2%) | 13 (2.4%) |
| $10,000 to $12,499 | 14 (2.4%) | 0 (0.0%) |
| $12,500 to $14,999 | 10 (1.7%) | 50 (9.3%) |
| $15,000 to $17,499 | 10 (1.7%) | 10 (1.9%) |
| $17,500 to $19,999 | 13 (2.2%) | 50 (9.3%) |
| $20,000 to $22,499 | 9 (1.5%) | 18 (3.4%) |
| $22,500 to $24,999 | 17 (2.9%) | 24 (4.5%) |
| $25,000 to $29,999 | 29 (4.9%) | 36 (6.7%) |
| $30,000 to $34,999 | 41 (7.0%) | 50 (9.3%) |
| $35,000 to $39,999 | 29 (4.9%) | 35 (6.5%) |
| $40,000 to $44,999 | 37 (6.3%) | 31 (5.8%) |
| $45,000 to $49,999 | 51 (8.6%) | 61 (11.4%) |
| $50,000 to $54,999 | 45 (7.6%) | 32 (6.0%) |
| $55,000 to $64,999 | 65 (11.0%) | 2 (0.4%) |
| $65,000 to $74,999 | 29 (4.9%) | 50 (9.3%) |
| $75,000 to $99,999 | 40 (6.8%) | 11 (2.1%) |
| $100,000+ | 32 (5.4%) | 18 (3.4%) |
| Total | 590 (100.0%) | 537 (100.0%) |
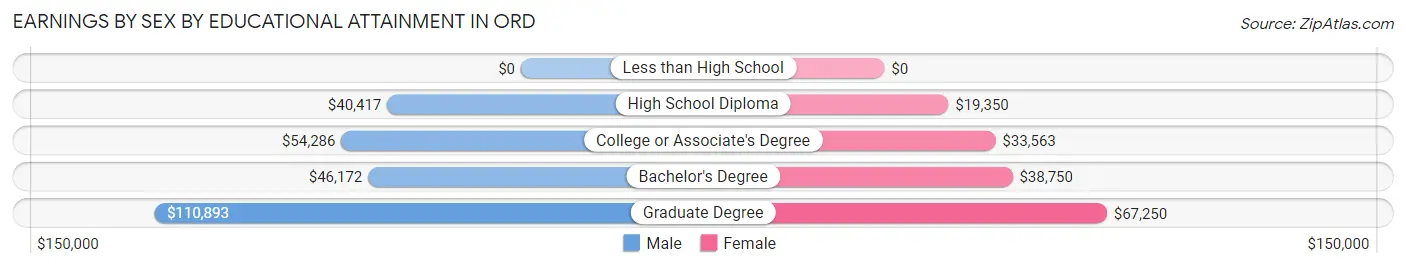
Earnings by Sex by Educational Attainment in Ord
Average earnings in Ord are $45,221 for men and $34,038 for women, a difference of 24.7%. Men with an educational attainment of graduate degree enjoy the highest average annual earnings of $110,893, while those with high school diploma education earn the least with $40,417. Women with an educational attainment of graduate degree earn the most with the average annual earnings of $67,250, while those with high school diploma education have the smallest earnings of $19,350.
| Educational Attainment | Male Income | Female Income |
| Less than High School | - | - |
| High School Diploma | $40,417 | $19,350 |
| College or Associate's Degree | $54,286 | $33,563 |
| Bachelor's Degree | $46,172 | $38,750 |
| Graduate Degree | $110,893 | $67,250 |
| Total | $45,221 | $34,038 |
Family Income in Ord
Family Income Brackets in Ord
According to the Ord family income data, there are 151 families falling into the $50,000 to $74,999 income range, which is the most common income bracket and makes up 25.5% of all families.
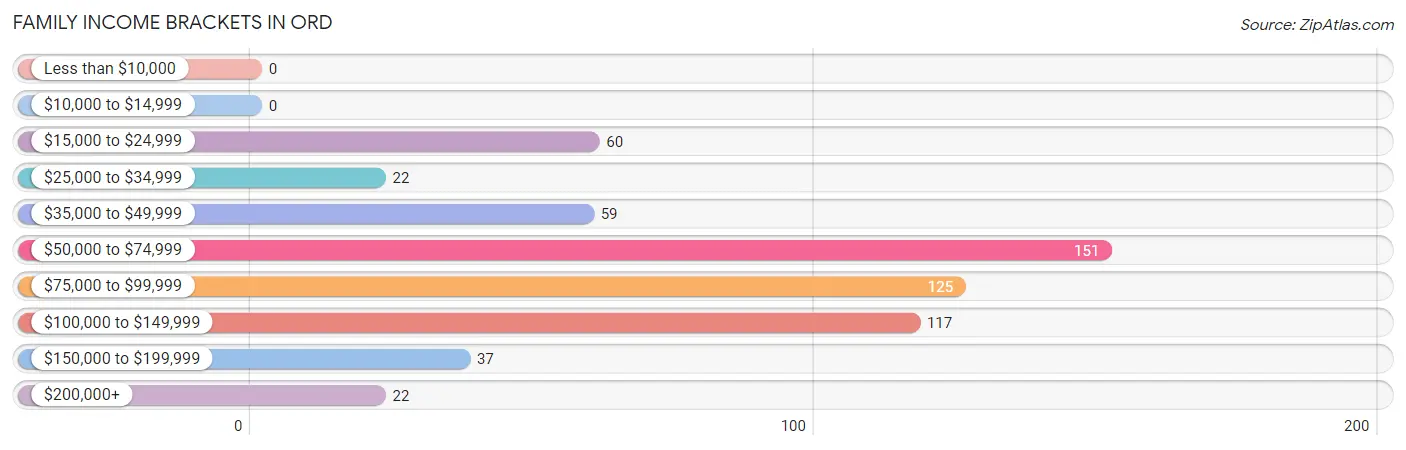
| Income Bracket | # Families | % Families |
| Less than $10,000 | 0 | 0.0% |
| $10,000 to $14,999 | 0 | 0.0% |
| $15,000 to $24,999 | 60 | 10.1% |
| $25,000 to $34,999 | 22 | 3.7% |
| $35,000 to $49,999 | 59 | 9.9% |
| $50,000 to $74,999 | 151 | 25.5% |
| $75,000 to $99,999 | 125 | 21.1% |
| $100,000 to $149,999 | 117 | 19.7% |
| $150,000 to $199,999 | 37 | 6.2% |
| $200,000+ | 22 | 3.7% |
Family Income by Famaliy Size in Ord
5-person families (28 | 4.7%) account for the highest median family income in Ord with $146,786 per family, while 2-person families (341 | 57.5%) have the highest median income of $34,899 per family member.
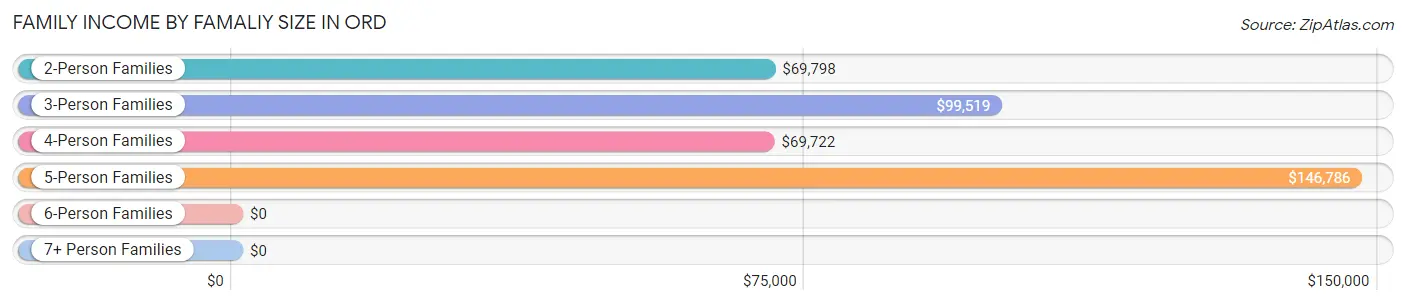
| Income Bracket | # Families | Median Income |
| 2-Person Families | 341 (57.5%) | $69,798 |
| 3-Person Families | 145 (24.4%) | $99,519 |
| 4-Person Families | 66 (11.1%) | $69,722 |
| 5-Person Families | 28 (4.7%) | $146,786 |
| 6-Person Families | 7 (1.2%) | $0 |
| 7+ Person Families | 6 (1.0%) | $0 |
| Total | 593 (100.0%) | $80,568 |
Family Income by Number of Earners in Ord
The median family income in Ord is $80,568, with families comprising 3+ earners (61) having the highest median family income of $106,161, while families with no earners (95) have the lowest median family income of $39,250, accounting for 10.3% and 16.0% of families, respectively.
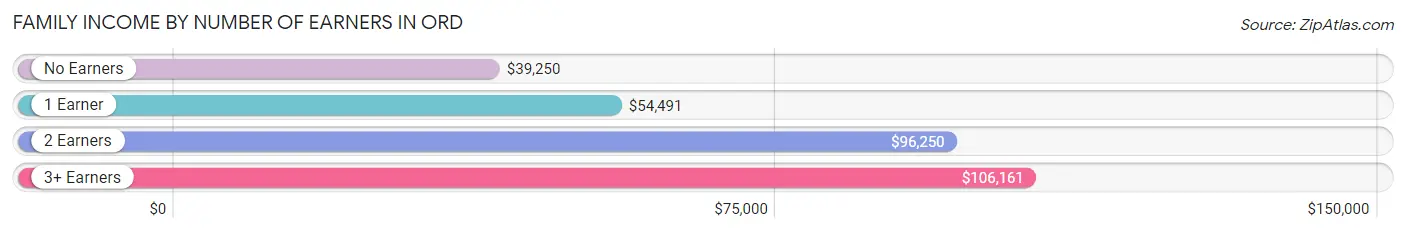
| Number of Earners | # Families | Median Income |
| No Earners | 95 (16.0%) | $39,250 |
| 1 Earner | 181 (30.5%) | $54,491 |
| 2 Earners | 256 (43.2%) | $96,250 |
| 3+ Earners | 61 (10.3%) | $106,161 |
| Total | 593 (100.0%) | $80,568 |
Household Income in Ord
Household Income Brackets in Ord
With 255 households falling in the category, the $50,000 to $74,999 income range is the most frequent in Ord, accounting for 26.4% of all households. In contrast, only 22 households (2.3%) fall into the $200,000+ income bracket, making it the least populous group.
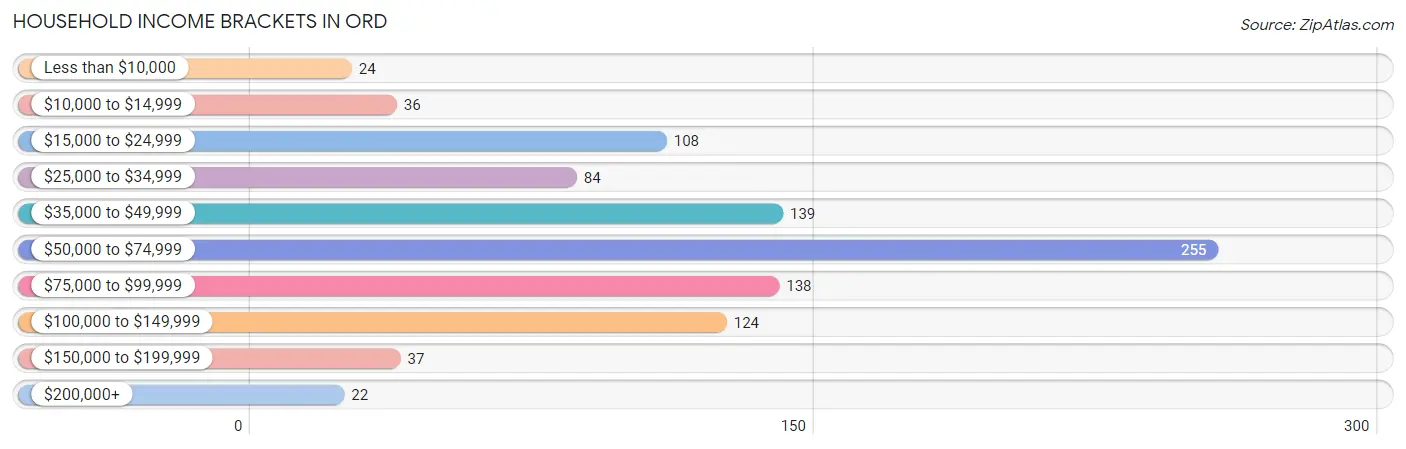
| Income Bracket | # Households | % Households |
| Less than $10,000 | 24 | 2.5% |
| $10,000 to $14,999 | 36 | 3.7% |
| $15,000 to $24,999 | 108 | 11.2% |
| $25,000 to $34,999 | 84 | 8.7% |
| $35,000 to $49,999 | 139 | 14.4% |
| $50,000 to $74,999 | 255 | 26.4% |
| $75,000 to $99,999 | 138 | 14.3% |
| $100,000 to $149,999 | 124 | 12.8% |
| $150,000 to $199,999 | 37 | 3.8% |
| $200,000+ | 22 | 2.3% |
Household Income by Householder Age in Ord
The median household income in Ord is $56,108, with the highest median household income of $67,700 found in the 45 to 64 years age bracket for the primary householder. A total of 346 households (35.8%) fall into this category. Meanwhile, the 15 to 24 years age bracket for the primary householder has the lowest median household income of $28,250, with 51 households (5.3%) in this group.
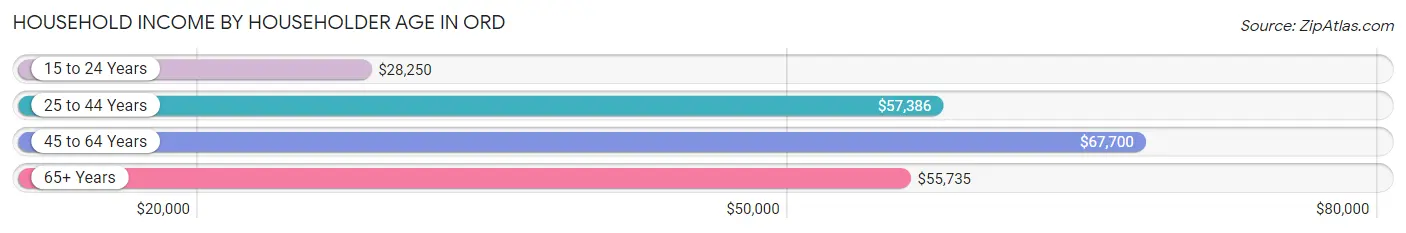
| Income Bracket | # Households | Median Income |
| 15 to 24 Years | 51 (5.3%) | $28,250 |
| 25 to 44 Years | 244 (25.2%) | $57,386 |
| 45 to 64 Years | 346 (35.8%) | $67,700 |
| 65+ Years | 326 (33.7%) | $55,735 |
| Total | 967 (100.0%) | $56,108 |
Poverty in Ord
Income Below Poverty by Sex and Age in Ord
With 13.2% poverty level for males and 9.8% for females among the residents of Ord, under 5 year old males and 18 to 24 year old females are the most vulnerable to poverty, with 38 males (55.9%) and 12 females (42.9%) in their respective age groups living below the poverty level.
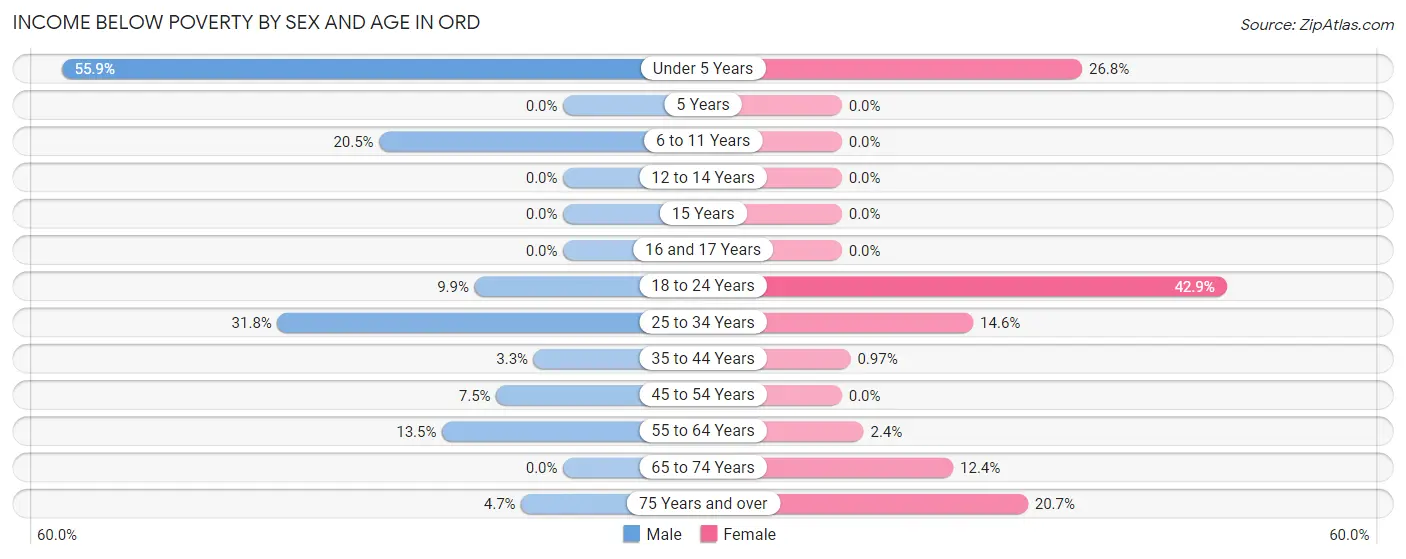
| Age Bracket | Male | Female |
| Under 5 Years | 38 (55.9%) | 19 (26.8%) |
| 5 Years | 0 (0.0%) | 0 (0.0%) |
| 6 to 11 Years | 17 (20.5%) | 0 (0.0%) |
| 12 to 14 Years | 0 (0.0%) | 0 (0.0%) |
| 15 Years | 0 (0.0%) | 0 (0.0%) |
| 16 and 17 Years | 0 (0.0%) | 0 (0.0%) |
| 18 to 24 Years | 7 (9.9%) | 12 (42.9%) |
| 25 to 34 Years | 42 (31.8%) | 18 (14.6%) |
| 35 to 44 Years | 4 (3.3%) | 1 (1.0%) |
| 45 to 54 Years | 7 (7.4%) | 0 (0.0%) |
| 55 to 64 Years | 19 (13.5%) | 4 (2.4%) |
| 65 to 74 Years | 0 (0.0%) | 15 (12.4%) |
| 75 Years and over | 5 (4.7%) | 29 (20.7%) |
| Total | 139 (13.2%) | 98 (9.8%) |
Income Above Poverty by Sex and Age in Ord
According to the poverty statistics in Ord, males aged 12 to 14 years and females aged 5 years are the age groups that are most secure financially, with 100.0% of males and 100.0% of females in these age groups living above the poverty line.
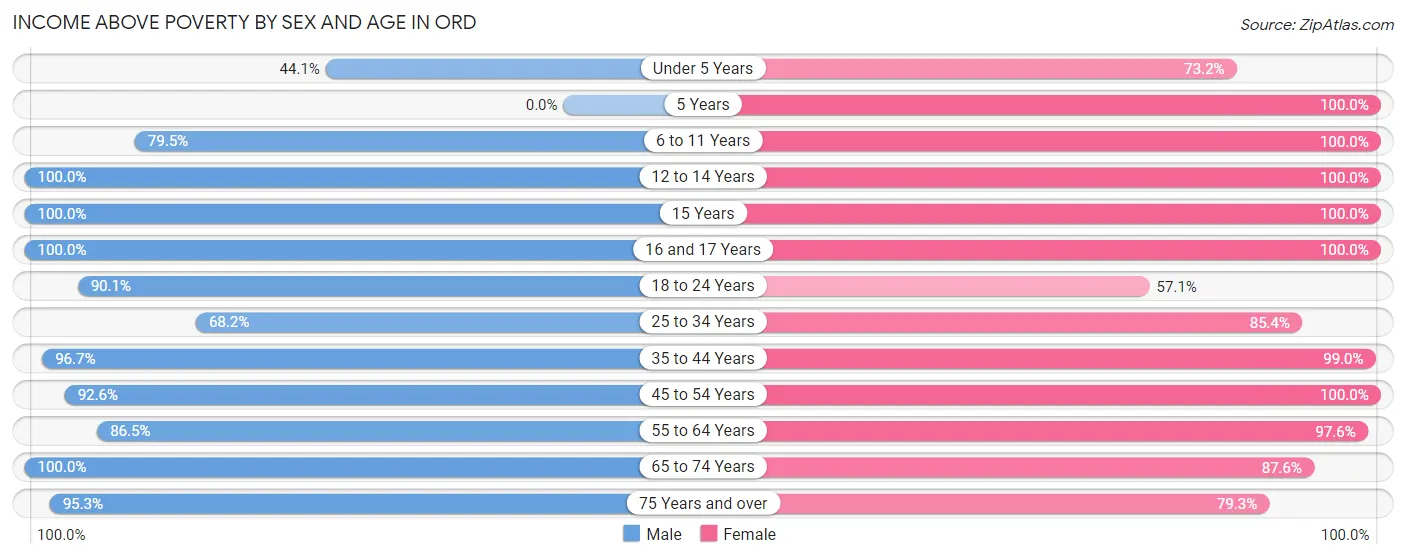
| Age Bracket | Male | Female |
| Under 5 Years | 30 (44.1%) | 52 (73.2%) |
| 5 Years | 0 (0.0%) | 26 (100.0%) |
| 6 to 11 Years | 66 (79.5%) | 63 (100.0%) |
| 12 to 14 Years | 63 (100.0%) | 32 (100.0%) |
| 15 Years | 6 (100.0%) | 8 (100.0%) |
| 16 and 17 Years | 32 (100.0%) | 18 (100.0%) |
| 18 to 24 Years | 64 (90.1%) | 16 (57.1%) |
| 25 to 34 Years | 90 (68.2%) | 105 (85.4%) |
| 35 to 44 Years | 118 (96.7%) | 102 (99.0%) |
| 45 to 54 Years | 87 (92.5%) | 104 (100.0%) |
| 55 to 64 Years | 122 (86.5%) | 161 (97.6%) |
| 65 to 74 Years | 136 (100.0%) | 106 (87.6%) |
| 75 Years and over | 102 (95.3%) | 111 (79.3%) |
| Total | 916 (86.8%) | 904 (90.2%) |
Income Below Poverty Among Married-Couple Families in Ord
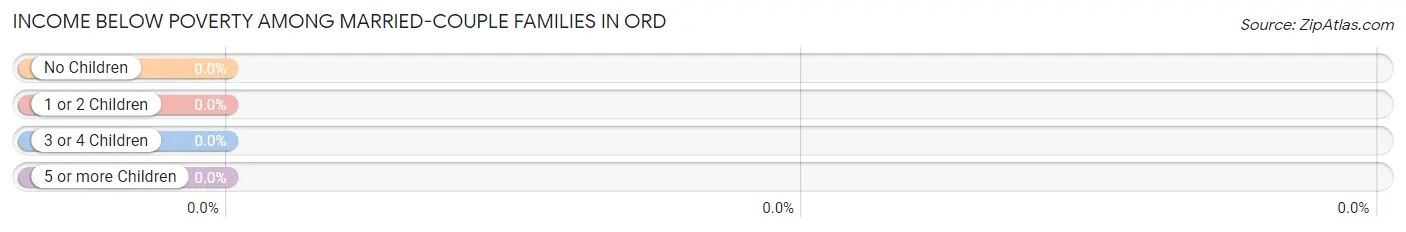
| Children | Above Poverty | Below Poverty |
| No Children | 324 (100.0%) | 0 (0.0%) |
| 1 or 2 Children | 104 (100.0%) | 0 (0.0%) |
| 3 or 4 Children | 35 (100.0%) | 0 (0.0%) |
| 5 or more Children | 6 (100.0%) | 0 (0.0%) |
| Total | 469 (100.0%) | 0 (0.0%) |
Income Below Poverty Among Single-Parent Households in Ord
According to the poverty data in Ord, 9.1% or 4 single-father households and 63.7% or 51 single-mother households are living below the poverty line. Among single-father households, those with 3 or 4 children have the highest poverty rate, with 4 households (100.0%) experiencing poverty. Likewise, among single-mother households, those with 1 or 2 children have the highest poverty rate, with 51 households (70.8%) falling below the poverty line.
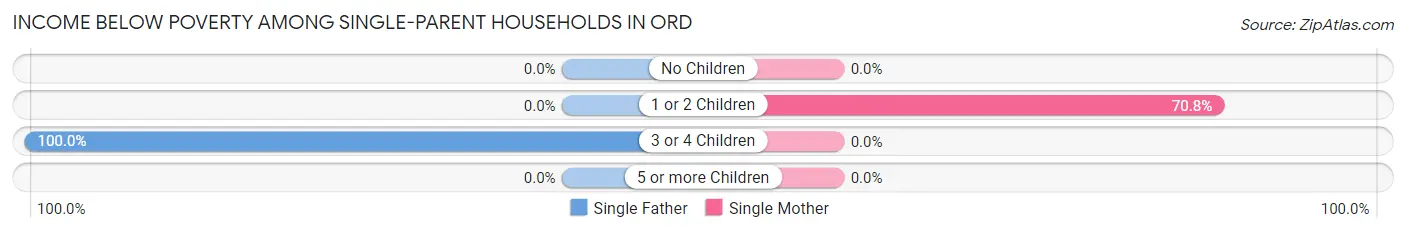
| Children | Single Father | Single Mother |
| No Children | 0 (0.0%) | 0 (0.0%) |
| 1 or 2 Children | 0 (0.0%) | 51 (70.8%) |
| 3 or 4 Children | 4 (100.0%) | 0 (0.0%) |
| 5 or more Children | 0 (0.0%) | 0 (0.0%) |
| Total | 4 (9.1%) | 51 (63.7%) |
Income Below Poverty Among Married-Couple vs Single-Parent Households in Ord
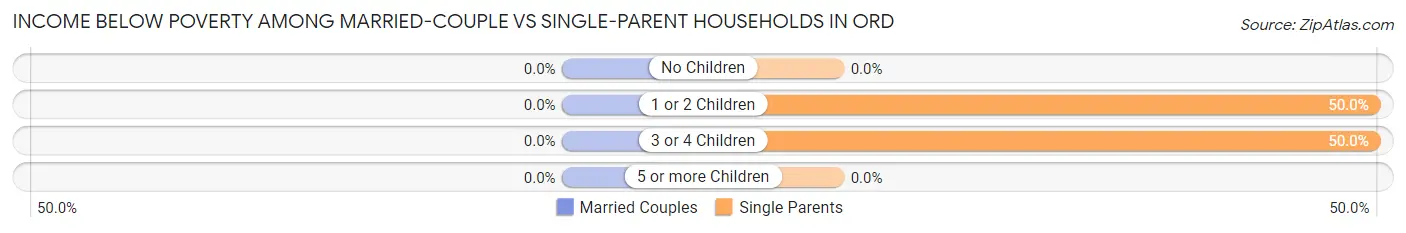
| Children | Married-Couple Families | Single-Parent Households |
| No Children | 0 (0.0%) | 0 (0.0%) |
| 1 or 2 Children | 0 (0.0%) | 51 (50.0%) |
| 3 or 4 Children | 0 (0.0%) | 4 (50.0%) |
| 5 or more Children | 0 (0.0%) | 0 (0.0%) |
| Total | 0 (0.0%) | 55 (44.4%) |
Race in Ord
The most populous races in Ord are White / Caucasian (2,088 | 98.4%), Hispanic or Latino (76 | 3.6%), and Two or more Races (16 | 0.7%).
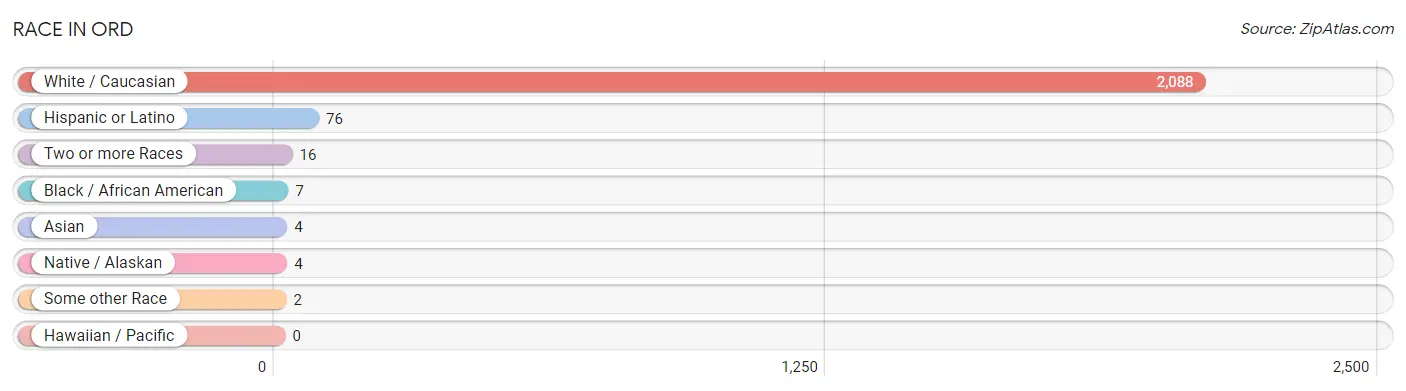
| Race | # Population | % Population |
| Asian | 4 | 0.2% |
| Black / African American | 7 | 0.3% |
| Hawaiian / Pacific | 0 | 0.0% |
| Hispanic or Latino | 76 | 3.6% |
| Native / Alaskan | 4 | 0.2% |
| White / Caucasian | 2,088 | 98.4% |
| Two or more Races | 16 | 0.7% |
| Some other Race | 2 | 0.1% |
| Total | 2,121 | 100.0% |
Ancestry in Ord
The most populous ancestries reported in Ord are German (707 | 33.3%), Czech (272 | 12.8%), Irish (229 | 10.8%), English (207 | 9.8%), and Polish (136 | 6.4%), together accounting for 73.1% of all Ord residents.
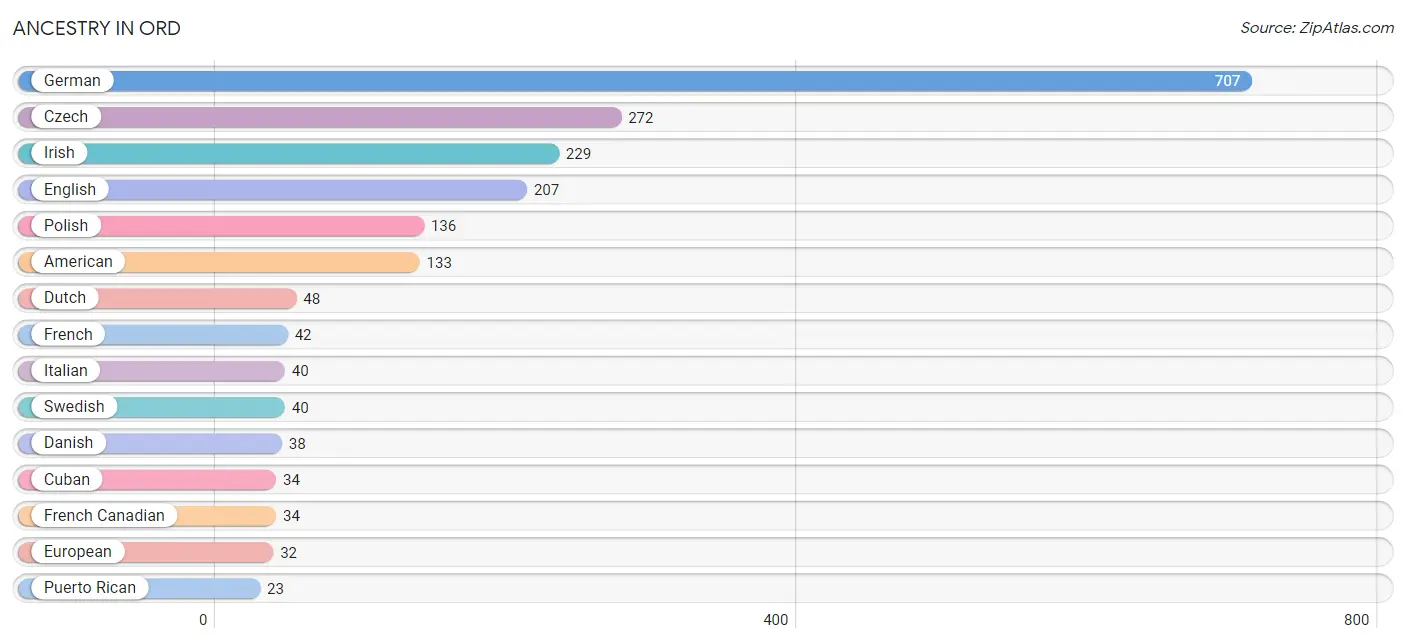
| Ancestry | # Population | % Population |
| American | 133 | 6.3% |
| Arab | 16 | 0.7% |
| Austrian | 5 | 0.2% |
| British | 20 | 0.9% |
| Celtic | 5 | 0.2% |
| Cherokee | 3 | 0.1% |
| Cuban | 34 | 1.6% |
| Czech | 272 | 12.8% |
| Czechoslovakian | 5 | 0.2% |
| Danish | 38 | 1.8% |
| Dominican | 7 | 0.3% |
| Dutch | 48 | 2.3% |
| English | 207 | 9.8% |
| European | 32 | 1.5% |
| French | 42 | 2.0% |
| French Canadian | 34 | 1.6% |
| German | 707 | 33.3% |
| Hungarian | 7 | 0.3% |
| Irish | 229 | 10.8% |
| Italian | 40 | 1.9% |
| Jordanian | 16 | 0.7% |
| Mexican | 11 | 0.5% |
| Norwegian | 16 | 0.7% |
| Pakistani | 4 | 0.2% |
| Pennsylvania German | 7 | 0.3% |
| Polish | 136 | 6.4% |
| Portuguese | 1 | 0.1% |
| Puerto Rican | 23 | 1.1% |
| Russian | 2 | 0.1% |
| Scotch-Irish | 13 | 0.6% |
| Scottish | 22 | 1.0% |
| Swedish | 40 | 1.9% |
| Swiss | 14 | 0.7% |
| Thai | 4 | 0.2% |
| Welsh | 18 | 0.9% | View All 35 Rows |
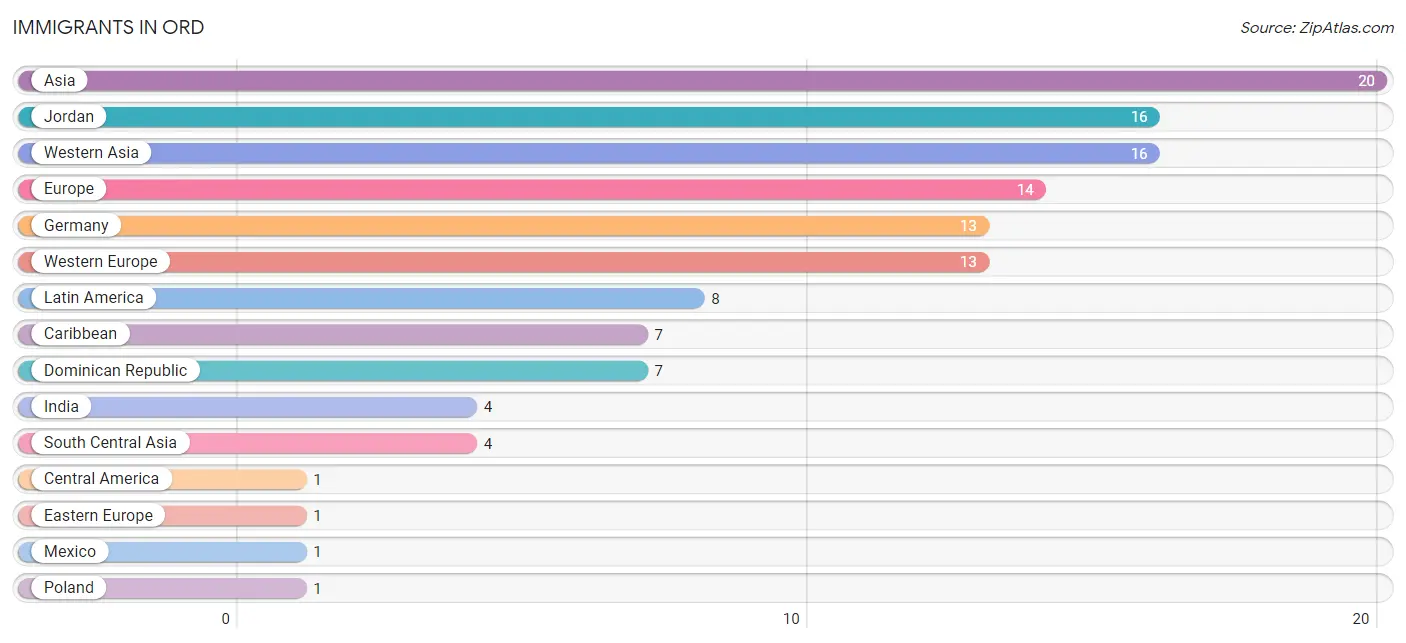
Immigrants in Ord
The most numerous immigrant groups reported in Ord came from Asia (20 | 0.9%), Jordan (16 | 0.7%), Western Asia (16 | 0.7%), Europe (14 | 0.7%), and Germany (13 | 0.6%), together accounting for 3.7% of all Ord residents.
| Immigration Origin | # Population | % Population |
| Asia | 20 | 0.9% |
| Caribbean | 7 | 0.3% |
| Central America | 1 | 0.1% |
| Dominican Republic | 7 | 0.3% |
| Eastern Europe | 1 | 0.1% |
| Europe | 14 | 0.7% |
| Germany | 13 | 0.6% |
| India | 4 | 0.2% |
| Jordan | 16 | 0.7% |
| Latin America | 8 | 0.4% |
| Mexico | 1 | 0.1% |
| Poland | 1 | 0.1% |
| South Central Asia | 4 | 0.2% |
| Western Asia | 16 | 0.7% |
| Western Europe | 13 | 0.6% | View All 15 Rows |
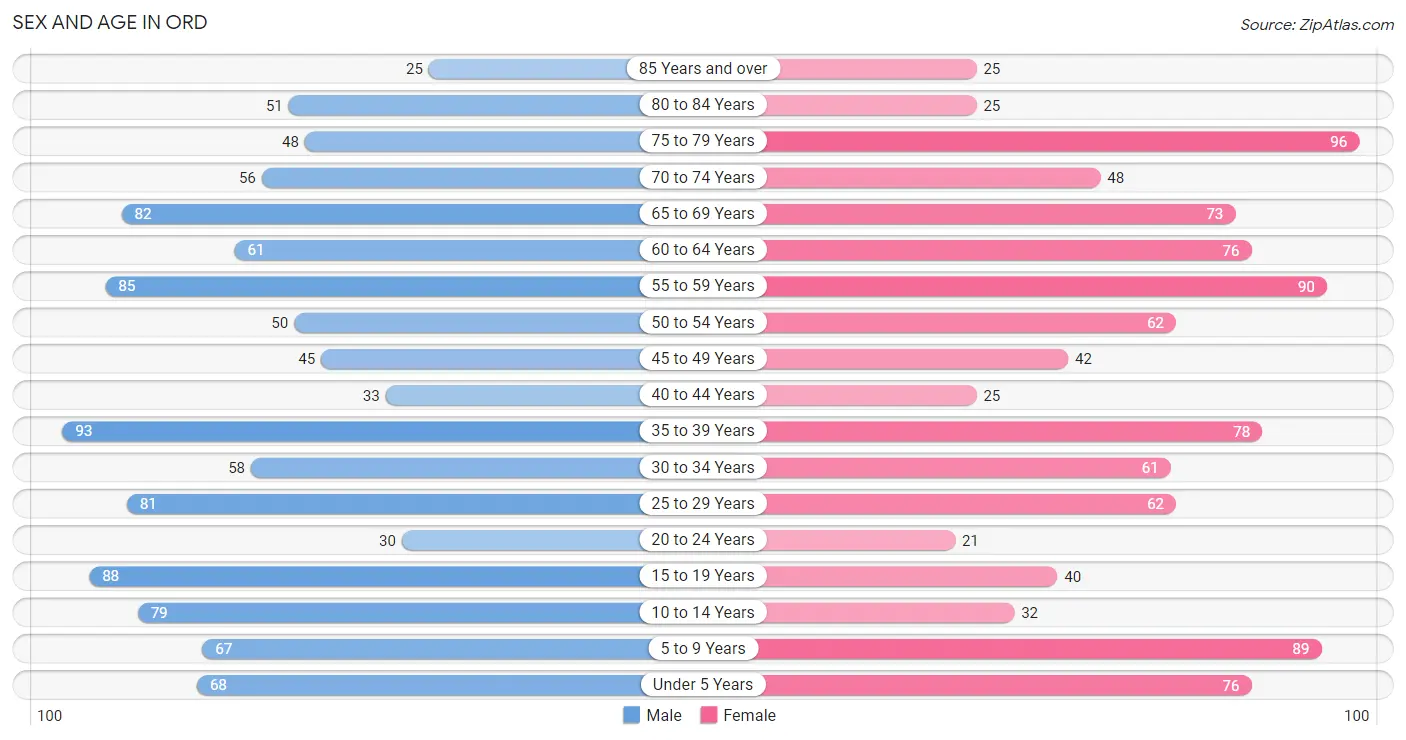
Sex and Age in Ord
Sex and Age in Ord
The most populous age groups in Ord are 35 to 39 Years (93 | 8.5%) for men and 75 to 79 Years (96 | 9.4%) for women.
| Age Bracket | Male | Female |
| Under 5 Years | 68 (6.2%) | 76 (7.4%) |
| 5 to 9 Years | 67 (6.1%) | 89 (8.7%) |
| 10 to 14 Years | 79 (7.2%) | 32 (3.1%) |
| 15 to 19 Years | 88 (8.0%) | 40 (3.9%) |
| 20 to 24 Years | 30 (2.7%) | 21 (2.1%) |
| 25 to 29 Years | 81 (7.4%) | 62 (6.1%) |
| 30 to 34 Years | 58 (5.3%) | 61 (6.0%) |
| 35 to 39 Years | 93 (8.5%) | 78 (7.6%) |
| 40 to 44 Years | 33 (3.0%) | 25 (2.5%) |
| 45 to 49 Years | 45 (4.1%) | 42 (4.1%) |
| 50 to 54 Years | 50 (4.5%) | 62 (6.1%) |
| 55 to 59 Years | 85 (7.7%) | 90 (8.8%) |
| 60 to 64 Years | 61 (5.6%) | 76 (7.4%) |
| 65 to 69 Years | 82 (7.4%) | 73 (7.1%) |
| 70 to 74 Years | 56 (5.1%) | 48 (4.7%) |
| 75 to 79 Years | 48 (4.4%) | 96 (9.4%) |
| 80 to 84 Years | 51 (4.6%) | 25 (2.5%) |
| 85 Years and over | 25 (2.3%) | 25 (2.5%) |
| Total | 1,100 (100.0%) | 1,021 (100.0%) |
Families and Households in Ord
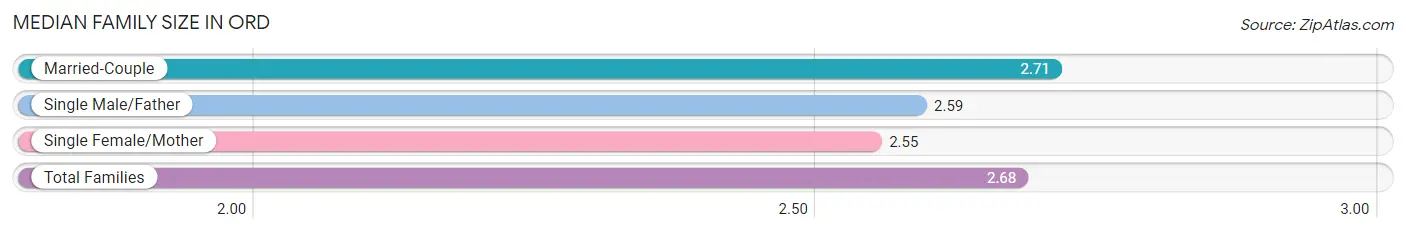
Median Family Size in Ord
The median family size in Ord is 2.68 persons per family, with married-couple families (469 | 79.1%) accounting for the largest median family size of 2.71 persons per family. On the other hand, single female/mother families (80 | 13.5%) represent the smallest median family size with 2.55 persons per family.
| Family Type | # Families | Family Size |
| Married-Couple | 469 (79.1%) | 2.71 |
| Single Male/Father | 44 (7.4%) | 2.59 |
| Single Female/Mother | 80 (13.5%) | 2.55 |
| Total Families | 593 (100.0%) | 2.68 |
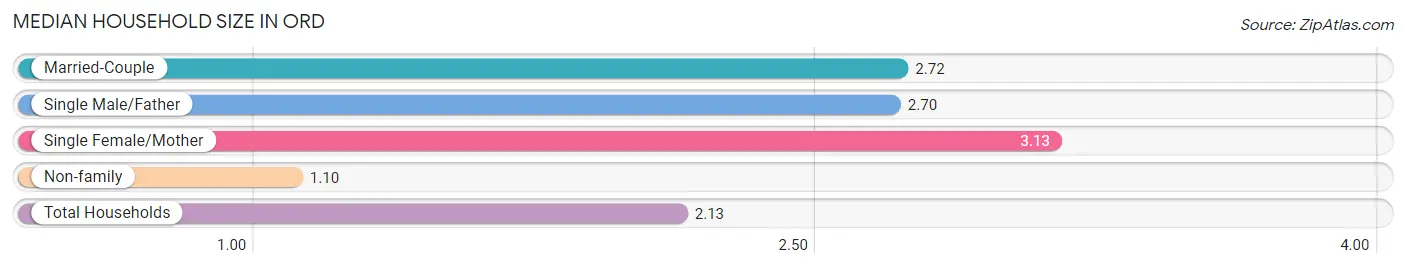
Median Household Size in Ord
The median household size in Ord is 2.13 persons per household, with single female/mother households (80 | 8.3%) accounting for the largest median household size of 3.13 persons per household. non-family households (374 | 38.7%) represent the smallest median household size with 1.10 persons per household.
| Household Type | # Households | Household Size |
| Married-Couple | 469 (48.5%) | 2.72 |
| Single Male/Father | 44 (4.5%) | 2.70 |
| Single Female/Mother | 80 (8.3%) | 3.13 |
| Non-family | 374 (38.7%) | 1.10 |
| Total Households | 967 (100.0%) | 2.13 |
Household Size by Marriage Status in Ord
Out of a total of 967 households in Ord, 593 (61.3%) are family households, while 374 (38.7%) are nonfamily households. The most numerous type of family households are 2-person households, comprising 322, and the most common type of nonfamily households are 1-person households, comprising 350.
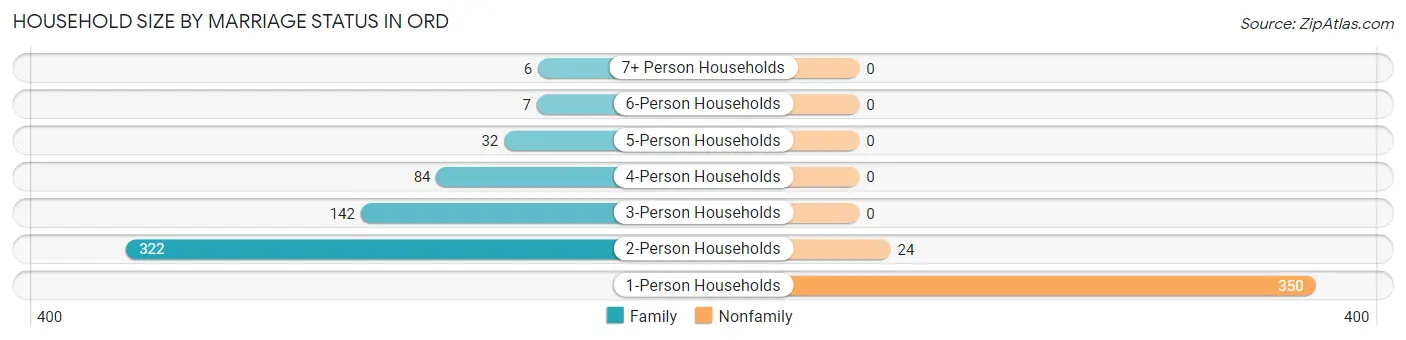
| Household Size | Family Households | Nonfamily Households |
| 1-Person Households | - | 350 (36.2%) |
| 2-Person Households | 322 (33.3%) | 24 (2.5%) |
| 3-Person Households | 142 (14.7%) | 0 (0.0%) |
| 4-Person Households | 84 (8.7%) | 0 (0.0%) |
| 5-Person Households | 32 (3.3%) | 0 (0.0%) |
| 6-Person Households | 7 (0.7%) | 0 (0.0%) |
| 7+ Person Households | 6 (0.6%) | 0 (0.0%) |
| Total | 593 (61.3%) | 374 (38.7%) |
Female Fertility in Ord
Fertility by Age in Ord
Average fertility rate in Ord is 23.0 births per 1,000 women. Women in the age bracket of 20 to 34 years have the highest fertility rate with 56.0 births per 1,000 women. Women in the age bracket of 20 to 34 years acount for 100.0% of all women with births.
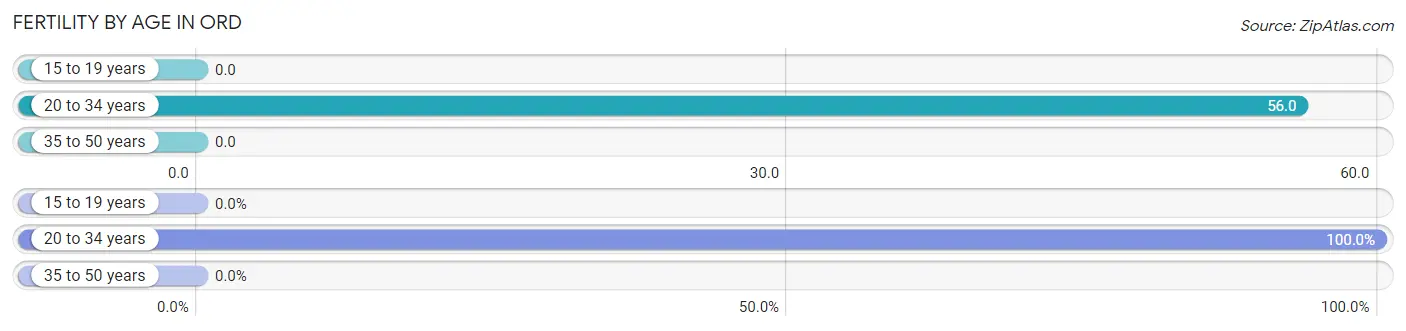
| Age Bracket | Women with Births | Births / 1,000 Women |
| 15 to 19 years | 0 (0.0%) | 0.0 |
| 20 to 34 years | 8 (100.0%) | 56.0 |
| 35 to 50 years | 0 (0.0%) | 0.0 |
| Total | 8 (100.0%) | 23.0 |
Fertility by Age by Marriage Status in Ord
87.5% of women with births (8) in Ord are married. The highest percentage of unmarried women with births falls into 20 to 34 years age bracket with 12.5% of them unmarried at the time of birth, while the lowest percentage of unmarried women with births belong to 20 to 34 years age bracket with 12.5% of them unmarried.
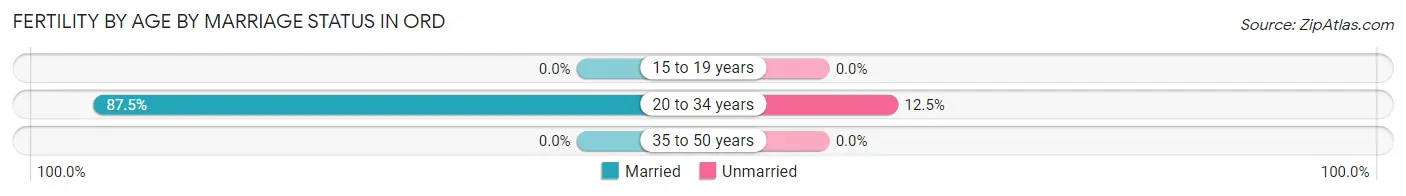
| Age Bracket | Married | Unmarried |
| 15 to 19 years | 0 (0.0%) | 0 (0.0%) |
| 20 to 34 years | 7 (87.5%) | 1 (12.5%) |
| 35 to 50 years | 0 (0.0%) | 0 (0.0%) |
| Total | 7 (87.5%) | 1 (12.5%) |
Fertility by Education in Ord
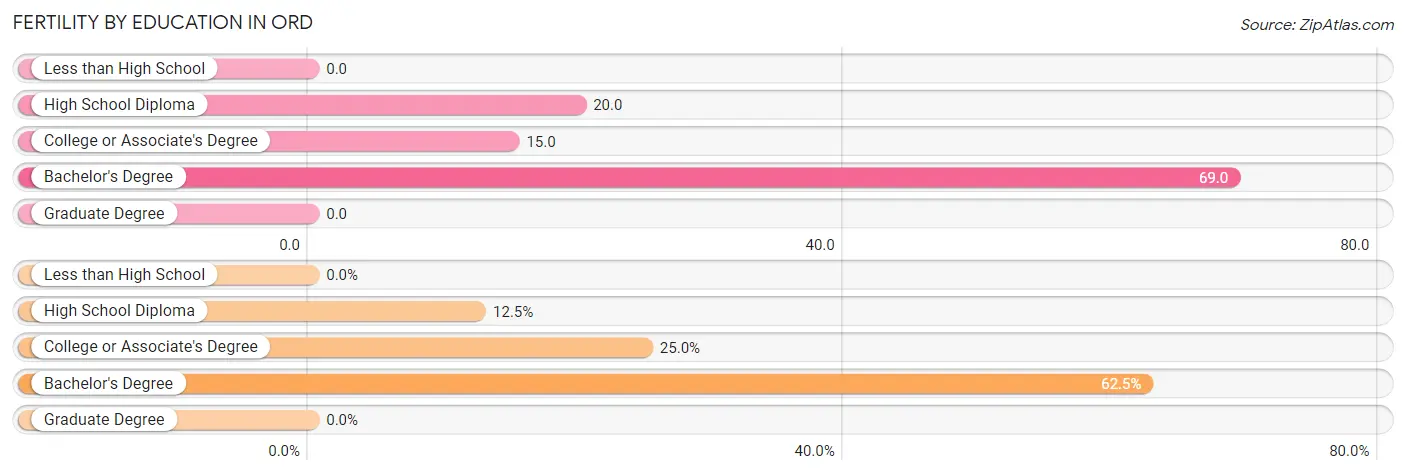
| Educational Attainment | Women with Births | Births / 1,000 Women |
| Less than High School | 0 (0.0%) | 0.0 |
| High School Diploma | 1 (12.5%) | 20.0 |
| College or Associate's Degree | 2 (25.0%) | 15.0 |
| Bachelor's Degree | 5 (62.5%) | 69.0 |
| Graduate Degree | 0 (0.0%) | 0.0 |
| Total | 8 (100.0%) | 23.0 |
Fertility by Education by Marriage Status in Ord
12.5% of women with births in Ord are unmarried. Women with the educational attainment of college or associate's degree are most likely to be married with 100.0% of them married at childbirth, while women with the educational attainment of high school diploma are least likely to be married with 100.0% of them unmarried at childbirth.
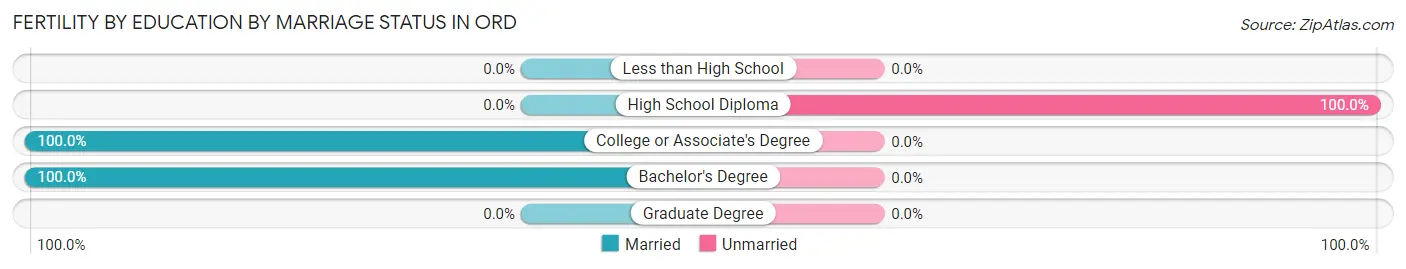
| Educational Attainment | Married | Unmarried |
| Less than High School | 0 (0.0%) | 0 (0.0%) |
| High School Diploma | 0 (0.0%) | 1 (100.0%) |
| College or Associate's Degree | 2 (100.0%) | 0 (0.0%) |
| Bachelor's Degree | 5 (100.0%) | 0 (0.0%) |
| Graduate Degree | 0 (0.0%) | 0 (0.0%) |
| Total | 7 (87.5%) | 1 (12.5%) |
Employment Characteristics in Ord
Employment by Class of Employer in Ord
Among the 1,000 employed individuals in Ord, private company employees (586 | 58.6%), not-for-profit organizations (164 | 16.4%), and local government employees (98 | 9.8%) make up the most common classes of employment.
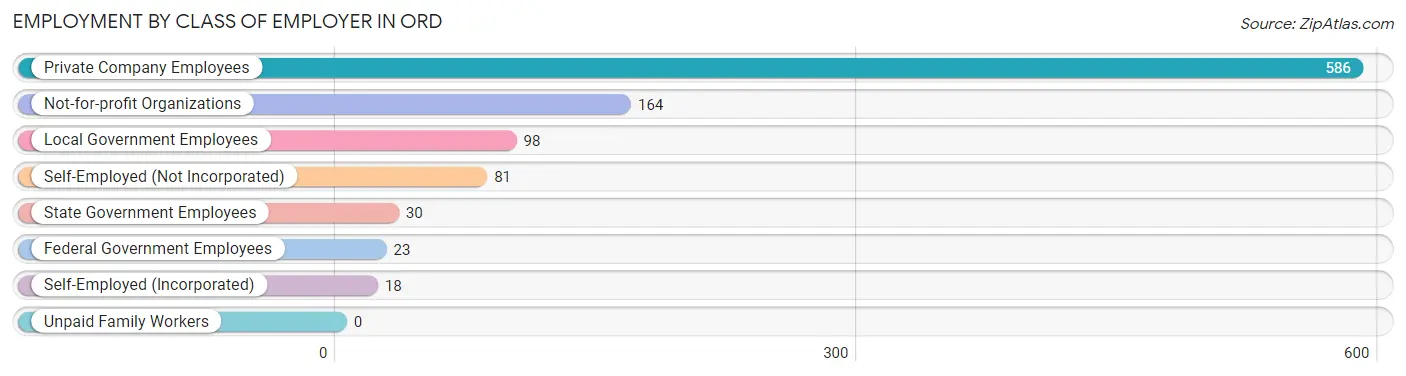
| Employer Class | # Employees | % Employees |
| Private Company Employees | 586 | 58.6% |
| Self-Employed (Incorporated) | 18 | 1.8% |
| Self-Employed (Not Incorporated) | 81 | 8.1% |
| Not-for-profit Organizations | 164 | 16.4% |
| Local Government Employees | 98 | 9.8% |
| State Government Employees | 30 | 3.0% |
| Federal Government Employees | 23 | 2.3% |
| Unpaid Family Workers | 0 | 0.0% |
| Total | 1,000 | 100.0% |
Employment Status by Age in Ord
According to the labor force statistics for Ord, out of the total population over 16 years of age (1,696), 62.0% or 1,052 individuals are in the labor force, with 1.0% or 11 of them unemployed. The age group with the highest labor force participation rate is 20 to 24 years, with 98.0% or 50 individuals in the labor force. Within the labor force, the 60 to 64 years age range has the highest percentage of unemployed individuals, with 12.0% or 11 of them being unemployed.
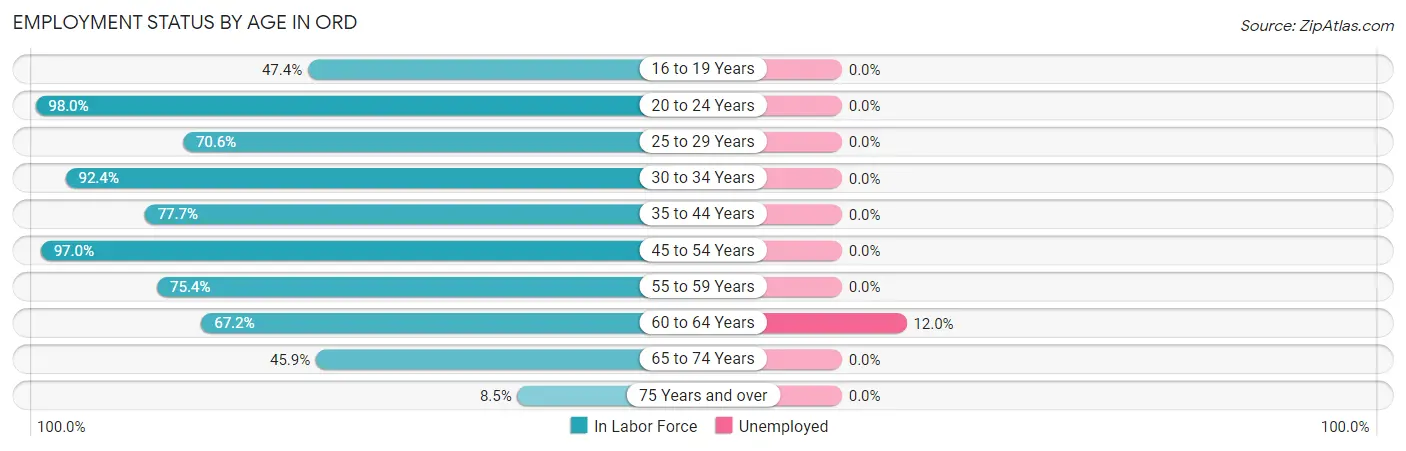
| Age Bracket | In Labor Force | Unemployed |
| 16 to 19 Years | 54 (47.4%) | 0 (0.0%) |
| 20 to 24 Years | 50 (98.0%) | 0 (0.0%) |
| 25 to 29 Years | 101 (70.6%) | 0 (0.0%) |
| 30 to 34 Years | 110 (92.4%) | 0 (0.0%) |
| 35 to 44 Years | 178 (77.7%) | 0 (0.0%) |
| 45 to 54 Years | 193 (97.0%) | 0 (0.0%) |
| 55 to 59 Years | 132 (75.4%) | 0 (0.0%) |
| 60 to 64 Years | 92 (67.2%) | 11 (12.0%) |
| 65 to 74 Years | 119 (45.9%) | 0 (0.0%) |
| 75 Years and over | 23 (8.5%) | 0 (0.0%) |
| Total | 1,052 (62.0%) | 11 (1.0%) |
Employment Status by Educational Attainment in Ord
According to labor force statistics for Ord, 80.4% of individuals (806) out of the total population between 25 and 64 years of age (1,002) are in the labor force, with 1.4% or 11 of them being unemployed. The group with the highest labor force participation rate are those with the educational attainment of high school diploma, with 87.4% or 257 individuals in the labor force. Within the labor force, individuals with bachelor's degree or higher education have the highest percentage of unemployment, with 3.1% or 6 of them being unemployed.
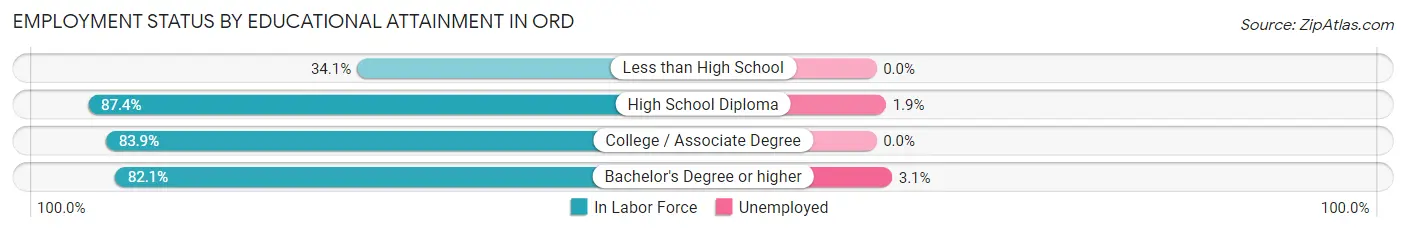
| Educational Attainment | In Labor Force | Unemployed |
| Less than High School | 28 (34.1%) | 0 (0.0%) |
| High School Diploma | 257 (87.4%) | 6 (1.9%) |
| College / Associate Degree | 328 (83.9%) | 0 (0.0%) |
| Bachelor's Degree or higher | 193 (82.1%) | 7 (3.1%) |
| Total | 806 (80.4%) | 14 (1.4%) |
Employment Occupations by Sex in Ord
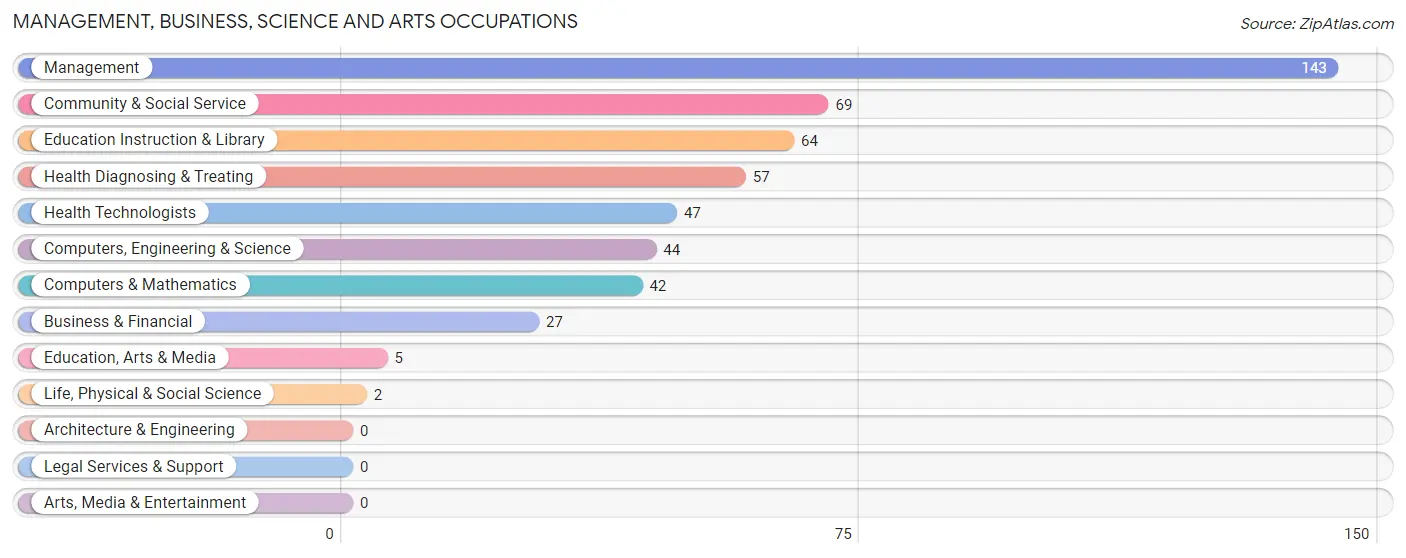
Management, Business, Science and Arts Occupations
The most common Management, Business, Science and Arts occupations in Ord are Management (143 | 13.7%), Community & Social Service (69 | 6.6%), Education Instruction & Library (64 | 6.1%), Health Diagnosing & Treating (57 | 5.5%), and Health Technologists (47 | 4.5%).
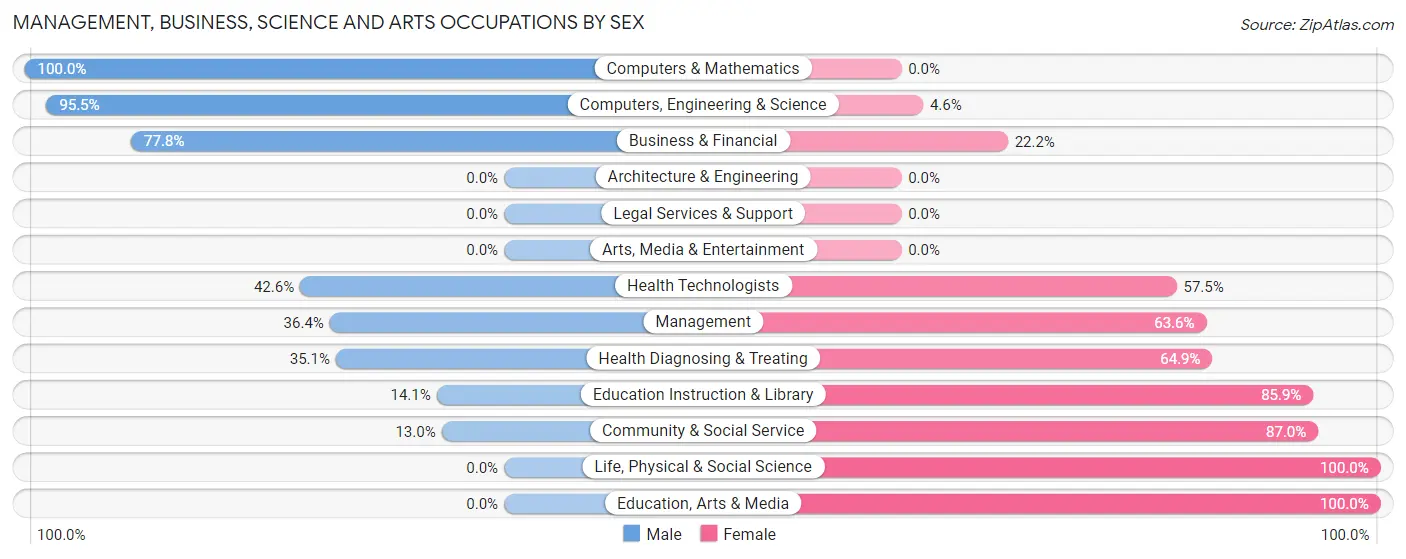
Management, Business, Science and Arts Occupations by Sex
Within the Management, Business, Science and Arts occupations in Ord, the most male-oriented occupations are Computers & Mathematics (100.0%), Computers, Engineering & Science (95.5%), and Business & Financial (77.8%), while the most female-oriented occupations are Life, Physical & Social Science (100.0%), Education, Arts & Media (100.0%), and Community & Social Service (87.0%).
| Occupation | Male | Female |
| Management | 52 (36.4%) | 91 (63.6%) |
| Business & Financial | 21 (77.8%) | 6 (22.2%) |
| Computers, Engineering & Science | 42 (95.5%) | 2 (4.5%) |
| Computers & Mathematics | 42 (100.0%) | 0 (0.0%) |
| Architecture & Engineering | 0 (0.0%) | 0 (0.0%) |
| Life, Physical & Social Science | 0 (0.0%) | 2 (100.0%) |
| Community & Social Service | 9 (13.0%) | 60 (87.0%) |
| Education, Arts & Media | 0 (0.0%) | 5 (100.0%) |
| Legal Services & Support | 0 (0.0%) | 0 (0.0%) |
| Education Instruction & Library | 9 (14.1%) | 55 (85.9%) |
| Arts, Media & Entertainment | 0 (0.0%) | 0 (0.0%) |
| Health Diagnosing & Treating | 20 (35.1%) | 37 (64.9%) |
| Health Technologists | 20 (42.5%) | 27 (57.5%) |
| Total (Category) | 144 (42.3%) | 196 (57.7%) |
| Total (Overall) | 525 (50.4%) | 516 (49.6%) |
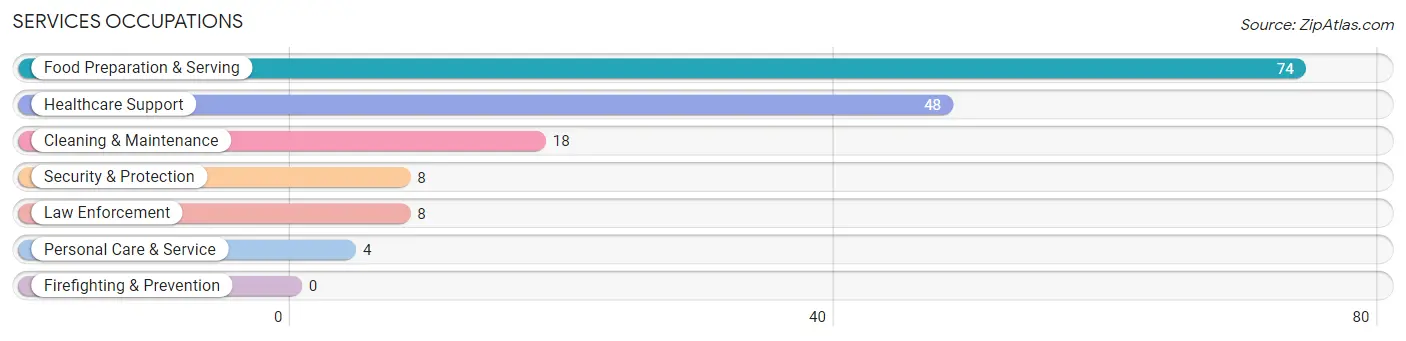
Services Occupations
The most common Services occupations in Ord are Food Preparation & Serving (74 | 7.1%), Healthcare Support (48 | 4.6%), Cleaning & Maintenance (18 | 1.7%), Security & Protection (8 | 0.8%), and Law Enforcement (8 | 0.8%).
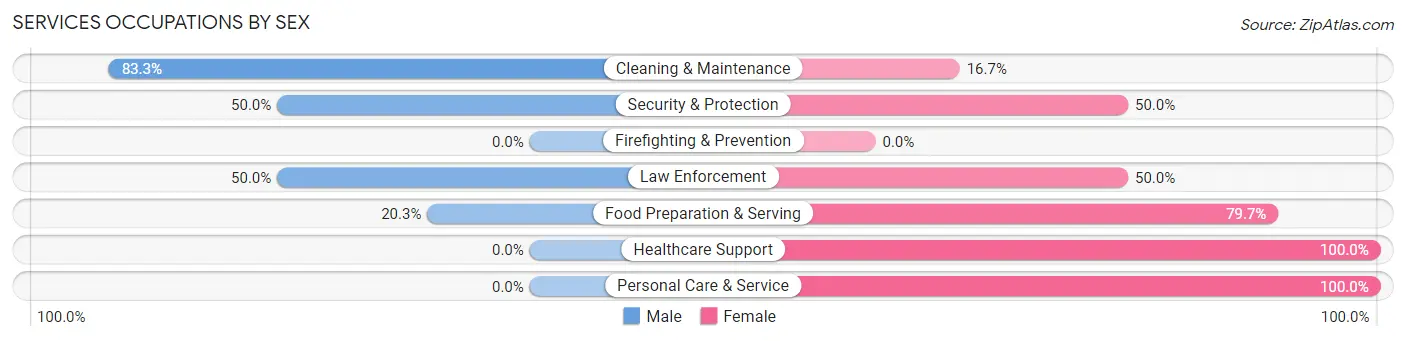
Services Occupations by Sex
Within the Services occupations in Ord, the most male-oriented occupations are Cleaning & Maintenance (83.3%), Security & Protection (50.0%), and Law Enforcement (50.0%), while the most female-oriented occupations are Healthcare Support (100.0%), Personal Care & Service (100.0%), and Food Preparation & Serving (79.7%).
| Occupation | Male | Female |
| Healthcare Support | 0 (0.0%) | 48 (100.0%) |
| Security & Protection | 4 (50.0%) | 4 (50.0%) |
| Firefighting & Prevention | 0 (0.0%) | 0 (0.0%) |
| Law Enforcement | 4 (50.0%) | 4 (50.0%) |
| Food Preparation & Serving | 15 (20.3%) | 59 (79.7%) |
| Cleaning & Maintenance | 15 (83.3%) | 3 (16.7%) |
| Personal Care & Service | 0 (0.0%) | 4 (100.0%) |
| Total (Category) | 34 (22.4%) | 118 (77.6%) |
| Total (Overall) | 525 (50.4%) | 516 (49.6%) |
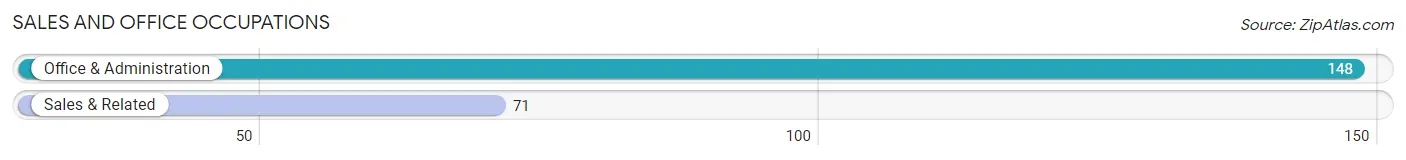
Sales and Office Occupations
The most common Sales and Office occupations in Ord are Office & Administration (148 | 14.2%), and Sales & Related (71 | 6.8%).
Sales and Office Occupations by Sex
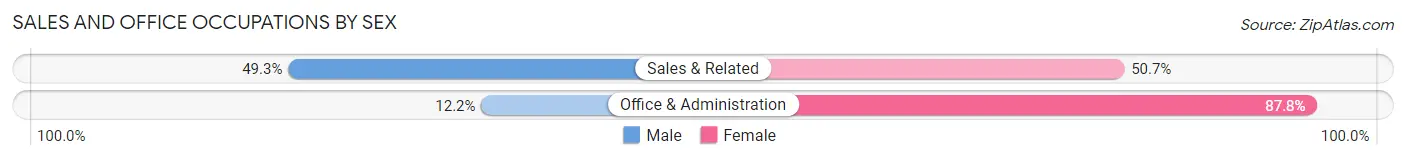
| Occupation | Male | Female |
| Sales & Related | 35 (49.3%) | 36 (50.7%) |
| Office & Administration | 18 (12.2%) | 130 (87.8%) |
| Total (Category) | 53 (24.2%) | 166 (75.8%) |
| Total (Overall) | 525 (50.4%) | 516 (49.6%) |
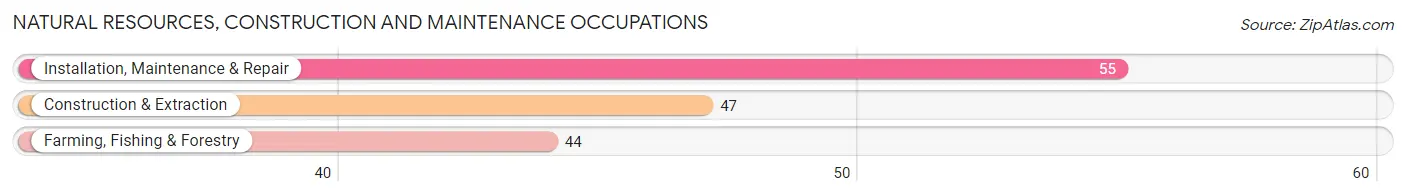
Natural Resources, Construction and Maintenance Occupations
The most common Natural Resources, Construction and Maintenance occupations in Ord are Installation, Maintenance & Repair (55 | 5.3%), Construction & Extraction (47 | 4.5%), and Farming, Fishing & Forestry (44 | 4.2%).
Natural Resources, Construction and Maintenance Occupations by Sex
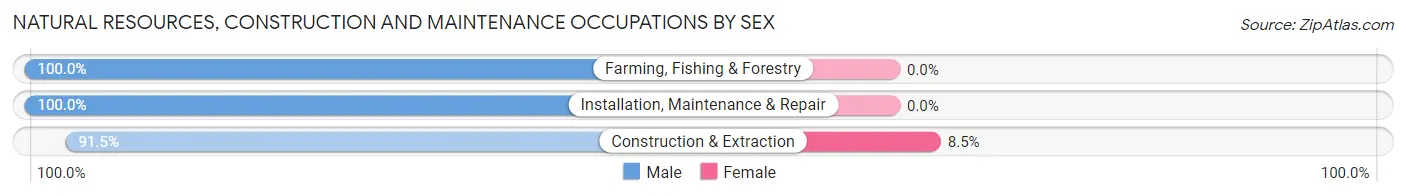
| Occupation | Male | Female |
| Farming, Fishing & Forestry | 44 (100.0%) | 0 (0.0%) |
| Construction & Extraction | 43 (91.5%) | 4 (8.5%) |
| Installation, Maintenance & Repair | 55 (100.0%) | 0 (0.0%) |
| Total (Category) | 142 (97.3%) | 4 (2.7%) |
| Total (Overall) | 525 (50.4%) | 516 (49.6%) |
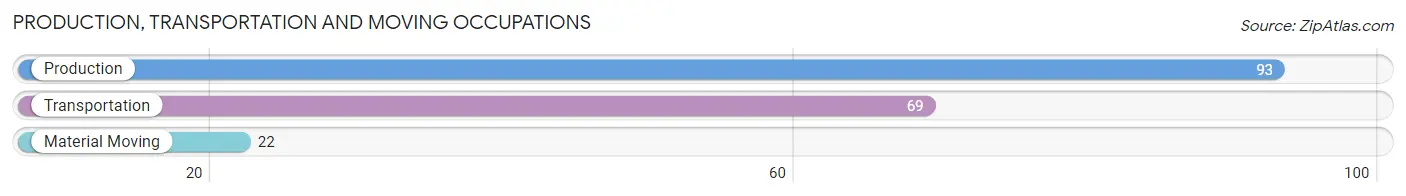
Production, Transportation and Moving Occupations
The most common Production, Transportation and Moving occupations in Ord are Production (93 | 8.9%), Transportation (69 | 6.6%), and Material Moving (22 | 2.1%).
Production, Transportation and Moving Occupations by Sex
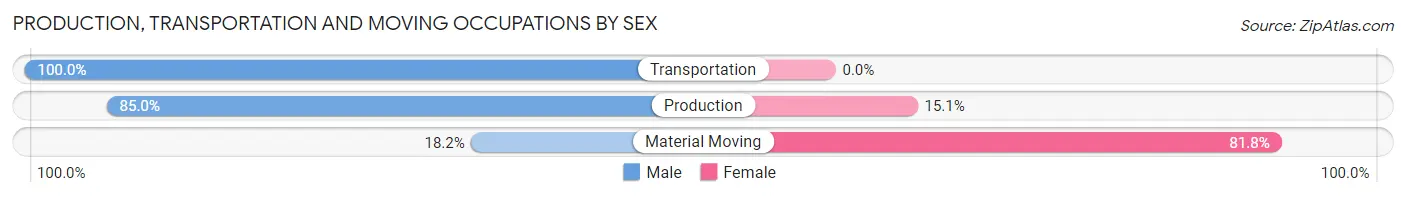
| Occupation | Male | Female |
| Production | 79 (85.0%) | 14 (15.0%) |
| Transportation | 69 (100.0%) | 0 (0.0%) |
| Material Moving | 4 (18.2%) | 18 (81.8%) |
| Total (Category) | 152 (82.6%) | 32 (17.4%) |
| Total (Overall) | 525 (50.4%) | 516 (49.6%) |
Employment Industries by Sex in Ord
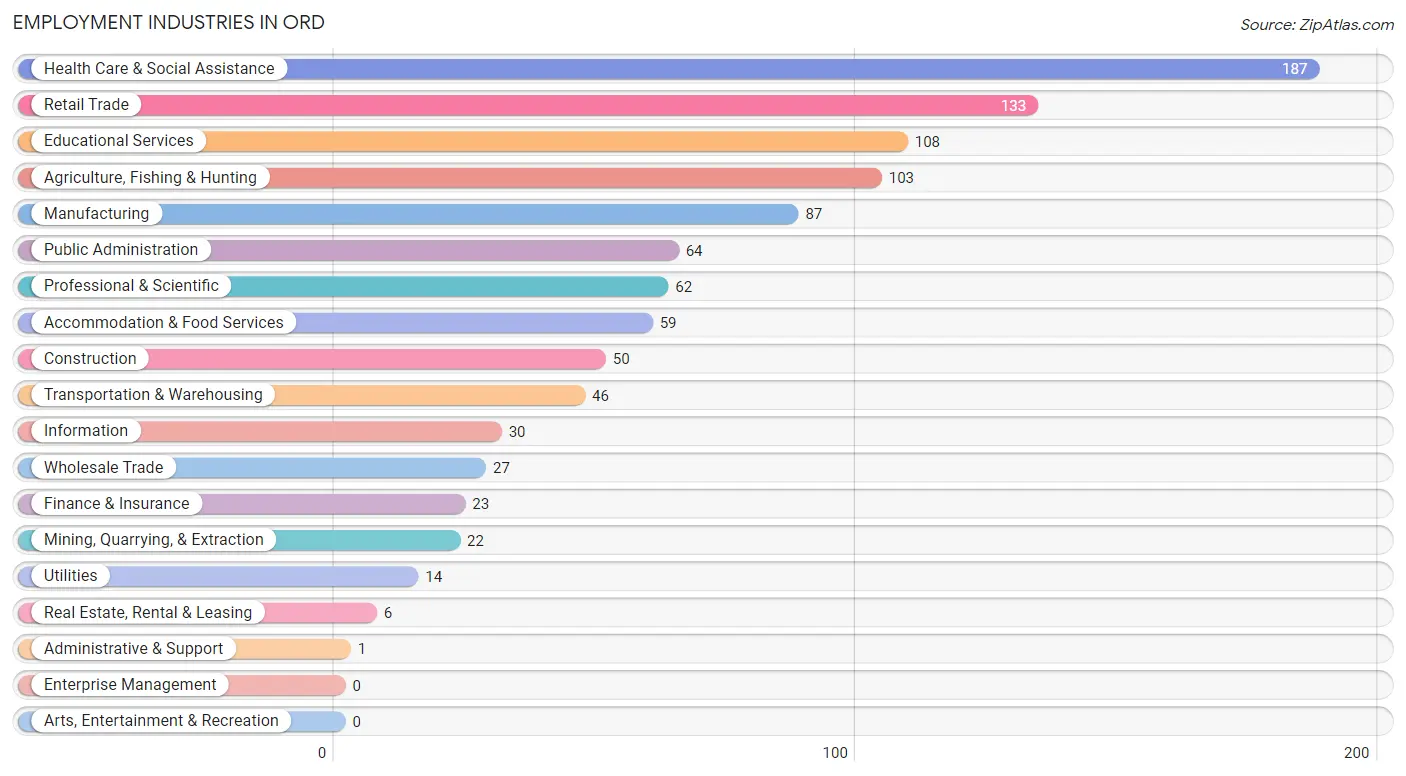
Employment Industries in Ord
The major employment industries in Ord include Health Care & Social Assistance (187 | 18.0%), Retail Trade (133 | 12.8%), Educational Services (108 | 10.4%), Agriculture, Fishing & Hunting (103 | 9.9%), and Manufacturing (87 | 8.4%).
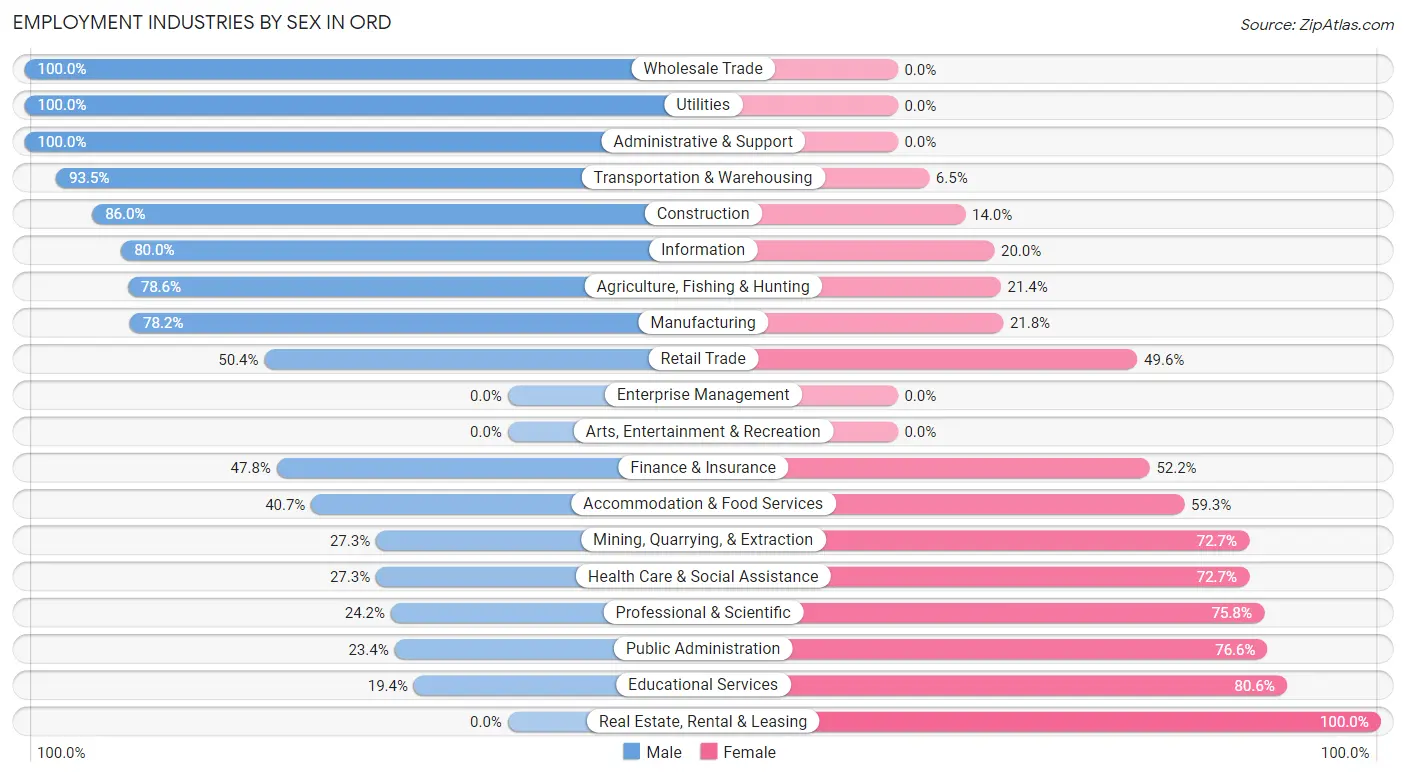
Employment Industries by Sex in Ord
The Ord industries that see more men than women are Wholesale Trade (100.0%), Utilities (100.0%), and Administrative & Support (100.0%), whereas the industries that tend to have a higher number of women are Real Estate, Rental & Leasing (100.0%), Educational Services (80.6%), and Public Administration (76.6%).
| Industry | Male | Female |
| Agriculture, Fishing & Hunting | 81 (78.6%) | 22 (21.4%) |
| Mining, Quarrying, & Extraction | 6 (27.3%) | 16 (72.7%) |
| Construction | 43 (86.0%) | 7 (14.0%) |
| Manufacturing | 68 (78.2%) | 19 (21.8%) |
| Wholesale Trade | 27 (100.0%) | 0 (0.0%) |
| Retail Trade | 67 (50.4%) | 66 (49.6%) |
| Transportation & Warehousing | 43 (93.5%) | 3 (6.5%) |
| Utilities | 14 (100.0%) | 0 (0.0%) |
| Information | 24 (80.0%) | 6 (20.0%) |
| Finance & Insurance | 11 (47.8%) | 12 (52.2%) |
| Real Estate, Rental & Leasing | 0 (0.0%) | 6 (100.0%) |
| Professional & Scientific | 15 (24.2%) | 47 (75.8%) |
| Enterprise Management | 0 (0.0%) | 0 (0.0%) |
| Administrative & Support | 1 (100.0%) | 0 (0.0%) |
| Educational Services | 21 (19.4%) | 87 (80.6%) |
| Health Care & Social Assistance | 51 (27.3%) | 136 (72.7%) |
| Arts, Entertainment & Recreation | 0 (0.0%) | 0 (0.0%) |
| Accommodation & Food Services | 24 (40.7%) | 35 (59.3%) |
| Public Administration | 15 (23.4%) | 49 (76.6%) |
| Total | 525 (50.4%) | 516 (49.6%) |
Education in Ord
School Enrollment in Ord
The most common levels of schooling among the 473 students in Ord are elementary school (120 | 25.4%), high school (113 | 23.9%), and middle school (106 | 22.4%).
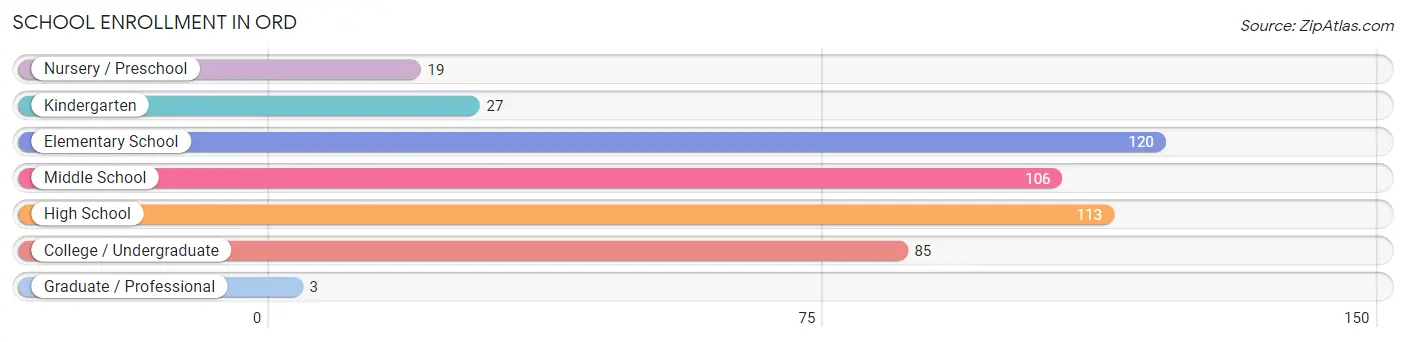
| School Level | # Students | % Students |
| Nursery / Preschool | 19 | 4.0% |
| Kindergarten | 27 | 5.7% |
| Elementary School | 120 | 25.4% |
| Middle School | 106 | 22.4% |
| High School | 113 | 23.9% |
| College / Undergraduate | 85 | 18.0% |
| Graduate / Professional | 3 | 0.6% |
| Total | 473 | 100.0% |
School Enrollment by Age by Funding Source in Ord
Out of a total of 473 students who are enrolled in schools in Ord, 19 (4.0%) attend a private institution, while the remaining 454 (96.0%) are enrolled in public schools. The age group of 18 to 19 year olds has the highest likelihood of being enrolled in private schools, with 9 (16.1% in the age bracket) enrolled. Conversely, the age group of 3 to 4 year olds has the lowest likelihood of being enrolled in a private school, with 10 (100.0% in the age bracket) attending a public institution.
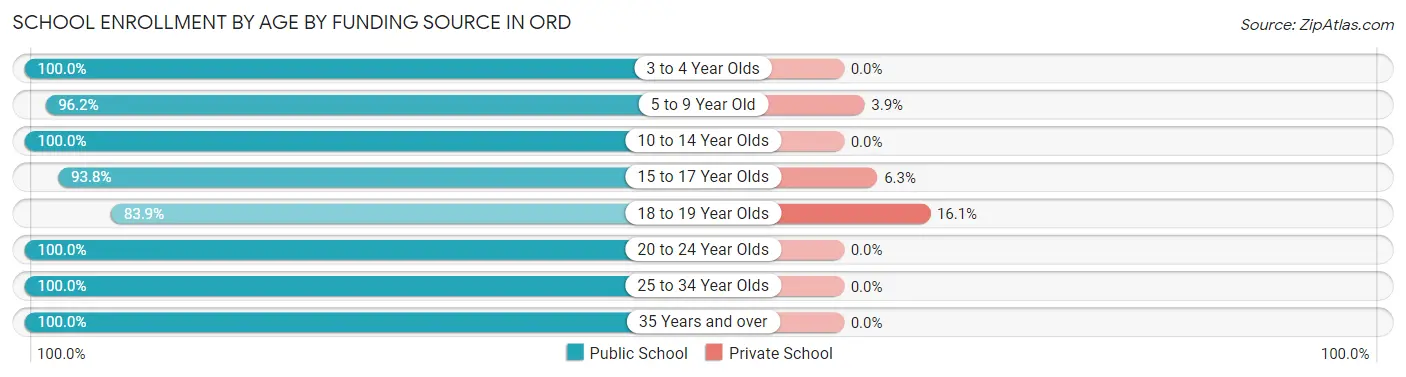
| Age Bracket | Public School | Private School |
| 3 to 4 Year Olds | 10 (100.0%) | 0 (0.0%) |
| 5 to 9 Year Old | 150 (96.2%) | 6 (3.8%) |
| 10 to 14 Year Olds | 111 (100.0%) | 0 (0.0%) |
| 15 to 17 Year Olds | 60 (93.8%) | 4 (6.2%) |
| 18 to 19 Year Olds | 47 (83.9%) | 9 (16.1%) |
| 20 to 24 Year Olds | 4 (100.0%) | 0 (0.0%) |
| 25 to 34 Year Olds | 12 (100.0%) | 0 (0.0%) |
| 35 Years and over | 60 (100.0%) | 0 (0.0%) |
| Total | 454 (96.0%) | 19 (4.0%) |
Educational Attainment by Field of Study in Ord
Education (78 | 18.3%), bio, nature & agricultural (63 | 14.7%), science & technology (60 | 14.1%), business (57 | 13.4%), and arts & humanities (48 | 11.2%) are the most common fields of study among 427 individuals in Ord who have obtained a bachelor's degree or higher.
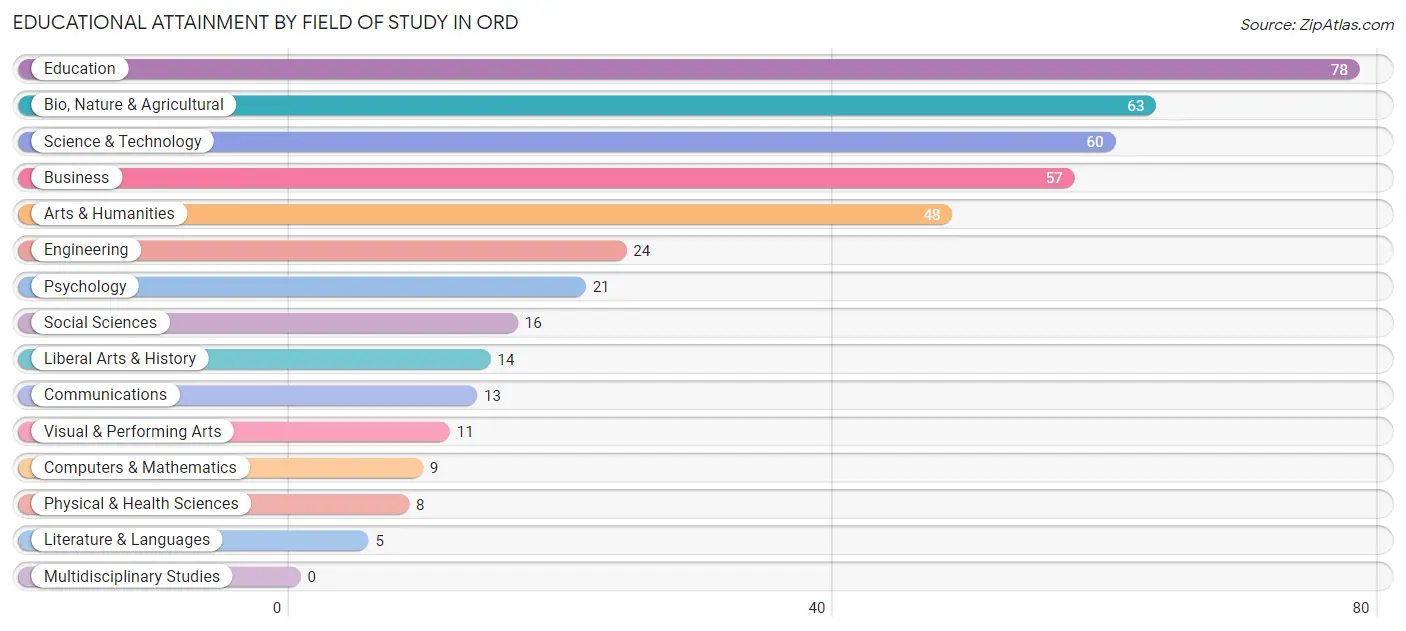
| Field of Study | # Graduates | % Graduates |
| Computers & Mathematics | 9 | 2.1% |
| Bio, Nature & Agricultural | 63 | 14.7% |
| Physical & Health Sciences | 8 | 1.9% |
| Psychology | 21 | 4.9% |
| Social Sciences | 16 | 3.7% |
| Engineering | 24 | 5.6% |
| Multidisciplinary Studies | 0 | 0.0% |
| Science & Technology | 60 | 14.1% |
| Business | 57 | 13.4% |
| Education | 78 | 18.3% |
| Literature & Languages | 5 | 1.2% |
| Liberal Arts & History | 14 | 3.3% |
| Visual & Performing Arts | 11 | 2.6% |
| Communications | 13 | 3.0% |
| Arts & Humanities | 48 | 11.2% |
| Total | 427 | 100.0% |
Transportation & Commute in Ord
Vehicle Availability by Sex in Ord
The most prevalent vehicle ownership categories in Ord are males with 2 vehicles (140, accounting for 28.5%) and females with 2 vehicles (187, making up 27.9%).
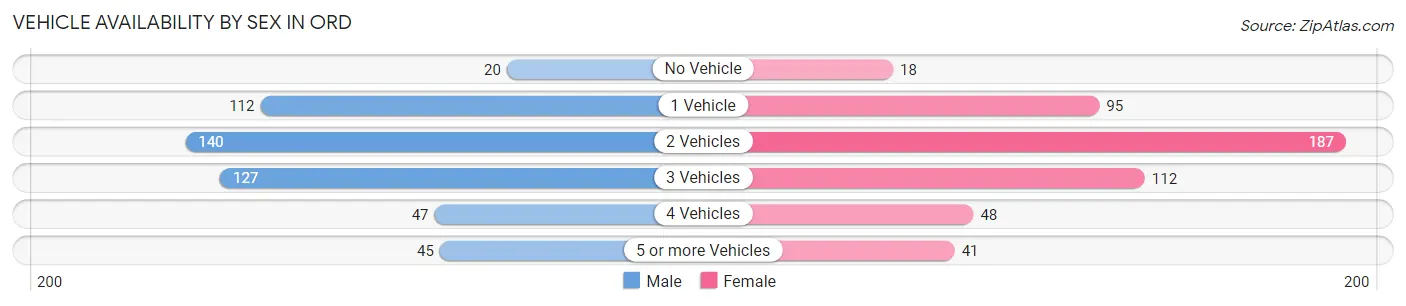
| Vehicles Available | Male | Female |
| No Vehicle | 20 (4.1%) | 18 (3.6%) |
| 1 Vehicle | 112 (22.8%) | 95 (19.0%) |
| 2 Vehicles | 140 (28.5%) | 187 (37.3%) |
| 3 Vehicles | 127 (25.9%) | 112 (22.4%) |
| 4 Vehicles | 47 (9.6%) | 48 (9.6%) |
| 5 or more Vehicles | 45 (9.2%) | 41 (8.2%) |
| Total | 491 (100.0%) | 501 (100.0%) |
Commute Time in Ord
The most frequently occuring commute durations in Ord are 5 to 9 minutes (457 commuters, 47.3%), 10 to 14 minutes (176 commuters, 18.2%), and less than 5 minutes (158 commuters, 16.4%).
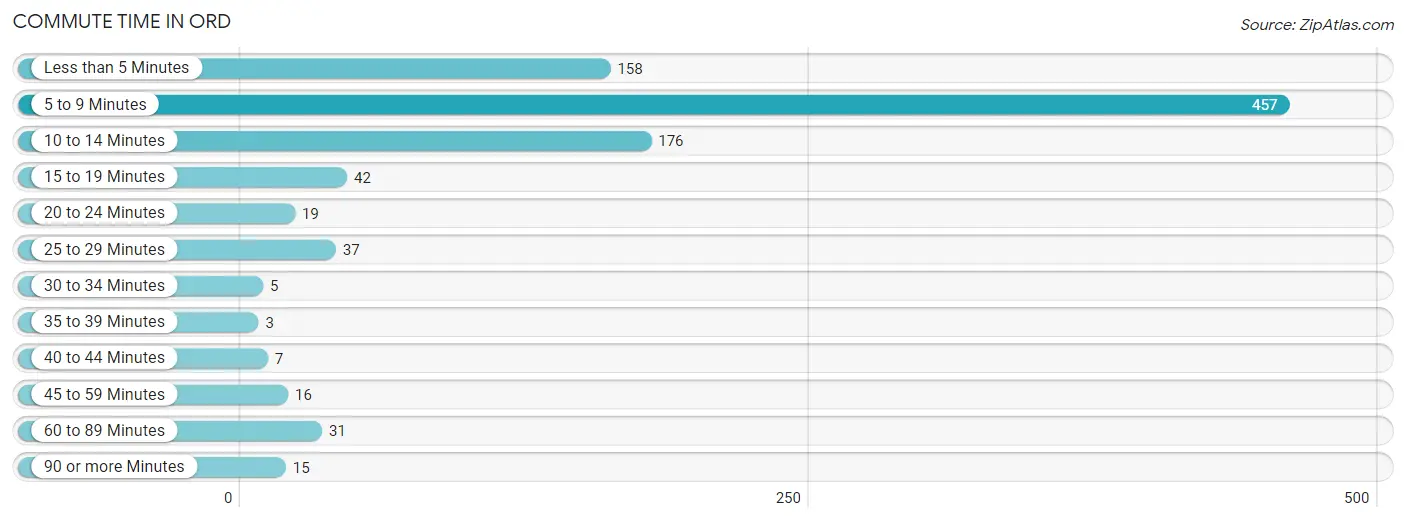
| Commute Time | # Commuters | % Commuters |
| Less than 5 Minutes | 158 | 16.4% |
| 5 to 9 Minutes | 457 | 47.3% |
| 10 to 14 Minutes | 176 | 18.2% |
| 15 to 19 Minutes | 42 | 4.3% |
| 20 to 24 Minutes | 19 | 2.0% |
| 25 to 29 Minutes | 37 | 3.8% |
| 30 to 34 Minutes | 5 | 0.5% |
| 35 to 39 Minutes | 3 | 0.3% |
| 40 to 44 Minutes | 7 | 0.7% |
| 45 to 59 Minutes | 16 | 1.7% |
| 60 to 89 Minutes | 31 | 3.2% |
| 90 or more Minutes | 15 | 1.5% |
Commute Time by Sex in Ord
The most common commute times in Ord are 5 to 9 minutes (202 commuters, 41.1%) for males and 5 to 9 minutes (255 commuters, 53.7%) for females.
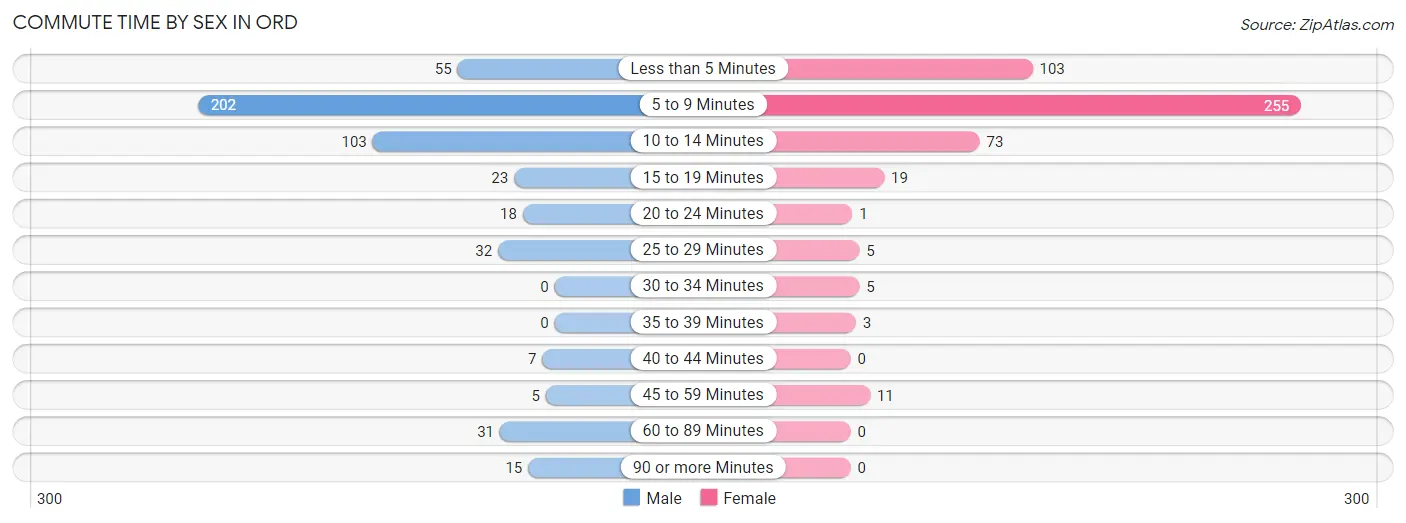
| Commute Time | Male | Female |
| Less than 5 Minutes | 55 (11.2%) | 103 (21.7%) |
| 5 to 9 Minutes | 202 (41.1%) | 255 (53.7%) |
| 10 to 14 Minutes | 103 (21.0%) | 73 (15.4%) |
| 15 to 19 Minutes | 23 (4.7%) | 19 (4.0%) |
| 20 to 24 Minutes | 18 (3.7%) | 1 (0.2%) |
| 25 to 29 Minutes | 32 (6.5%) | 5 (1.1%) |
| 30 to 34 Minutes | 0 (0.0%) | 5 (1.1%) |
| 35 to 39 Minutes | 0 (0.0%) | 3 (0.6%) |
| 40 to 44 Minutes | 7 (1.4%) | 0 (0.0%) |
| 45 to 59 Minutes | 5 (1.0%) | 11 (2.3%) |
| 60 to 89 Minutes | 31 (6.3%) | 0 (0.0%) |
| 90 or more Minutes | 15 (3.0%) | 0 (0.0%) |
Time of Departure to Work by Sex in Ord
The most frequent times of departure to work in Ord are 7:30 AM to 7:59 AM (128, 26.1%) for males and 7:30 AM to 7:59 AM (139, 29.3%) for females.
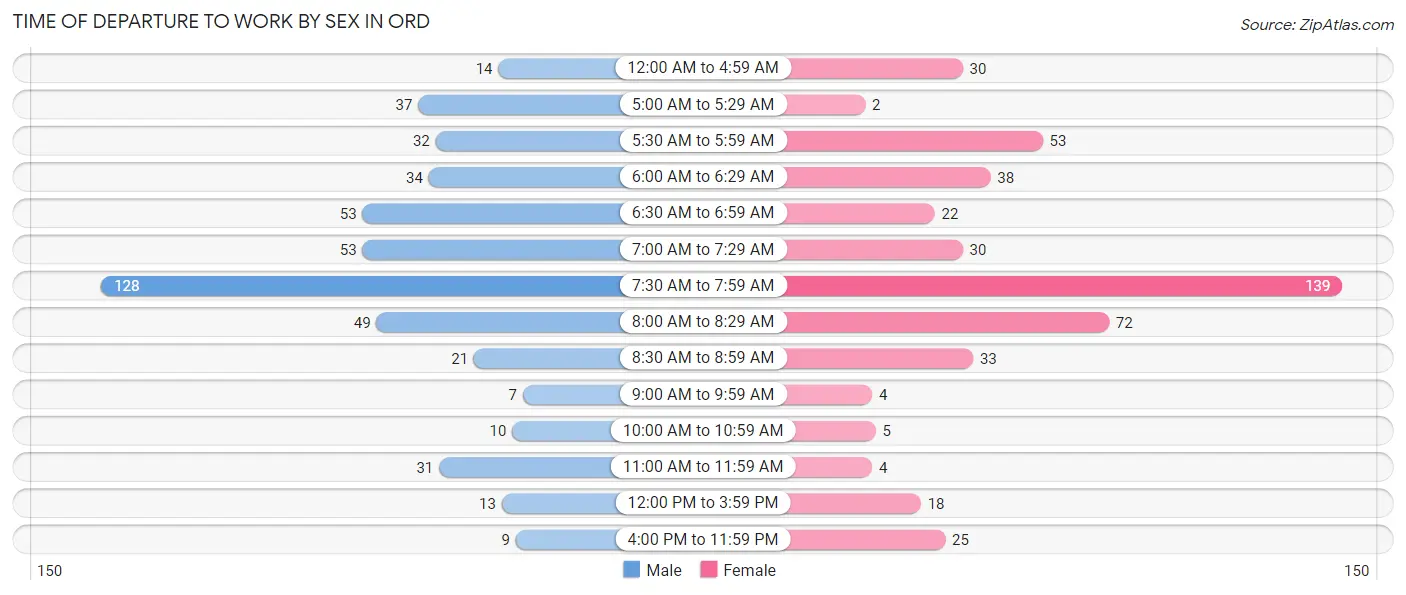
| Time of Departure | Male | Female |
| 12:00 AM to 4:59 AM | 14 (2.9%) | 30 (6.3%) |
| 5:00 AM to 5:29 AM | 37 (7.5%) | 2 (0.4%) |
| 5:30 AM to 5:59 AM | 32 (6.5%) | 53 (11.2%) |
| 6:00 AM to 6:29 AM | 34 (6.9%) | 38 (8.0%) |
| 6:30 AM to 6:59 AM | 53 (10.8%) | 22 (4.6%) |
| 7:00 AM to 7:29 AM | 53 (10.8%) | 30 (6.3%) |
| 7:30 AM to 7:59 AM | 128 (26.1%) | 139 (29.3%) |
| 8:00 AM to 8:29 AM | 49 (10.0%) | 72 (15.2%) |
| 8:30 AM to 8:59 AM | 21 (4.3%) | 33 (7.0%) |
| 9:00 AM to 9:59 AM | 7 (1.4%) | 4 (0.8%) |
| 10:00 AM to 10:59 AM | 10 (2.0%) | 5 (1.1%) |
| 11:00 AM to 11:59 AM | 31 (6.3%) | 4 (0.8%) |
| 12:00 PM to 3:59 PM | 13 (2.6%) | 18 (3.8%) |
| 4:00 PM to 11:59 PM | 9 (1.8%) | 25 (5.3%) |
| Total | 491 (100.0%) | 475 (100.0%) |
Housing Occupancy in Ord
Occupancy by Ownership in Ord
Of the total 967 dwellings in Ord, owner-occupied units account for 724 (74.9%), while renter-occupied units make up 243 (25.1%).
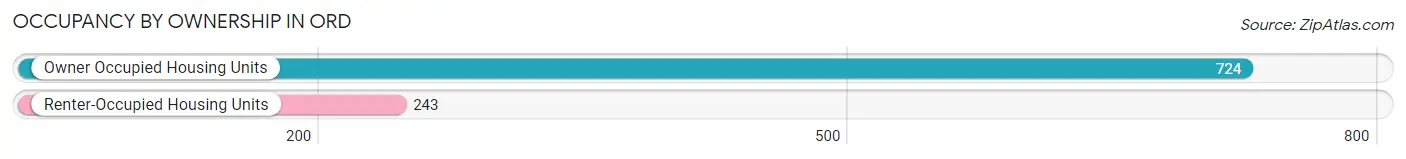
| Occupancy | # Housing Units | % Housing Units |
| Owner Occupied Housing Units | 724 | 74.9% |
| Renter-Occupied Housing Units | 243 | 25.1% |
| Total Occupied Housing Units | 967 | 100.0% |
Occupancy by Household Size in Ord
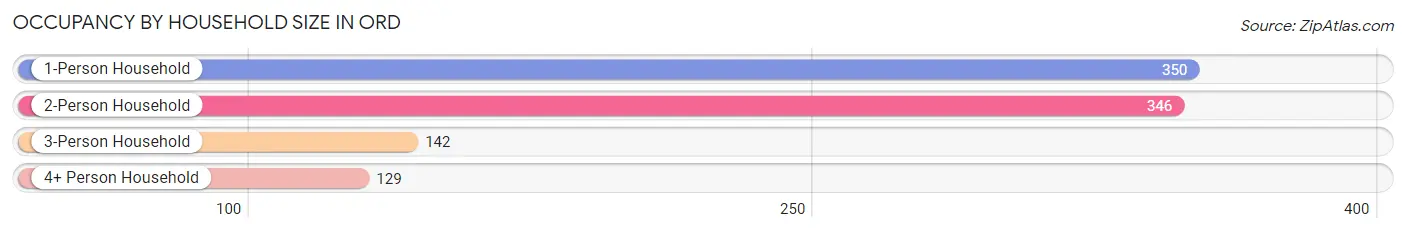
| Household Size | # Housing Units | % Housing Units |
| 1-Person Household | 350 | 36.2% |
| 2-Person Household | 346 | 35.8% |
| 3-Person Household | 142 | 14.7% |
| 4+ Person Household | 129 | 13.3% |
| Total Housing Units | 967 | 100.0% |
Occupancy by Ownership by Household Size in Ord
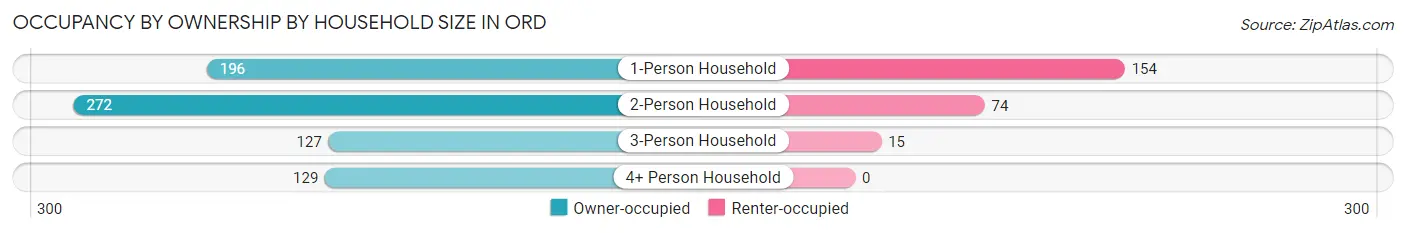
| Household Size | Owner-occupied | Renter-occupied |
| 1-Person Household | 196 (56.0%) | 154 (44.0%) |
| 2-Person Household | 272 (78.6%) | 74 (21.4%) |
| 3-Person Household | 127 (89.4%) | 15 (10.6%) |
| 4+ Person Household | 129 (100.0%) | 0 (0.0%) |
| Total Housing Units | 724 (74.9%) | 243 (25.1%) |
Occupancy by Educational Attainment in Ord
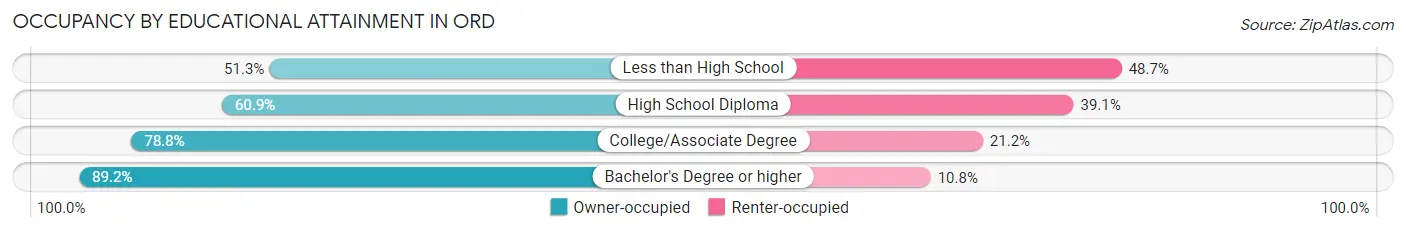
| Household Size | Owner-occupied | Renter-occupied |
| Less than High School | 39 (51.3%) | 37 (48.7%) |
| High School Diploma | 140 (60.9%) | 90 (39.1%) |
| College/Associate Degree | 339 (78.8%) | 91 (21.2%) |
| Bachelor's Degree or higher | 206 (89.2%) | 25 (10.8%) |
Occupancy by Age of Householder in Ord
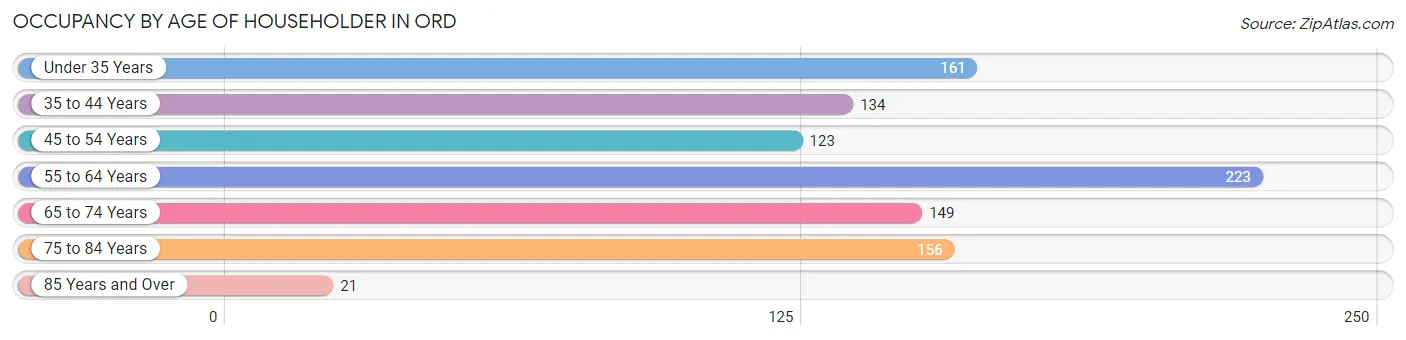
| Age Bracket | # Households | % Households |
| Under 35 Years | 161 | 16.7% |
| 35 to 44 Years | 134 | 13.9% |
| 45 to 54 Years | 123 | 12.7% |
| 55 to 64 Years | 223 | 23.1% |
| 65 to 74 Years | 149 | 15.4% |
| 75 to 84 Years | 156 | 16.1% |
| 85 Years and Over | 21 | 2.2% |
| Total | 967 | 100.0% |
Housing Finances in Ord
Median Income by Occupancy in Ord
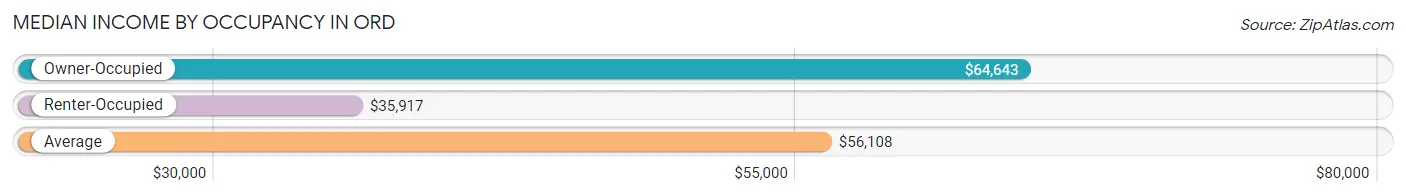
| Occupancy Type | # Households | Median Income |
| Owner-Occupied | 724 (74.9%) | $64,643 |
| Renter-Occupied | 243 (25.1%) | $35,917 |
| Average | 967 (100.0%) | $56,108 |
Occupancy by Householder Income Bracket in Ord
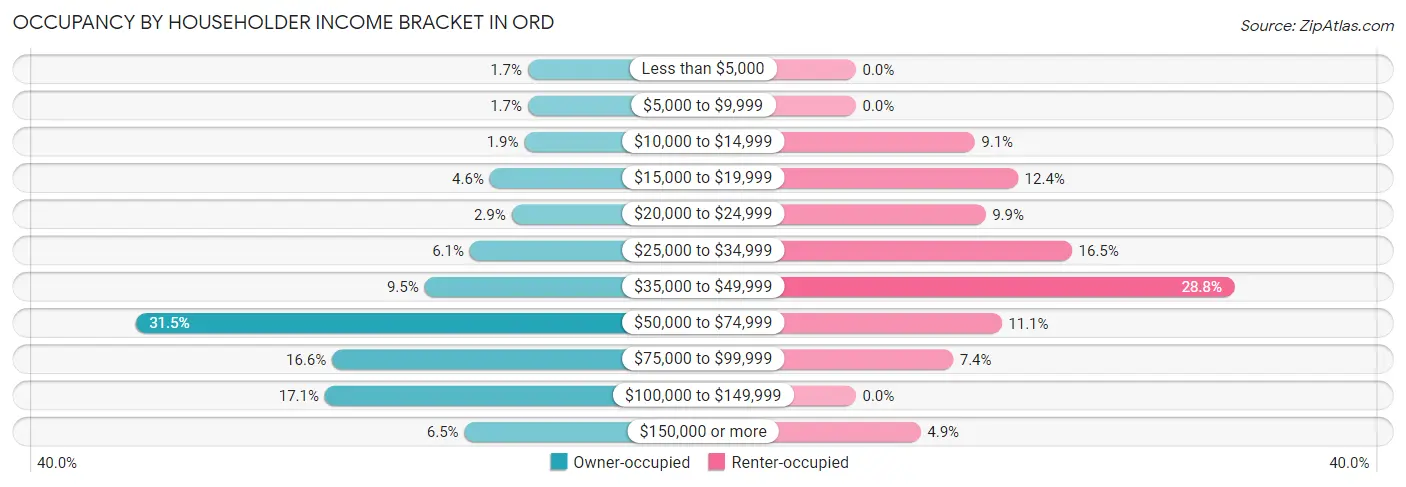
| Income Bracket | Owner-occupied | Renter-occupied |
| Less than $5,000 | 12 (1.7%) | 0 (0.0%) |
| $5,000 to $9,999 | 12 (1.7%) | 0 (0.0%) |
| $10,000 to $14,999 | 14 (1.9%) | 22 (9.0%) |
| $15,000 to $19,999 | 33 (4.6%) | 30 (12.3%) |
| $20,000 to $24,999 | 21 (2.9%) | 24 (9.9%) |
| $25,000 to $34,999 | 44 (6.1%) | 40 (16.5%) |
| $35,000 to $49,999 | 69 (9.5%) | 70 (28.8%) |
| $50,000 to $74,999 | 228 (31.5%) | 27 (11.1%) |
| $75,000 to $99,999 | 120 (16.6%) | 18 (7.4%) |
| $100,000 to $149,999 | 124 (17.1%) | 0 (0.0%) |
| $150,000 or more | 47 (6.5%) | 12 (4.9%) |
| Total | 724 (100.0%) | 243 (100.0%) |
Monthly Housing Cost Tiers in Ord
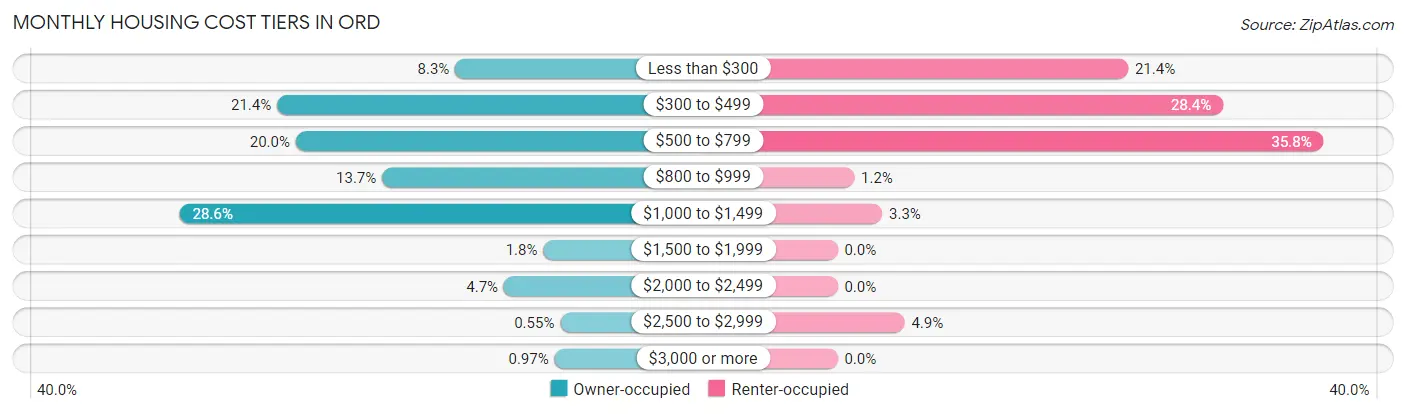
| Monthly Cost | Owner-occupied | Renter-occupied |
| Less than $300 | 60 (8.3%) | 52 (21.4%) |
| $300 to $499 | 155 (21.4%) | 69 (28.4%) |
| $500 to $799 | 145 (20.0%) | 87 (35.8%) |
| $800 to $999 | 99 (13.7%) | 3 (1.2%) |
| $1,000 to $1,499 | 207 (28.6%) | 8 (3.3%) |
| $1,500 to $1,999 | 13 (1.8%) | 0 (0.0%) |
| $2,000 to $2,499 | 34 (4.7%) | 0 (0.0%) |
| $2,500 to $2,999 | 4 (0.5%) | 12 (4.9%) |
| $3,000 or more | 7 (1.0%) | 0 (0.0%) |
| Total | 724 (100.0%) | 243 (100.0%) |
Physical Housing Characteristics in Ord
Housing Structures in Ord
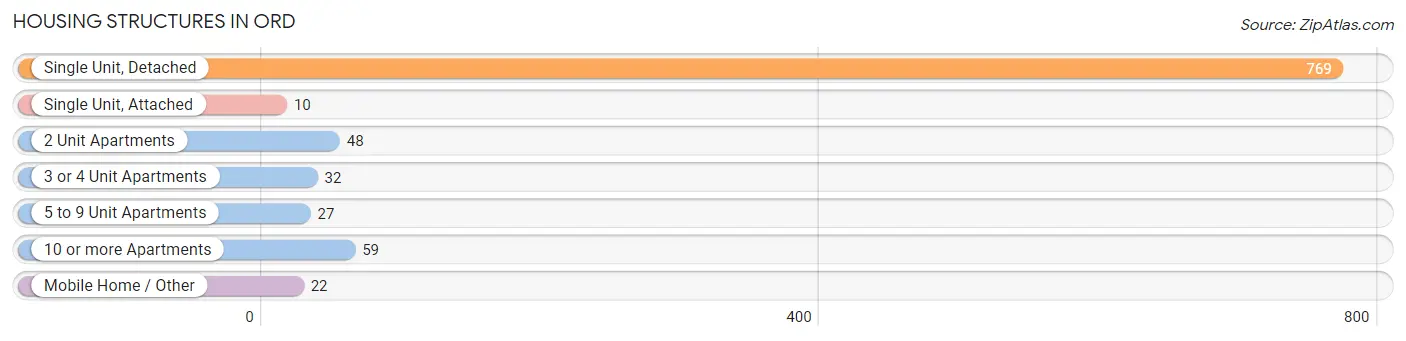
| Structure Type | # Housing Units | % Housing Units |
| Single Unit, Detached | 769 | 79.5% |
| Single Unit, Attached | 10 | 1.0% |
| 2 Unit Apartments | 48 | 5.0% |
| 3 or 4 Unit Apartments | 32 | 3.3% |
| 5 to 9 Unit Apartments | 27 | 2.8% |
| 10 or more Apartments | 59 | 6.1% |
| Mobile Home / Other | 22 | 2.3% |
| Total | 967 | 100.0% |
Housing Structures by Occupancy in Ord
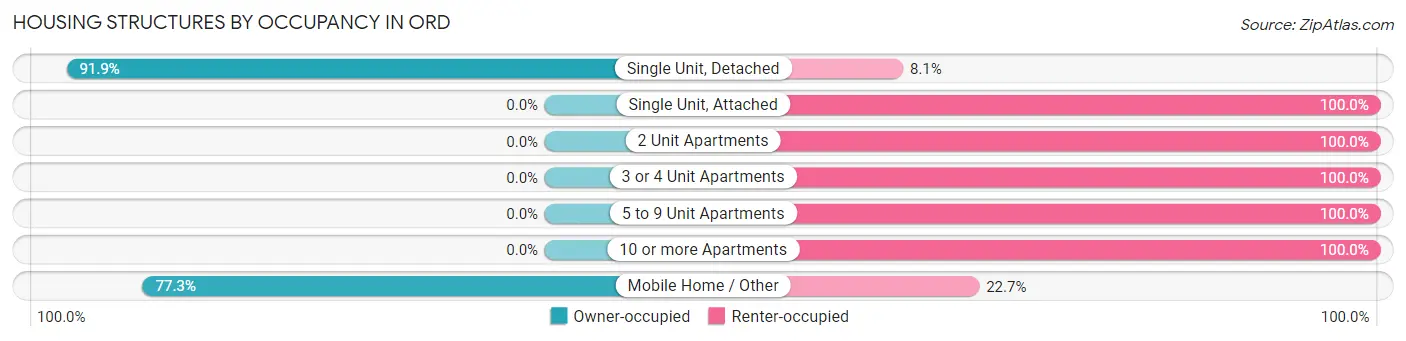
| Structure Type | Owner-occupied | Renter-occupied |
| Single Unit, Detached | 707 (91.9%) | 62 (8.1%) |
| Single Unit, Attached | 0 (0.0%) | 10 (100.0%) |
| 2 Unit Apartments | 0 (0.0%) | 48 (100.0%) |
| 3 or 4 Unit Apartments | 0 (0.0%) | 32 (100.0%) |
| 5 to 9 Unit Apartments | 0 (0.0%) | 27 (100.0%) |
| 10 or more Apartments | 0 (0.0%) | 59 (100.0%) |
| Mobile Home / Other | 17 (77.3%) | 5 (22.7%) |
| Total | 724 (74.9%) | 243 (25.1%) |
Housing Structures by Number of Rooms in Ord
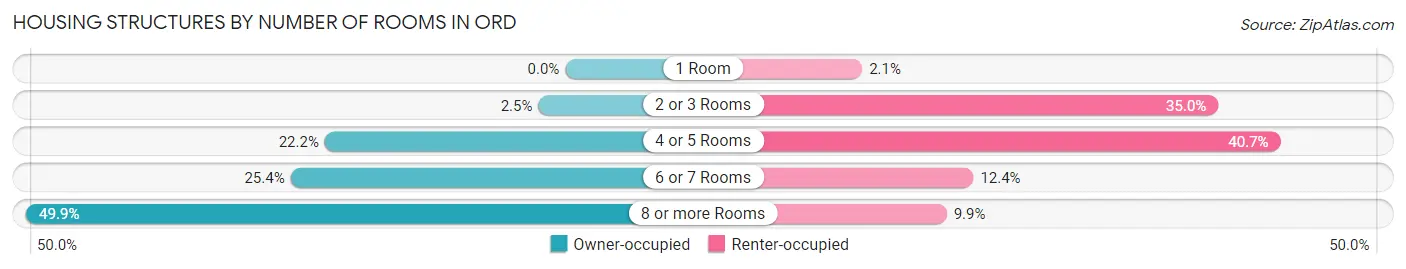
| Number of Rooms | Owner-occupied | Renter-occupied |
| 1 Room | 0 (0.0%) | 5 (2.1%) |
| 2 or 3 Rooms | 18 (2.5%) | 85 (35.0%) |
| 4 or 5 Rooms | 161 (22.2%) | 99 (40.7%) |
| 6 or 7 Rooms | 184 (25.4%) | 30 (12.3%) |
| 8 or more Rooms | 361 (49.9%) | 24 (9.9%) |
| Total | 724 (100.0%) | 243 (100.0%) |
Housing Structure by Heating Type in Ord
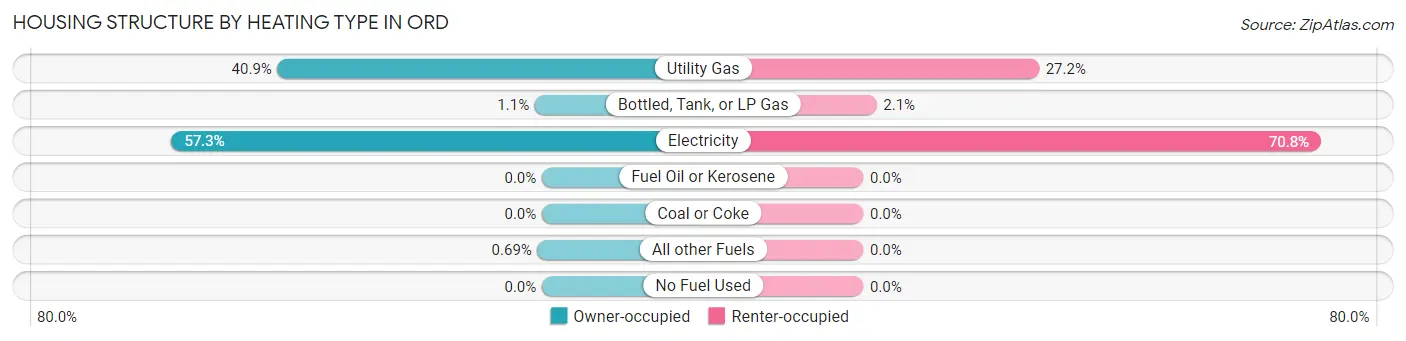
| Heating Type | Owner-occupied | Renter-occupied |
| Utility Gas | 296 (40.9%) | 66 (27.2%) |
| Bottled, Tank, or LP Gas | 8 (1.1%) | 5 (2.1%) |
| Electricity | 415 (57.3%) | 172 (70.8%) |
| Fuel Oil or Kerosene | 0 (0.0%) | 0 (0.0%) |
| Coal or Coke | 0 (0.0%) | 0 (0.0%) |
| All other Fuels | 5 (0.7%) | 0 (0.0%) |
| No Fuel Used | 0 (0.0%) | 0 (0.0%) |
| Total | 724 (100.0%) | 243 (100.0%) |
Household Vehicle Usage in Ord
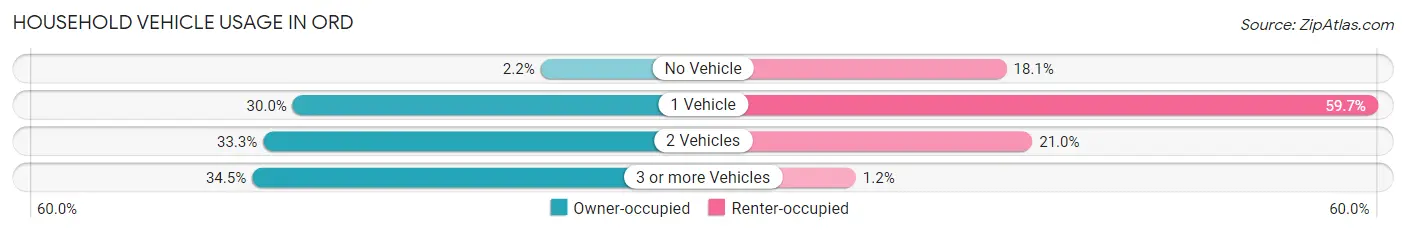
| Vehicles per Household | Owner-occupied | Renter-occupied |
| No Vehicle | 16 (2.2%) | 44 (18.1%) |
| 1 Vehicle | 217 (30.0%) | 145 (59.7%) |
| 2 Vehicles | 241 (33.3%) | 51 (21.0%) |
| 3 or more Vehicles | 250 (34.5%) | 3 (1.2%) |
| Total | 724 (100.0%) | 243 (100.0%) |
Real Estate & Mortgages in Ord
Real Estate and Mortgage Overview in Ord
| Characteristic | Without Mortgage | With Mortgage |
| Housing Units | 301 | 423 |
| Median Property Value | $101,100 | $125,900 |
| Median Household Income | $51,058 | $41 |
| Monthly Housing Costs | $396 | $7 |
| Real Estate Taxes | $1,703 | $14 |
Property Value by Mortgage Status in Ord
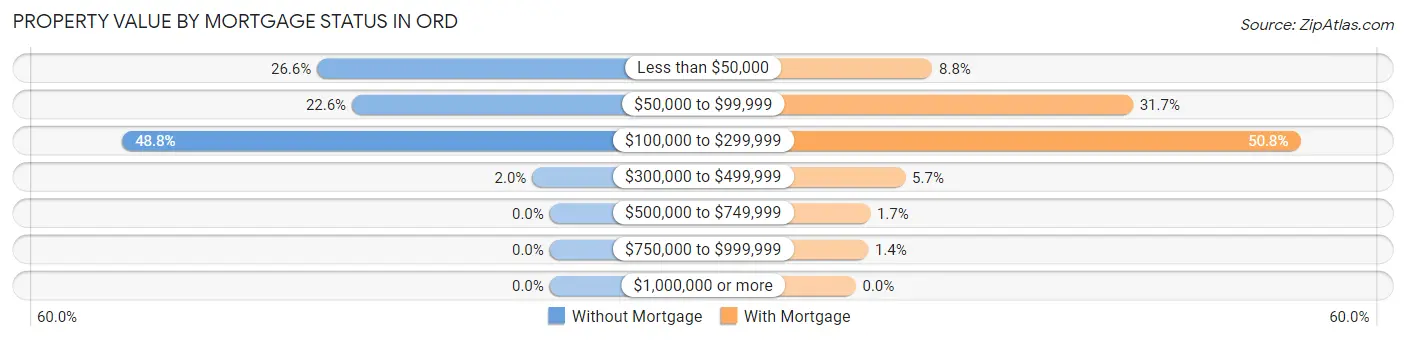
| Property Value | Without Mortgage | With Mortgage |
| Less than $50,000 | 80 (26.6%) | 37 (8.7%) |
| $50,000 to $99,999 | 68 (22.6%) | 134 (31.7%) |
| $100,000 to $299,999 | 147 (48.8%) | 215 (50.8%) |
| $300,000 to $499,999 | 6 (2.0%) | 24 (5.7%) |
| $500,000 to $749,999 | 0 (0.0%) | 7 (1.7%) |
| $750,000 to $999,999 | 0 (0.0%) | 6 (1.4%) |
| $1,000,000 or more | 0 (0.0%) | 0 (0.0%) |
| Total | 301 (100.0%) | 423 (100.0%) |
Household Income by Mortgage Status in Ord
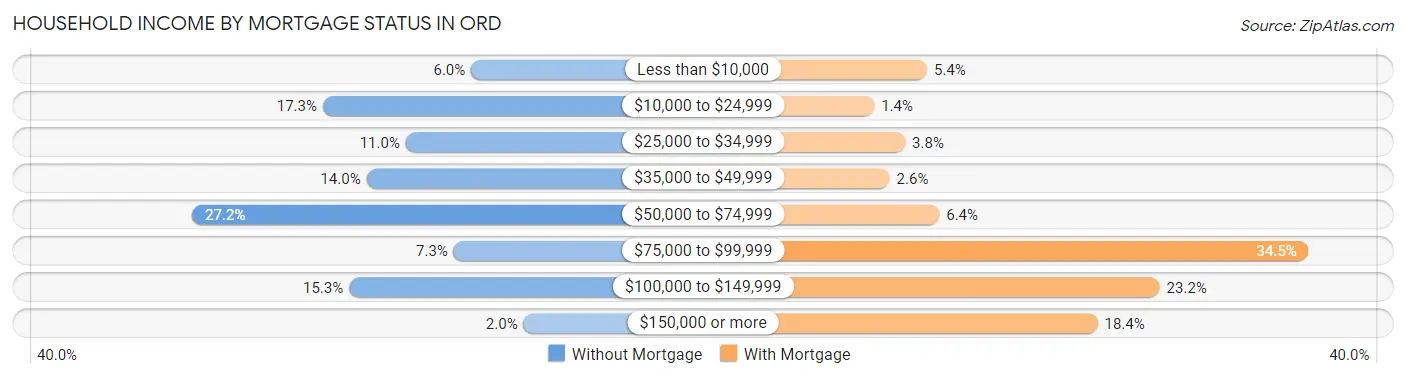
| Household Income | Without Mortgage | With Mortgage |
| Less than $10,000 | 18 (6.0%) | 23 (5.4%) |
| $10,000 to $24,999 | 52 (17.3%) | 6 (1.4%) |
| $25,000 to $34,999 | 33 (11.0%) | 16 (3.8%) |
| $35,000 to $49,999 | 42 (14.0%) | 11 (2.6%) |
| $50,000 to $74,999 | 82 (27.2%) | 27 (6.4%) |
| $75,000 to $99,999 | 22 (7.3%) | 146 (34.5%) |
| $100,000 to $149,999 | 46 (15.3%) | 98 (23.2%) |
| $150,000 or more | 6 (2.0%) | 78 (18.4%) |
| Total | 301 (100.0%) | 423 (100.0%) |
Property Value to Household Income Ratio in Ord
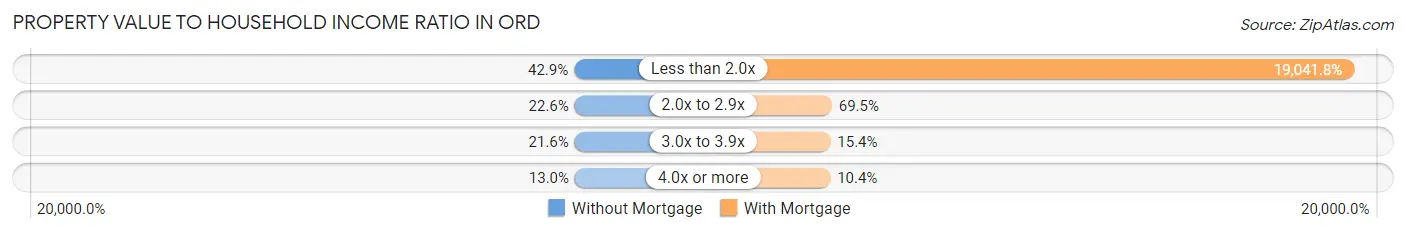
| Value-to-Income Ratio | Without Mortgage | With Mortgage |
| Less than 2.0x | 129 (42.9%) | 80,547 (19,041.8%) |
| 2.0x to 2.9x | 68 (22.6%) | 294 (69.5%) |
| 3.0x to 3.9x | 65 (21.6%) | 65 (15.4%) |
| 4.0x or more | 39 (13.0%) | 44 (10.4%) |
| Total | 301 (100.0%) | 423 (100.0%) |
Real Estate Taxes by Mortgage Status in Ord
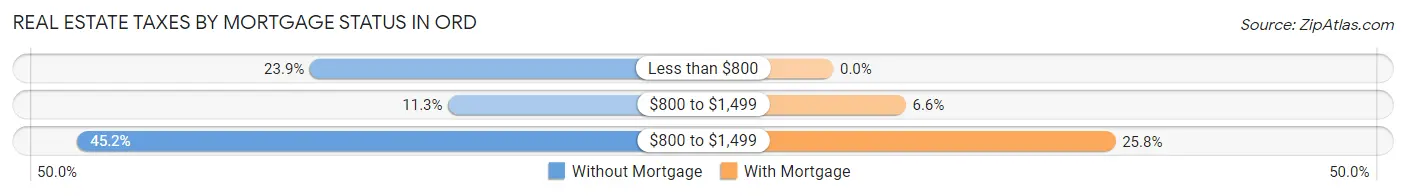
| Property Taxes | Without Mortgage | With Mortgage |
| Less than $800 | 72 (23.9%) | 0 (0.0%) |
| $800 to $1,499 | 34 (11.3%) | 28 (6.6%) |
| $800 to $1,499 | 136 (45.2%) | 109 (25.8%) |
| Total | 301 (100.0%) | 423 (100.0%) |
Health & Disability in Ord
Health Insurance Coverage by Age in Ord
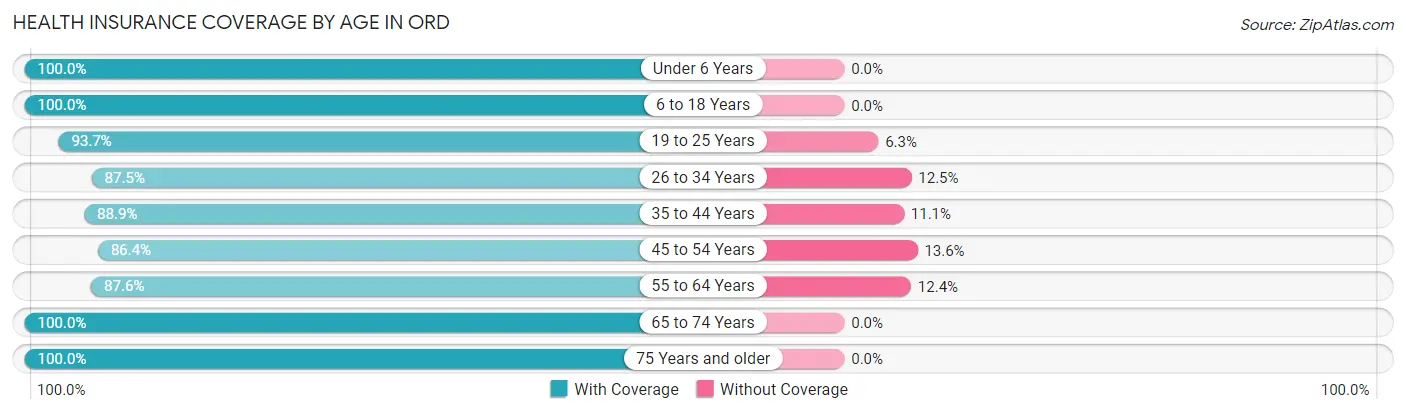
| Age Bracket | With Coverage | Without Coverage |
| Under 6 Years | 170 (100.0%) | 0 (0.0%) |
| 6 to 18 Years | 347 (100.0%) | 0 (0.0%) |
| 19 to 25 Years | 89 (93.7%) | 6 (6.3%) |
| 26 to 34 Years | 203 (87.5%) | 29 (12.5%) |
| 35 to 44 Years | 200 (88.9%) | 25 (11.1%) |
| 45 to 54 Years | 171 (86.4%) | 27 (13.6%) |
| 55 to 64 Years | 268 (87.6%) | 38 (12.4%) |
| 65 to 74 Years | 257 (100.0%) | 0 (0.0%) |
| 75 Years and older | 247 (100.0%) | 0 (0.0%) |
| Total | 1,952 (94.0%) | 125 (6.0%) |
Health Insurance Coverage by Citizenship Status in Ord
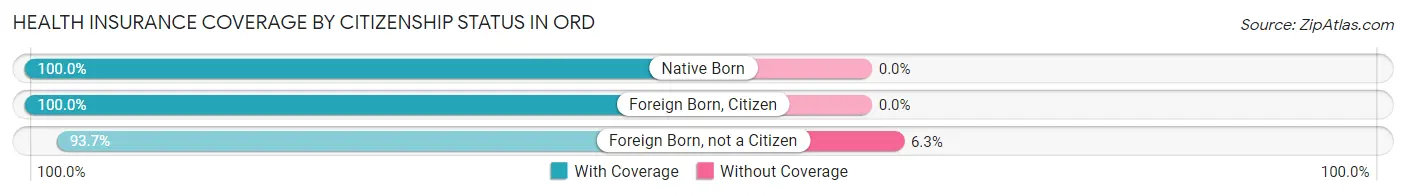
| Citizenship Status | With Coverage | Without Coverage |
| Native Born | 170 (100.0%) | 0 (0.0%) |
| Foreign Born, Citizen | 347 (100.0%) | 0 (0.0%) |
| Foreign Born, not a Citizen | 89 (93.7%) | 6 (6.3%) |
Health Insurance Coverage by Household Income in Ord
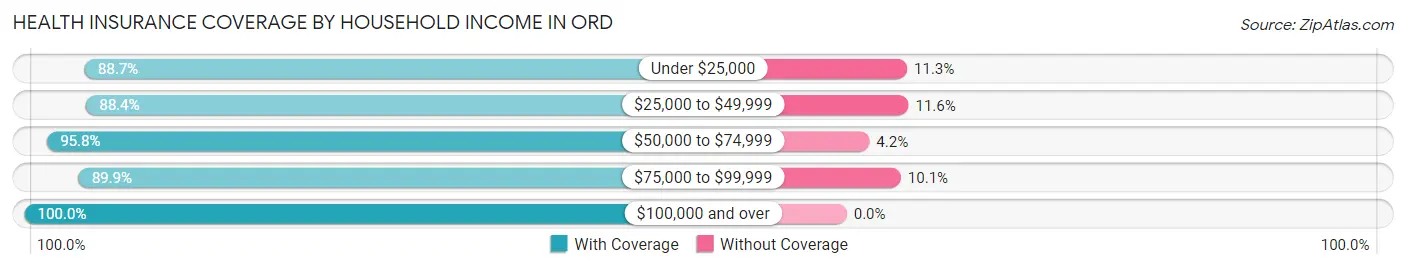
| Household Income | With Coverage | Without Coverage |
| Under $25,000 | 204 (88.7%) | 26 (11.3%) |
| $25,000 to $49,999 | 298 (88.4%) | 39 (11.6%) |
| $50,000 to $74,999 | 587 (95.8%) | 26 (4.2%) |
| $75,000 to $99,999 | 266 (89.9%) | 30 (10.1%) |
| $100,000 and over | 581 (100.0%) | 0 (0.0%) |
Public vs Private Health Insurance Coverage by Age in Ord
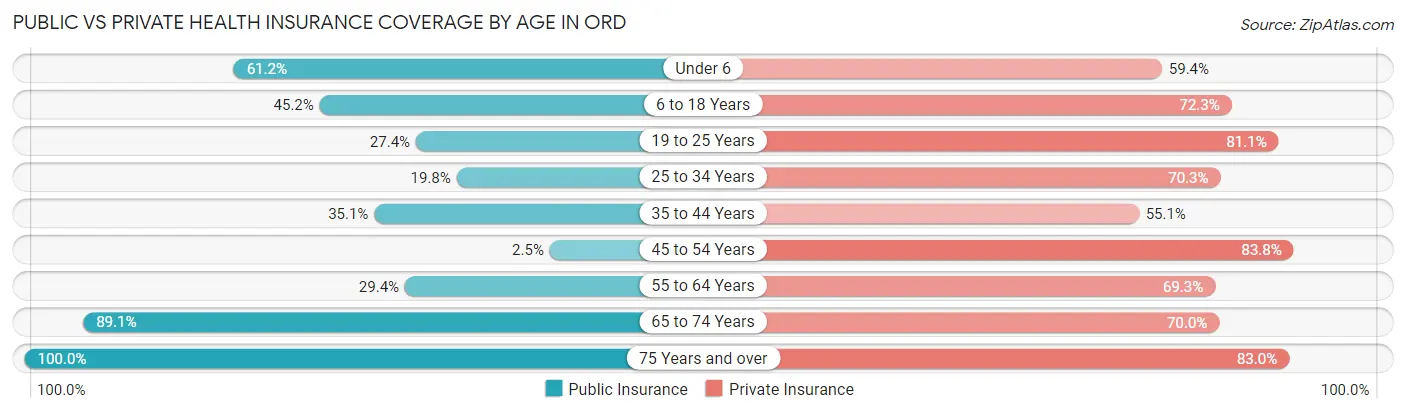
| Age Bracket | Public Insurance | Private Insurance |
| Under 6 | 104 (61.2%) | 101 (59.4%) |
| 6 to 18 Years | 157 (45.2%) | 251 (72.3%) |
| 19 to 25 Years | 26 (27.4%) | 77 (81.0%) |
| 25 to 34 Years | 46 (19.8%) | 163 (70.3%) |
| 35 to 44 Years | 79 (35.1%) | 124 (55.1%) |
| 45 to 54 Years | 5 (2.5%) | 166 (83.8%) |
| 55 to 64 Years | 90 (29.4%) | 212 (69.3%) |
| 65 to 74 Years | 229 (89.1%) | 180 (70.0%) |
| 75 Years and over | 247 (100.0%) | 205 (83.0%) |
| Total | 983 (47.3%) | 1,479 (71.2%) |
Disability Status by Sex by Age in Ord
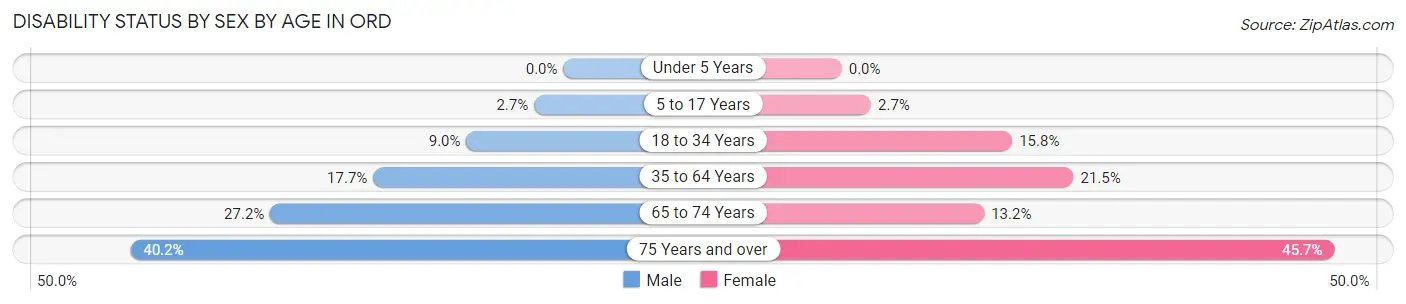
| Age Bracket | Male | Female |
| Under 5 Years | 0 (0.0%) | 0 (0.0%) |
| 5 to 17 Years | 5 (2.7%) | 4 (2.7%) |
| 18 to 34 Years | 19 (9.0%) | 25 (15.8%) |
| 35 to 64 Years | 63 (17.6%) | 80 (21.5%) |
| 65 to 74 Years | 37 (27.2%) | 16 (13.2%) |
| 75 Years and over | 43 (40.2%) | 64 (45.7%) |
Disability Class by Sex by Age in Ord
Disability Class: Hearing Difficulty
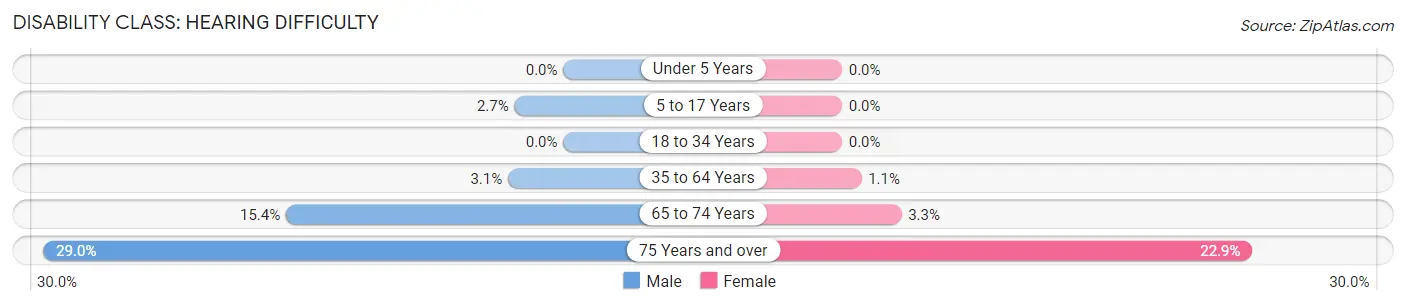
| Age Bracket | Male | Female |
| Under 5 Years | 0 (0.0%) | 0 (0.0%) |
| 5 to 17 Years | 5 (2.7%) | 0 (0.0%) |
| 18 to 34 Years | 0 (0.0%) | 0 (0.0%) |
| 35 to 64 Years | 11 (3.1%) | 4 (1.1%) |
| 65 to 74 Years | 21 (15.4%) | 4 (3.3%) |
| 75 Years and over | 31 (29.0%) | 32 (22.9%) |
Disability Class: Vision Difficulty
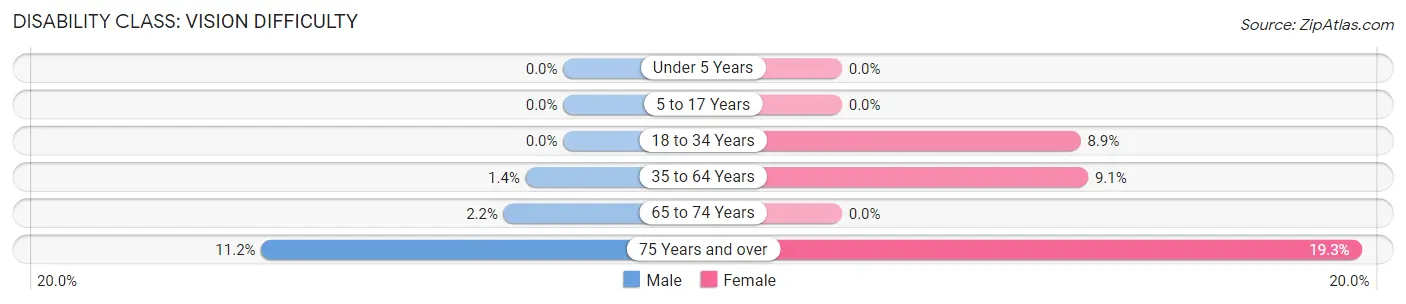
| Age Bracket | Male | Female |
| Under 5 Years | 0 (0.0%) | 0 (0.0%) |
| 5 to 17 Years | 0 (0.0%) | 0 (0.0%) |
| 18 to 34 Years | 0 (0.0%) | 14 (8.9%) |
| 35 to 64 Years | 5 (1.4%) | 34 (9.1%) |
| 65 to 74 Years | 3 (2.2%) | 0 (0.0%) |
| 75 Years and over | 12 (11.2%) | 27 (19.3%) |
Disability Class: Cognitive Difficulty
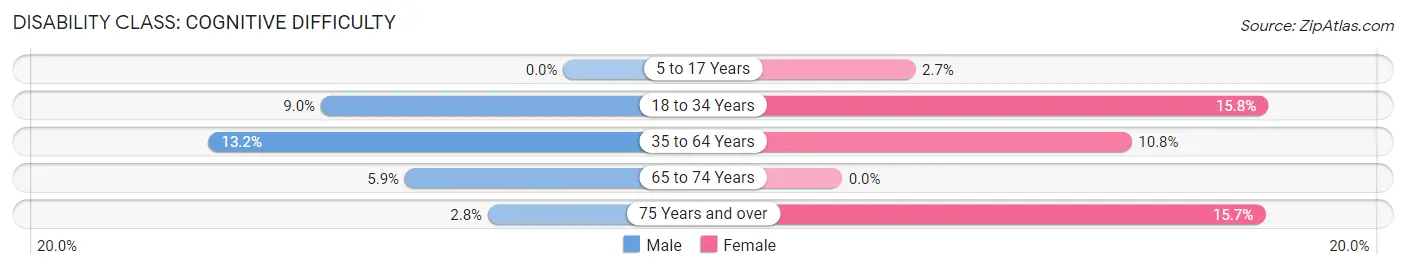
| Age Bracket | Male | Female |
| 5 to 17 Years | 0 (0.0%) | 4 (2.7%) |
| 18 to 34 Years | 19 (9.0%) | 25 (15.8%) |
| 35 to 64 Years | 47 (13.2%) | 40 (10.7%) |
| 65 to 74 Years | 8 (5.9%) | 0 (0.0%) |
| 75 Years and over | 3 (2.8%) | 22 (15.7%) |
Disability Class: Ambulatory Difficulty
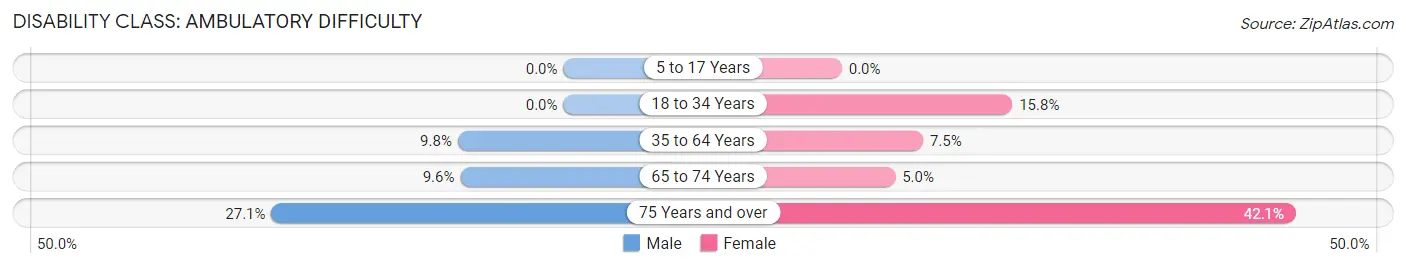
| Age Bracket | Male | Female |
| 5 to 17 Years | 0 (0.0%) | 0 (0.0%) |
| 18 to 34 Years | 0 (0.0%) | 25 (15.8%) |
| 35 to 64 Years | 35 (9.8%) | 28 (7.5%) |
| 65 to 74 Years | 13 (9.6%) | 6 (5.0%) |
| 75 Years and over | 29 (27.1%) | 59 (42.1%) |
Disability Class: Self-Care Difficulty
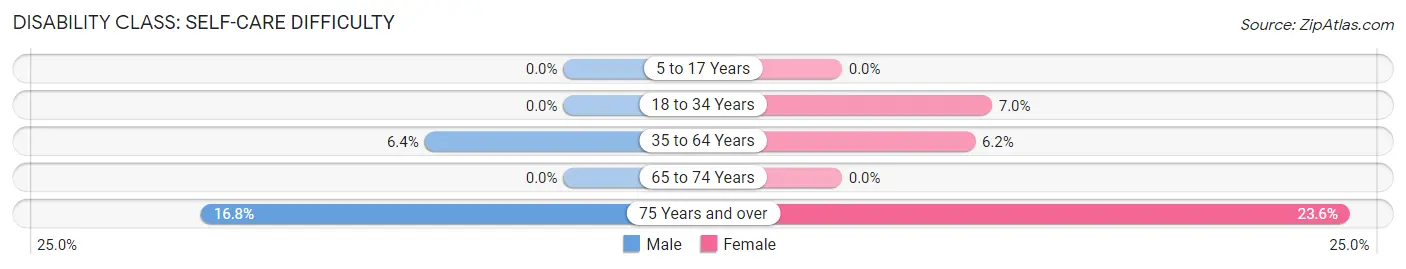
| Age Bracket | Male | Female |
| 5 to 17 Years | 0 (0.0%) | 0 (0.0%) |
| 18 to 34 Years | 0 (0.0%) | 11 (7.0%) |
| 35 to 64 Years | 23 (6.4%) | 23 (6.2%) |
| 65 to 74 Years | 0 (0.0%) | 0 (0.0%) |
| 75 Years and over | 18 (16.8%) | 33 (23.6%) |
Technology Access in Ord
Computing Device Access in Ord
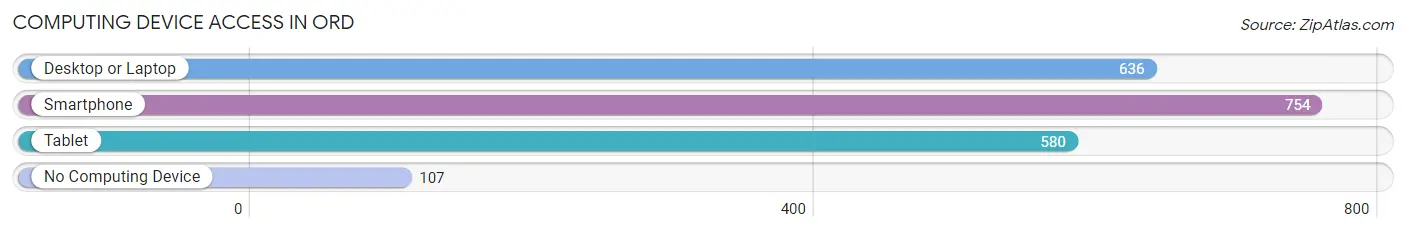
| Device Type | # Households | % Households |
| Desktop or Laptop | 636 | 65.8% |
| Smartphone | 754 | 78.0% |
| Tablet | 580 | 60.0% |
| No Computing Device | 107 | 11.1% |
| Total | 967 | 100.0% |
Internet Access in Ord
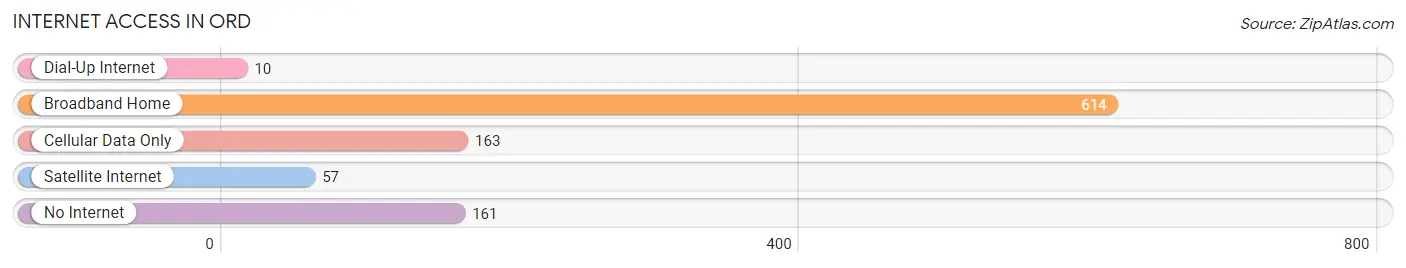
| Internet Type | # Households | % Households |
| Dial-Up Internet | 10 | 1.0% |
| Broadband Home | 614 | 63.5% |
| Cellular Data Only | 163 | 16.9% |
| Satellite Internet | 57 | 5.9% |
| No Internet | 161 | 16.7% |
| Total | 967 | 100.0% |
Ord Summary
History
The state of Nebraska is located in the Midwestern United States and is bordered by South Dakota to the north, Iowa and Missouri to the east, Kansas to the south, and Colorado to the west. Nebraska was admitted to the Union as the 37th state on March 1, 1867. The land that is now Nebraska was acquired by the United States through the Louisiana Purchase in 1803. The area was explored by the Lewis and Clark Expedition in 1804-1806.
The first Europeans to settle in Nebraska were French-Canadian fur traders who established trading posts along the Missouri River in the early 1800s. The first permanent settlement was established in 1823 by the American Fur Company at Bellevue, near present-day Omaha. The first wave of settlers to Nebraska were mostly of German, Irish, and Scandinavian descent.
The Homestead Act of 1862 encouraged settlement of the Great Plains, and Nebraska was opened to homesteaders in 1864. The Union Pacific Railroad was completed in 1867, and the transcontinental railroad was completed in 1869. This opened up the region to further settlement and economic development.
The state of Nebraska was created in 1867, and the capital was established at Omaha. The state was initially divided into two parts, the northern part being called Nebraska Territory and the southern part being called Dakota Territory. The two territories were combined in 1882 to form the state of Nebraska.
Geography
Nebraska is located in the Great Plains region of the United States. It is bordered by South Dakota to the north, Iowa and Missouri to the east, Kansas to the south, and Colorado to the west. The state has an area of 77,354 square miles, making it the 16th largest state in the country.
The landscape of Nebraska is mostly flat, with rolling hills in the east and the High Plains in the west. The state is divided into two distinct regions: the Dissected Till Plains in the east and the Great Plains in the west. The Dissected Till Plains are characterized by rolling hills and deep valleys, while the Great Plains are characterized by flat, grassy plains.
The highest point in Nebraska is Panorama Point, located in the High Plains region of the state. It has an elevation of 5,424 feet above sea level. The lowest point in the state is the Missouri River, which has an elevation of 840 feet above sea level.
Economy
The economy of Nebraska is largely based on agriculture, manufacturing, and services. The state is a major producer of corn, soybeans, wheat, and other grains. Nebraska is also a major producer of beef, pork, and dairy products.
Manufacturing is an important part of the state’s economy, with major industries including food processing, machinery, chemicals, and transportation equipment. The state is also home to a number of technology companies, including Microsoft, Oracle, and Hewlett-Packard.
The service sector is also an important part of the state’s economy, with major industries including finance, insurance, real estate, and health care. Tourism is also an important part of the state’s economy, with major attractions including the Henry Doorly Zoo, the Omaha Children’s Museum, and the Strategic Air Command and Aerospace Museum.
Demographics
As of the 2010 census, the population of Nebraska was 1,826,341. The state has a population density of 24.3 people per square mile, making it the 37th most densely populated state in the country.
The racial makeup of the state is 87.2% White, 4.7% Black or African American, 1.2% Native American, 2.7% Asian, 0.1% Pacific Islander, 2.2% from other races, and 2.7% from two or more races. The largest ancestry groups in the state are German (25.2%), Irish (13.2%), English (11.7%), and Czech (7.2%).
The median household income in Nebraska is $53,906, and the median family income is $67,867. The state has a poverty rate of 11.2%, and the largest industries in the state are agriculture, manufacturing, and services.
Common Questions
What is Per Capita Income in Ord?
Per Capita income in Ord is $30,604.
What is the Median Family Income in Ord?
Median Family Income in Ord is $80,568.
What is the Median Household income in Ord?
Median Household Income in Ord is $56,108.
What is Income or Wage Gap in Ord?
Income or Wage Gap in Ord is 20.7%.
Women in Ord earn 79.3 cents for every dollar earned by a man.
What is Inequality or Gini Index in Ord?
Inequality or Gini Index in Ord is 0.38.
What is the Total Population of Ord?
Total Population of Ord is 2,121.
What is the Total Male Population of Ord?
Total Male Population of Ord is 1,100.
What is the Total Female Population of Ord?
Total Female Population of Ord is 1,021.
What is the Ratio of Males per 100 Females in Ord?
There are 107.74 Males per 100 Females in Ord.
What is the Ratio of Females per 100 Males in Ord?
There are 92.82 Females per 100 Males in Ord.
What is the Median Population Age in Ord?
Median Population Age in Ord is 42.5 Years.
What is the Average Family Size in Ord
Average Family Size in Ord is 2.7 People.
What is the Average Household Size in Ord
Average Household Size in Ord is 2.1 People.
How Large is the Labor Force in Ord?
There are 1,052 People in the Labor Forcein in Ord.
What is the Percentage of People in the Labor Force in Ord?
62.0% of People are in the Labor Force in Ord.
What is the Unemployment Rate in Ord?
Unemployment Rate in Ord is 1.0%.