Zip Codes with the Highest Percentage of Population Employed in Firefighting & Prevention in North Dakota
RELATED REPORTS & OPTIONS
Firefighting & Prevention
North Dakota
Compare Zip Codes
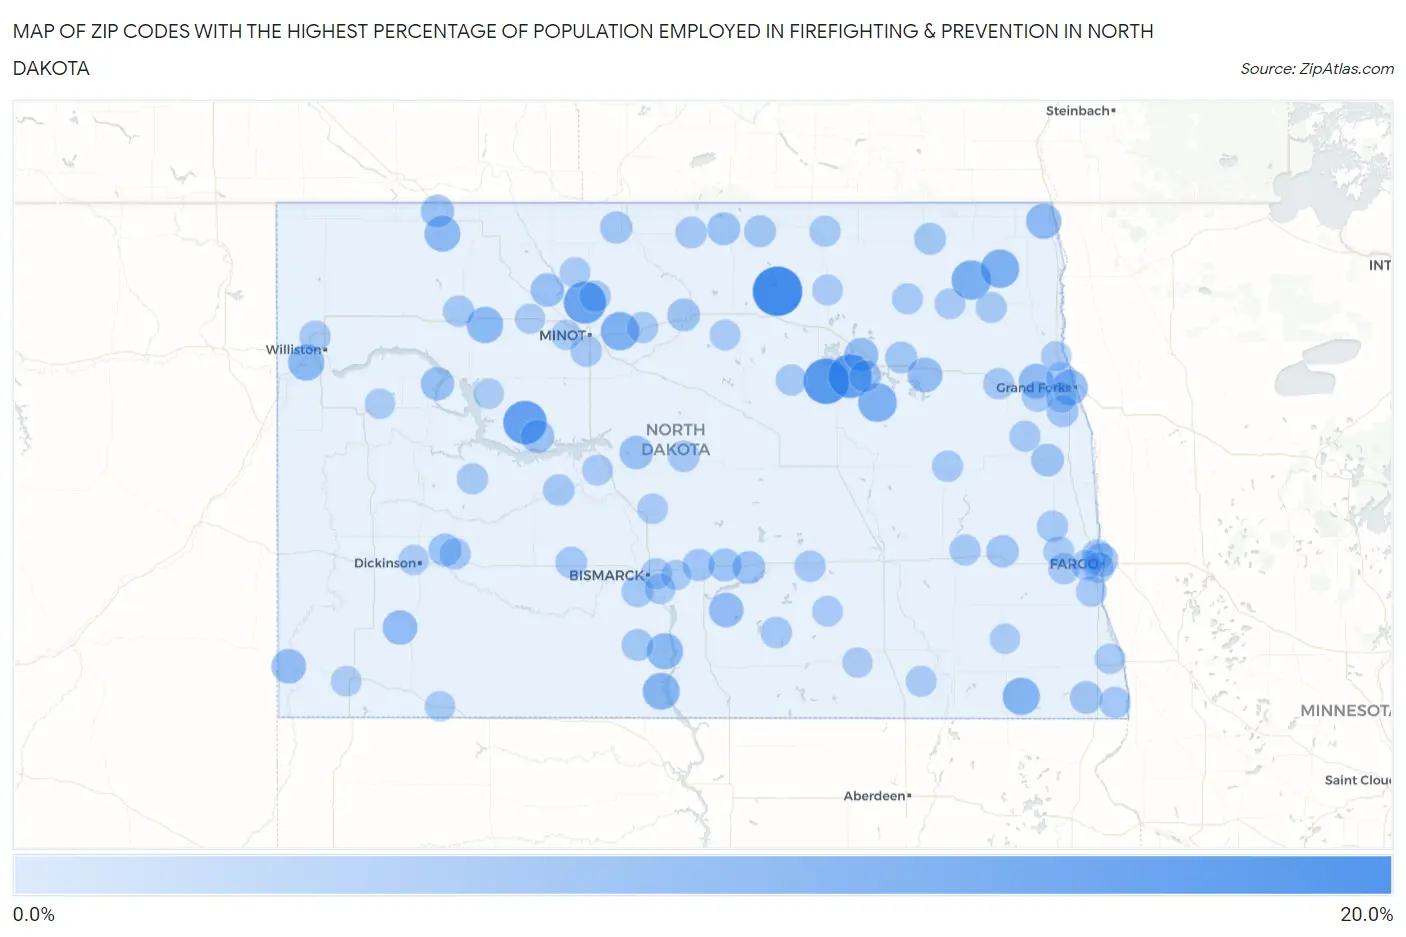
Map of Zip Codes with the Highest Percentage of Population Employed in Firefighting & Prevention in North Dakota
0.0%
20.0%
Zip Codes with the Highest Percentage of Population Employed in Firefighting & Prevention in North Dakota
| Zip Code | % Employed | vs State | vs National | |
| 1. | 58385 | 15.2% | 0.74%(+14.4)#1 | 1.2%(+14.0)#156 |
| 2. | 58357 | 11.9% | 0.74%(+11.2)#2 | 1.2%(+10.7)#230 |
| 3. | 58335 | 10.5% | 0.74%(+9.76)#3 | 1.2%(+9.31)#280 |
| 4. | 58775 | 10.4% | 0.74%(+9.67)#4 | 1.2%(+9.23)#287 |
| 5. | 58704 | 9.4% | 0.74%(+8.65)#5 | 1.2%(+8.21)#331 |
| 6. | 58227 | 7.2% | 0.74%(+6.44)#6 | 1.2%(+6.00)#489 |
| 7. | 58381 | 6.7% | 0.74%(+5.92)#7 | 1.2%(+5.48)#562 |
| 8. | 58768 | 6.5% | 0.74%(+5.80)#8 | 1.2%(+5.36)#584 |
| 9. | 58222 | 6.5% | 0.74%(+5.80)#9 | 1.2%(+5.36)#587 |
| 10. | 58067 | 5.6% | 0.74%(+4.81)#10 | 1.2%(+4.37)#759 |
| 11. | 58538 | 5.3% | 0.74%(+4.54)#11 | 1.2%(+4.09)#810 |
| 12. | 58853 | 4.9% | 0.74%(+4.11)#12 | 1.2%(+3.66)#968 |
| 13. | 58769 | 4.8% | 0.74%(+4.09)#13 | 1.2%(+3.65)#975 |
| 14. | 58528 | 4.8% | 0.74%(+4.02)#14 | 1.2%(+3.58)#1,000 |
| 15. | 58752 | 4.4% | 0.74%(+3.69)#15 | 1.2%(+3.24)#1,139 |
| 16. | 58202 | 4.3% | 0.74%(+3.55)#16 | 1.2%(+3.11)#1,205 |
| 17. | 58271 | 4.1% | 0.74%(+3.33)#17 | 1.2%(+2.89)#1,307 |
| 18. | 58204 | 3.8% | 0.74%(+3.07)#18 | 1.2%(+2.63)#1,459 |
| 19. | 58344 | 3.7% | 0.74%(+2.91)#19 | 1.2%(+2.47)#1,593 |
| 20. | 58647 | 3.6% | 0.74%(+2.84)#20 | 1.2%(+2.40)#1,653 |
| 21. | 58643 | 3.6% | 0.74%(+2.83)#21 | 1.2%(+2.39)#1,662 |
| 22. | 58524 | 3.6% | 0.74%(+2.83)#22 | 1.2%(+2.39)#1,664 |
| 23. | 58301 | 3.2% | 0.74%(+2.50)#23 | 1.2%(+2.06)#1,968 |
| 24. | 58105 | 2.9% | 0.74%(+2.12)#24 | 1.2%(+1.68)#2,449 |
| 25. | 58725 | 2.8% | 0.74%(+2.09)#25 | 1.2%(+1.64)#2,507 |
| 26. | 58575 | 2.8% | 0.74%(+2.08)#26 | 1.2%(+1.64)#2,521 |
| 27. | 58540 | 2.7% | 0.74%(+1.98)#27 | 1.2%(+1.53)#2,692 |
| 28. | 58763 | 2.6% | 0.74%(+1.88)#28 | 1.2%(+1.44)#2,841 |
| 29. | 58772 | 2.4% | 0.74%(+1.66)#29 | 1.2%(+1.22)#3,309 |
| 30. | 58329 | 2.3% | 0.74%(+1.58)#30 | 1.2%(+1.13)#3,520 |
| 31. | 58630 | 2.3% | 0.74%(+1.57)#31 | 1.2%(+1.13)#3,526 |
| 32. | 58532 | 2.3% | 0.74%(+1.56)#32 | 1.2%(+1.12)#3,542 |
| 33. | 58482 | 2.3% | 0.74%(+1.55)#33 | 1.2%(+1.11)#3,573 |
| 34. | 58257 | 2.2% | 0.74%(+1.46)#34 | 1.2%(+1.02)#3,840 |
| 35. | 58788 | 2.2% | 0.74%(+1.44)#35 | 1.2%(+0.999)#3,918 |
| 36. | 58041 | 2.1% | 0.74%(+1.34)#36 | 1.2%(+0.904)#4,183 |
| 37. | 58071 | 1.9% | 0.74%(+1.19)#37 | 1.2%(+0.745)#4,785 |
| 38. | 58793 | 1.8% | 0.74%(+1.05)#38 | 1.2%(+0.613)#5,365 |
| 39. | 58572 | 1.7% | 0.74%(+0.999)#39 | 1.2%(+0.558)#5,610 |
| 40. | 58249 | 1.5% | 0.74%(+0.757)#40 | 1.2%(+0.317)#6,953 |
| 41. | 58327 | 1.5% | 0.74%(+0.755)#41 | 1.2%(+0.314)#6,971 |
| 42. | 58316 | 1.5% | 0.74%(+0.719)#42 | 1.2%(+0.278)#7,212 |
| 43. | 58570 | 1.4% | 0.74%(+0.644)#43 | 1.2%(+0.203)#7,721 |
| 44. | 58278 | 1.4% | 0.74%(+0.633)#44 | 1.2%(+0.192)#7,789 |
| 45. | 58463 | 1.3% | 0.74%(+0.602)#45 | 1.2%(+0.161)#8,008 |
| 46. | 58554 | 1.3% | 0.74%(+0.598)#46 | 1.2%(+0.157)#8,038 |
| 47. | 58740 | 1.3% | 0.74%(+0.564)#47 | 1.2%(+0.123)#8,284 |
| 48. | 58318 | 1.3% | 0.74%(+0.526)#48 | 1.2%(+0.085)#8,587 |
| 49. | 58370 | 1.3% | 0.74%(+0.509)#49 | 1.2%(+0.068)#8,723 |
| 50. | 58561 | 1.2% | 0.74%(+0.490)#50 | 1.2%(+0.049)#8,855 |
| 51. | 58563 | 1.2% | 0.74%(+0.480)#51 | 1.2%(+0.039)#8,939 |
| 52. | 58545 | 1.2% | 0.74%(+0.425)#52 | 1.2%(-0.016)#9,417 |
| 53. | 58251 | 1.2% | 0.74%(+0.418)#53 | 1.2%(-0.023)#9,476 |
| 54. | 58656 | 1.2% | 0.74%(+0.418)#54 | 1.2%(-0.023)#9,480 |
| 55. | 58467 | 1.1% | 0.74%(+0.391)#55 | 1.2%(-0.049)#9,763 |
| 56. | 58784 | 1.1% | 0.74%(+0.377)#56 | 1.2%(-0.064)#9,909 |
| 57. | 58030 | 1.1% | 0.74%(+0.370)#57 | 1.2%(-0.071)#9,960 |
| 58. | 58701 | 1.1% | 0.74%(+0.368)#58 | 1.2%(-0.073)#9,988 |
| 59. | 58741 | 1.1% | 0.74%(+0.333)#59 | 1.2%(-0.108)#10,300 |
| 60. | 58102 | 1.0% | 0.74%(+0.301)#60 | 1.2%(-0.140)#10,629 |
| 61. | 58228 | 0.98% | 0.74%(+0.231)#61 | 1.2%(-0.210)#11,357 |
| 62. | 58348 | 0.96% | 0.74%(+0.217)#62 | 1.2%(-0.224)#11,518 |
| 63. | 58365 | 0.95% | 0.74%(+0.208)#63 | 1.2%(-0.233)#11,623 |
| 64. | 58636 | 0.95% | 0.74%(+0.203)#64 | 1.2%(-0.238)#11,665 |
| 65. | 58501 | 0.92% | 0.74%(+0.176)#65 | 1.2%(-0.265)#11,930 |
| 66. | 58059 | 0.91% | 0.74%(+0.168)#66 | 1.2%(-0.273)#12,009 |
| 67. | 58006 | 0.91% | 0.74%(+0.168)#67 | 1.2%(-0.273)#12,011 |
| 68. | 58801 | 0.91% | 0.74%(+0.163)#68 | 1.2%(-0.278)#12,090 |
| 69. | 58240 | 0.90% | 0.74%(+0.156)#69 | 1.2%(-0.285)#12,157 |
| 70. | 58425 | 0.90% | 0.74%(+0.151)#70 | 1.2%(-0.290)#12,211 |
| 71. | 58270 | 0.89% | 0.74%(+0.148)#71 | 1.2%(-0.293)#12,237 |
| 72. | 58072 | 0.87% | 0.74%(+0.121)#72 | 1.2%(-0.320)#12,517 |
| 73. | 58330 | 0.85% | 0.74%(+0.106)#73 | 1.2%(-0.335)#12,659 |
| 74. | 58103 | 0.78% | 0.74%(+0.035)#74 | 1.2%(-0.406)#13,441 |
| 75. | 58210 | 0.74% | 0.74%(-0.004)#75 | 1.2%(-0.445)#13,870 |
| 76. | 58441 | 0.74% | 0.74%(-0.010)#76 | 1.2%(-0.450)#13,924 |
| 77. | 58324 | 0.72% | 0.74%(-0.020)#77 | 1.2%(-0.461)#14,048 |
| 78. | 58576 | 0.72% | 0.74%(-0.025)#78 | 1.2%(-0.466)#14,105 |
| 79. | 58201 | 0.69% | 0.74%(-0.055)#79 | 1.2%(-0.496)#14,470 |
| 80. | 58203 | 0.67% | 0.74%(-0.078)#80 | 1.2%(-0.519)#14,700 |
| 81. | 58078 | 0.65% | 0.74%(-0.094)#81 | 1.2%(-0.535)#14,890 |
| 82. | 58368 | 0.64% | 0.74%(-0.110)#82 | 1.2%(-0.550)#15,052 |
| 83. | 58504 | 0.60% | 0.74%(-0.143)#83 | 1.2%(-0.584)#15,396 |
| 84. | 58579 | 0.60% | 0.74%(-0.150)#84 | 1.2%(-0.591)#15,467 |
| 85. | 58047 | 0.59% | 0.74%(-0.152)#85 | 1.2%(-0.593)#15,493 |
| 86. | 58012 | 0.58% | 0.74%(-0.162)#86 | 1.2%(-0.603)#15,607 |
| 87. | 58442 | 0.54% | 0.74%(-0.201)#87 | 1.2%(-0.642)#16,029 |
| 88. | 58750 | 0.54% | 0.74%(-0.207)#88 | 1.2%(-0.648)#16,101 |
| 89. | 58623 | 0.49% | 0.74%(-0.255)#89 | 1.2%(-0.696)#16,671 |
| 90. | 58256 | 0.47% | 0.74%(-0.272)#90 | 1.2%(-0.713)#16,853 |
| 91. | 58075 | 0.46% | 0.74%(-0.281)#91 | 1.2%(-0.722)#16,950 |
| 92. | 58639 | 0.46% | 0.74%(-0.286)#92 | 1.2%(-0.727)#17,002 |
| 93. | 58854 | 0.43% | 0.74%(-0.319)#93 | 1.2%(-0.760)#17,366 |
| 94. | 58770 | 0.42% | 0.74%(-0.321)#94 | 1.2%(-0.762)#17,381 |
| 95. | 58558 | 0.39% | 0.74%(-0.359)#95 | 1.2%(-0.800)#17,815 |
| 96. | 58601 | 0.38% | 0.74%(-0.364)#96 | 1.2%(-0.805)#17,884 |
| 97. | 58722 | 0.38% | 0.74%(-0.365)#97 | 1.2%(-0.806)#17,887 |
| 98. | 58054 | 0.36% | 0.74%(-0.390)#98 | 1.2%(-0.831)#18,165 |
| 99. | 58456 | 0.35% | 0.74%(-0.395)#99 | 1.2%(-0.836)#18,240 |
| 100. | 58718 | 0.34% | 0.74%(-0.403)#100 | 1.2%(-0.844)#18,333 |
Common Questions
What are the Top 10 Zip Codes with the Highest Percentage of Population Employed in Firefighting & Prevention in North Dakota?
Top 10 Zip Codes with the Highest Percentage of Population Employed in Firefighting & Prevention in North Dakota are:
What zip code has the Highest Percentage of Population Employed in Firefighting & Prevention in North Dakota?
58385 has the Highest Percentage of Population Employed in Firefighting & Prevention in North Dakota with 15.2%.
What is the Percentage of Population Employed in Firefighting & Prevention in the State of North Dakota?
Percentage of Population Employed in Firefighting & Prevention in North Dakota is 0.74%.
What is the Percentage of Population Employed in Firefighting & Prevention in the United States?
Percentage of Population Employed in Firefighting & Prevention in the United States is 1.2%.