Hollenberg, KS Map & Demographics
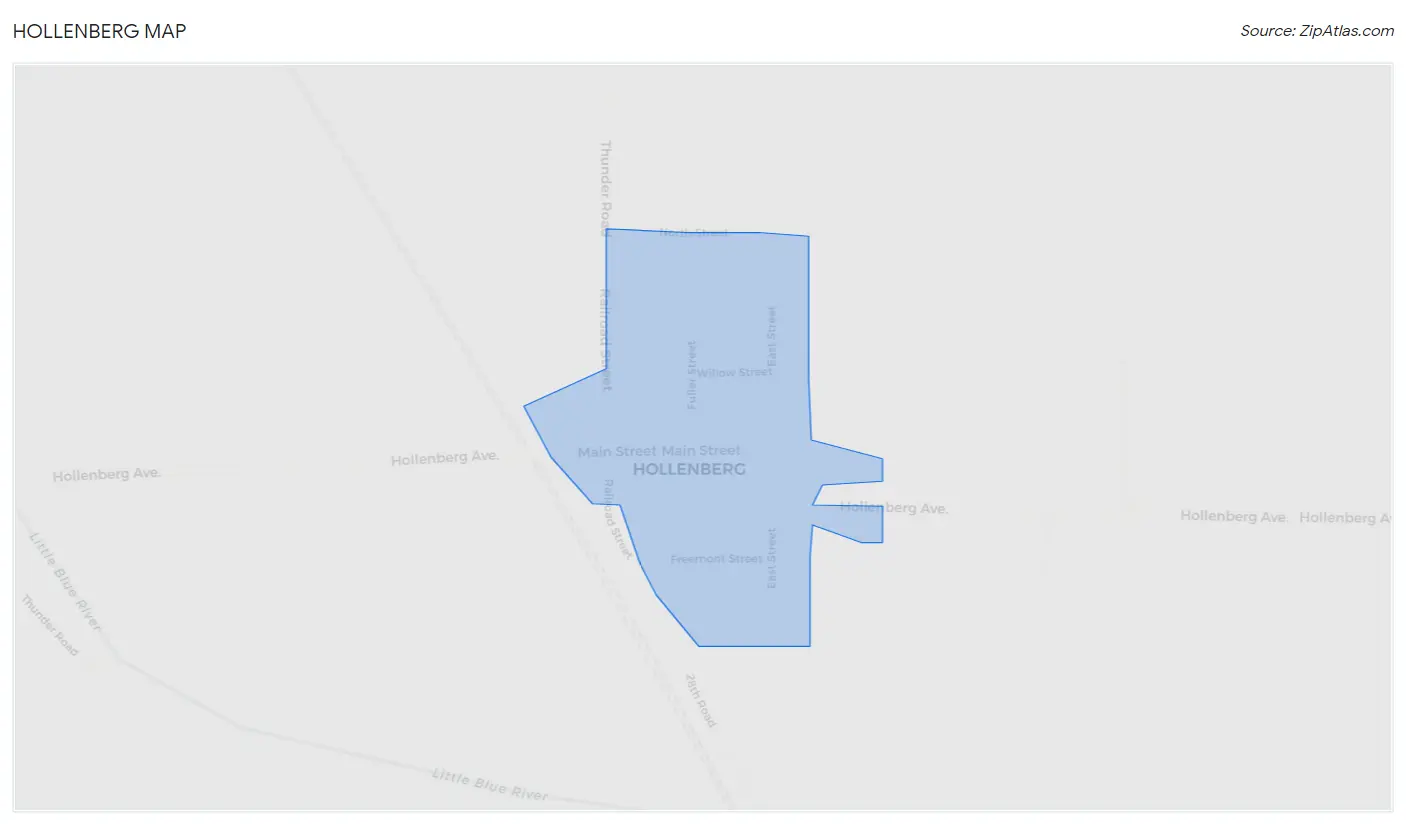
Hollenberg Map
Hollenberg Overview
$33,642
PER CAPITA INCOME
$47,778
AVG HOUSEHOLD INCOME
0.27
INEQUALITY / GINI INDEX
19
TOTAL POPULATION
13
MALE POPULATION
6
FEMALE POPULATION
216.67
MALES / 100 FEMALES
46.15
FEMALES / 100 MALES
63.4
MEDIAN AGE
2.0
AVG FAMILY SIZE
1.1
AVG HOUSEHOLD SIZE
9
LABOR FORCE [ PEOPLE ]
47.4%
PERCENT IN LABOR FORCE
Hollenberg Zip Codes
Hollenberg Area Codes
Income in Hollenberg
Income Overview in Hollenberg
| Characteristic | Number | Measure |
| Per Capita Income | 19 | $33,642 |
| Median Family Income | 1 | $0 |
| Mean Family Income | 1 | $0 |
| Median Household Income | 18 | $47,778 |
| Mean Household Income | 18 | $35,511 |
| Income Deficit | 1 | $0 |
| Wage / Income Gap (%) | 19 | 0.00% |
| Wage / Income Gap ($) | 19 | 100.00¢ per $1 |
| Gini / Inequality Index | 19 | 0.27 |
Earnings by Sex in Hollenberg
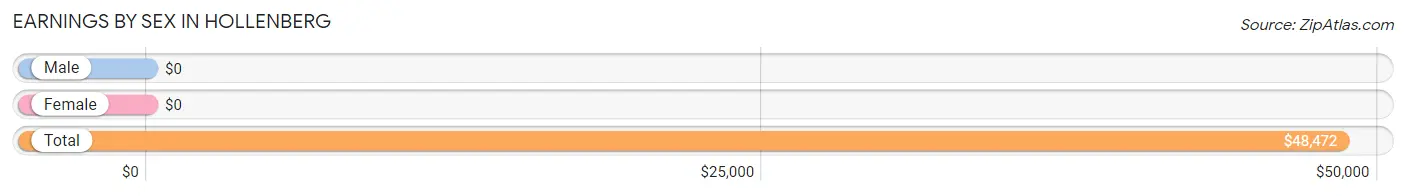
| Sex | Number | Average Earnings |
| Male | 10 (90.9%) | $0 |
| Female | 1 (9.1%) | $0 |
| Total | 11 (100.0%) | $48,472 |
Earnings by Sex by Income Bracket in Hollenberg
The most common earnings brackets in Hollenberg are $45,000 to $49,999 for men (9 | 90.0%) and $2,499 or less for women (1 | 100.0%).
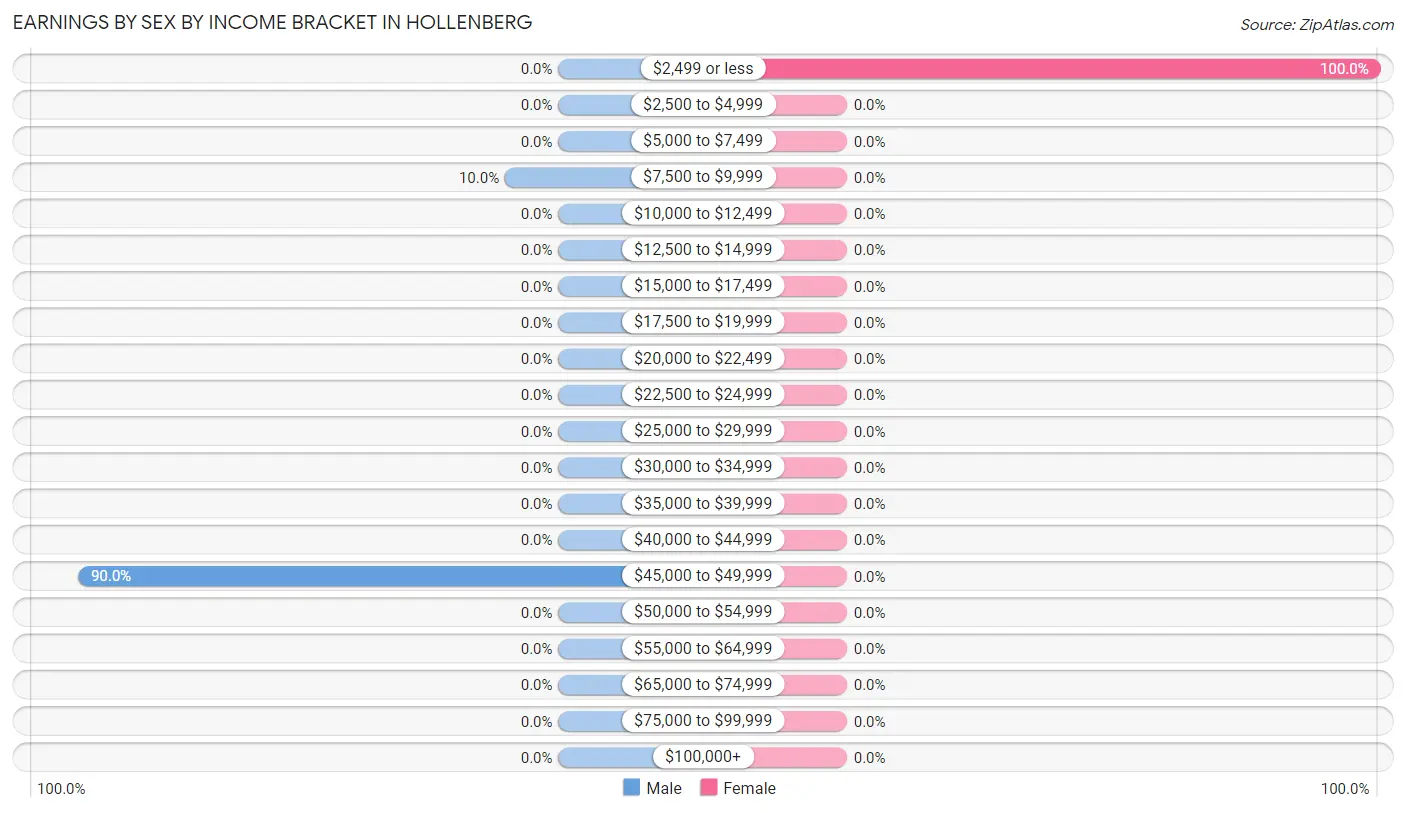
| Income | Male | Female |
| $2,499 or less | 0 (0.0%) | 1 (100.0%) |
| $2,500 to $4,999 | 0 (0.0%) | 0 (0.0%) |
| $5,000 to $7,499 | 0 (0.0%) | 0 (0.0%) |
| $7,500 to $9,999 | 1 (10.0%) | 0 (0.0%) |
| $10,000 to $12,499 | 0 (0.0%) | 0 (0.0%) |
| $12,500 to $14,999 | 0 (0.0%) | 0 (0.0%) |
| $15,000 to $17,499 | 0 (0.0%) | 0 (0.0%) |
| $17,500 to $19,999 | 0 (0.0%) | 0 (0.0%) |
| $20,000 to $22,499 | 0 (0.0%) | 0 (0.0%) |
| $22,500 to $24,999 | 0 (0.0%) | 0 (0.0%) |
| $25,000 to $29,999 | 0 (0.0%) | 0 (0.0%) |
| $30,000 to $34,999 | 0 (0.0%) | 0 (0.0%) |
| $35,000 to $39,999 | 0 (0.0%) | 0 (0.0%) |
| $40,000 to $44,999 | 0 (0.0%) | 0 (0.0%) |
| $45,000 to $49,999 | 9 (90.0%) | 0 (0.0%) |
| $50,000 to $54,999 | 0 (0.0%) | 0 (0.0%) |
| $55,000 to $64,999 | 0 (0.0%) | 0 (0.0%) |
| $65,000 to $74,999 | 0 (0.0%) | 0 (0.0%) |
| $75,000 to $99,999 | 0 (0.0%) | 0 (0.0%) |
| $100,000+ | 0 (0.0%) | 0 (0.0%) |
| Total | 10 (100.0%) | 1 (100.0%) |
Earnings by Sex by Educational Attainment in Hollenberg
| Educational Attainment | Male Income | Female Income |
| Less than High School | - | - |
| High School Diploma | - | - |
| College or Associate's Degree | - | - |
| Bachelor's Degree | - | - |
| Graduate Degree | - | - |
| Total | - | - |
Family Income in Hollenberg
Family Income Brackets in Hollenberg
According to the Hollenberg family income data, there are 1 families falling into the $50,000 to $74,999 income range, which is the most common income bracket and makes up 100.0% of all families.
| Income Bracket | # Families | % Families |
| Less than $10,000 | 0 | 0.0% |
| $10,000 to $14,999 | 0 | 0.0% |
| $15,000 to $24,999 | 0 | 0.0% |
| $25,000 to $34,999 | 0 | 0.0% |
| $35,000 to $49,999 | 0 | 0.0% |
| $50,000 to $74,999 | 1 | 100.0% |
| $75,000 to $99,999 | 0 | 0.0% |
| $100,000 to $149,999 | 0 | 0.0% |
| $150,000 to $199,999 | 0 | 0.0% |
| $200,000+ | 0 | 0.0% |
Family Income by Famaliy Size in Hollenberg
| Income Bracket | # Families | Median Income |
| 2-Person Families | 1 (100.0%) | $0 |
| 3-Person Families | 0 (0.0%) | $0 |
| 4-Person Families | 0 (0.0%) | $0 |
| 5-Person Families | 0 (0.0%) | $0 |
| 6-Person Families | 0 (0.0%) | $0 |
| 7+ Person Families | 0 (0.0%) | $0 |
| Total | 1 (100.0%) | $0 |
Family Income by Number of Earners in Hollenberg
| Number of Earners | # Families | Median Income |
| No Earners | 0 (0.0%) | $0 |
| 1 Earner | 0 (0.0%) | $0 |
| 2 Earners | 1 (100.0%) | $0 |
| 3+ Earners | 0 (0.0%) | $0 |
| Total | 1 (100.0%) | $0 |
Household Income in Hollenberg
Household Income Brackets in Hollenberg
With 9 households falling in the category, the $35,000 to $49,999 income range is the most frequent in Hollenberg, accounting for 50.0% of all households.
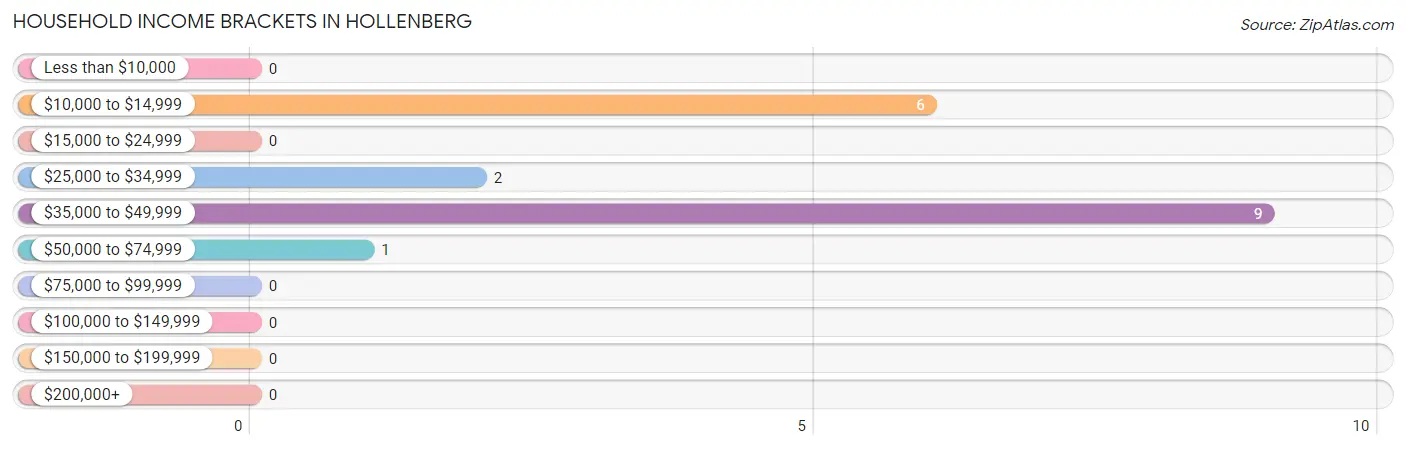
| Income Bracket | # Households | % Households |
| Less than $10,000 | 0 | 0.0% |
| $10,000 to $14,999 | 6 | 33.3% |
| $15,000 to $24,999 | 0 | 0.0% |
| $25,000 to $34,999 | 2 | 11.1% |
| $35,000 to $49,999 | 9 | 50.0% |
| $50,000 to $74,999 | 1 | 5.6% |
| $75,000 to $99,999 | 0 | 0.0% |
| $100,000 to $149,999 | 0 | 0.0% |
| $150,000 to $199,999 | 0 | 0.0% |
| $200,000+ | 0 | 0.0% |
Household Income by Householder Age in Hollenberg
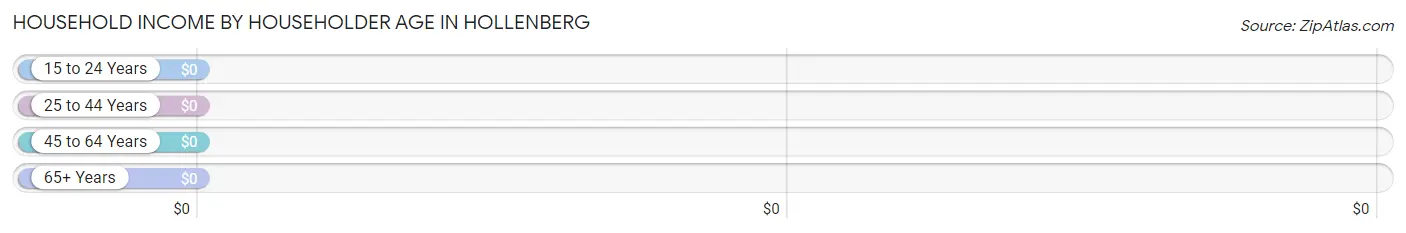
| Income Bracket | # Households | Median Income |
| 15 to 24 Years | 0 (0.0%) | $0 |
| 25 to 44 Years | 0 (0.0%) | $0 |
| 45 to 64 Years | 15 (83.3%) | $0 |
| 65+ Years | 3 (16.7%) | $0 |
| Total | 18 (100.0%) | $47,778 |
Poverty in Hollenberg
Income Below Poverty by Sex and Age in Hollenberg
With 23.1% poverty level for males and 50.0% for females among the residents of Hollenberg, 55 to 64 year old males and 55 to 64 year old females are the most vulnerable to poverty, with 3 males (25.0%) and 3 females (100.0%) in their respective age groups living below the poverty level.
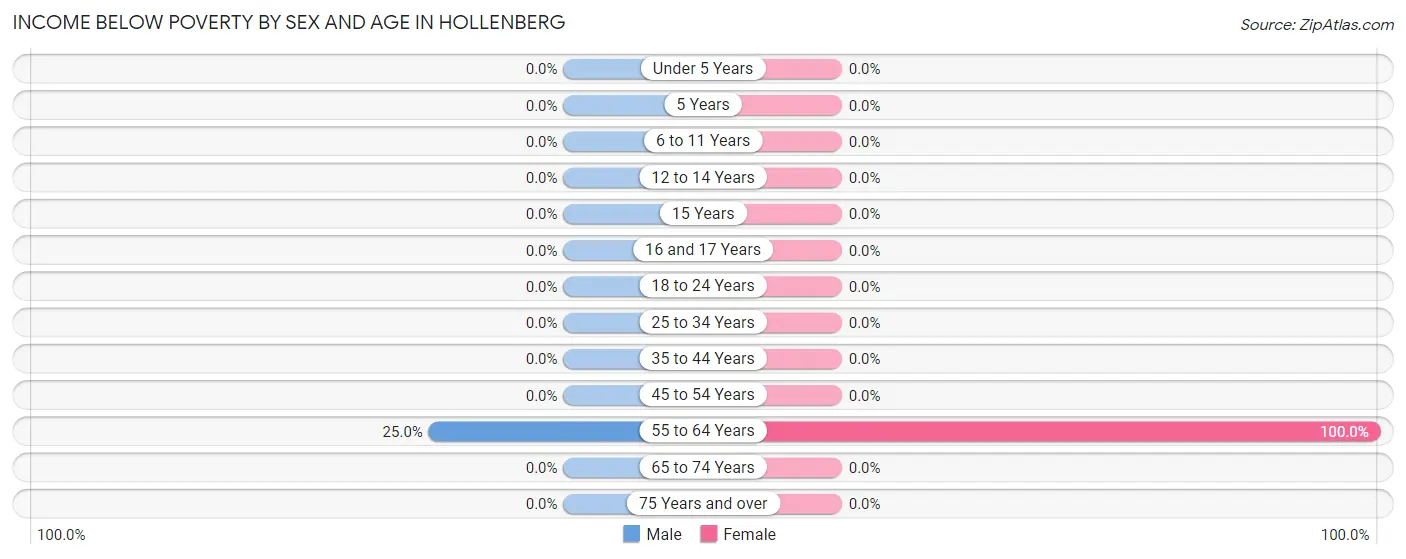
| Age Bracket | Male | Female |
| Under 5 Years | 0 (0.0%) | 0 (0.0%) |
| 5 Years | 0 (0.0%) | 0 (0.0%) |
| 6 to 11 Years | 0 (0.0%) | 0 (0.0%) |
| 12 to 14 Years | 0 (0.0%) | 0 (0.0%) |
| 15 Years | 0 (0.0%) | 0 (0.0%) |
| 16 and 17 Years | 0 (0.0%) | 0 (0.0%) |
| 18 to 24 Years | 0 (0.0%) | 0 (0.0%) |
| 25 to 34 Years | 0 (0.0%) | 0 (0.0%) |
| 35 to 44 Years | 0 (0.0%) | 0 (0.0%) |
| 45 to 54 Years | 0 (0.0%) | 0 (0.0%) |
| 55 to 64 Years | 3 (25.0%) | 3 (100.0%) |
| 65 to 74 Years | 0 (0.0%) | 0 (0.0%) |
| 75 Years and over | 0 (0.0%) | 0 (0.0%) |
| Total | 3 (23.1%) | 3 (50.0%) |
Income Above Poverty by Sex and Age in Hollenberg
According to the poverty statistics in Hollenberg, males aged 65 to 74 years and females aged 65 to 74 years are the age groups that are most secure financially, with 100.0% of males and 100.0% of females in these age groups living above the poverty line.
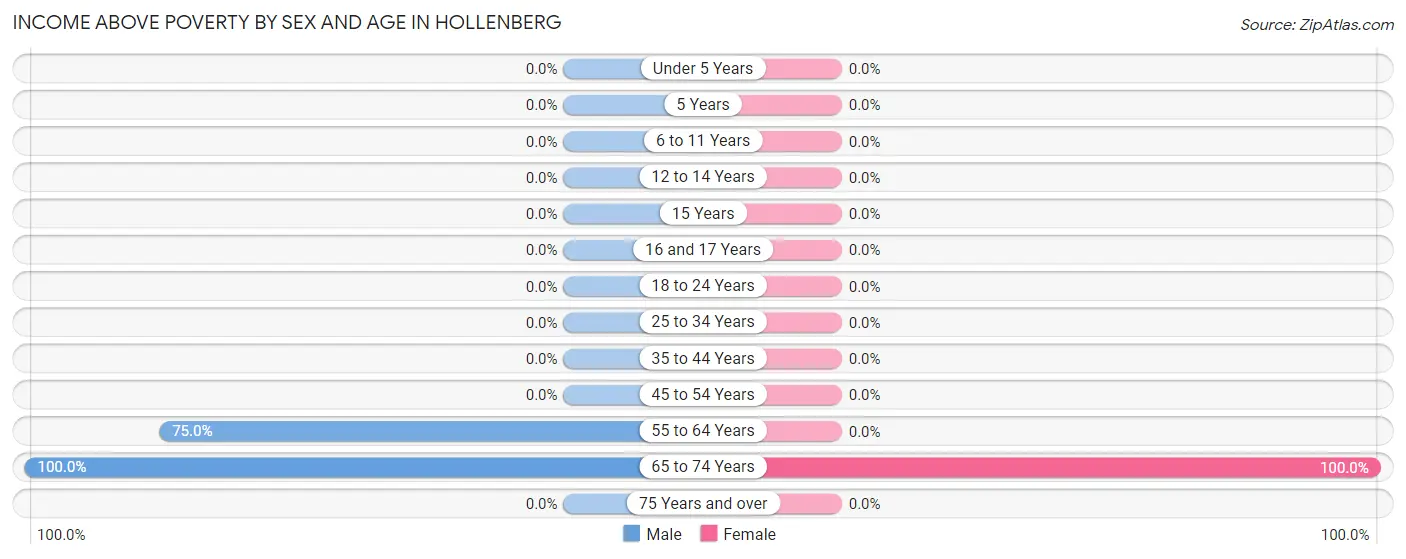
| Age Bracket | Male | Female |
| Under 5 Years | 0 (0.0%) | 0 (0.0%) |
| 5 Years | 0 (0.0%) | 0 (0.0%) |
| 6 to 11 Years | 0 (0.0%) | 0 (0.0%) |
| 12 to 14 Years | 0 (0.0%) | 0 (0.0%) |
| 15 Years | 0 (0.0%) | 0 (0.0%) |
| 16 and 17 Years | 0 (0.0%) | 0 (0.0%) |
| 18 to 24 Years | 0 (0.0%) | 0 (0.0%) |
| 25 to 34 Years | 0 (0.0%) | 0 (0.0%) |
| 35 to 44 Years | 0 (0.0%) | 0 (0.0%) |
| 45 to 54 Years | 0 (0.0%) | 0 (0.0%) |
| 55 to 64 Years | 9 (75.0%) | 0 (0.0%) |
| 65 to 74 Years | 1 (100.0%) | 3 (100.0%) |
| 75 Years and over | 0 (0.0%) | 0 (0.0%) |
| Total | 10 (76.9%) | 3 (50.0%) |
Income Below Poverty Among Married-Couple Families in Hollenberg
| Children | Above Poverty | Below Poverty |
| No Children | 1 (100.0%) | 0 (0.0%) |
| 1 or 2 Children | 0 (0.0%) | 0 (0.0%) |
| 3 or 4 Children | 0 (0.0%) | 0 (0.0%) |
| 5 or more Children | 0 (0.0%) | 0 (0.0%) |
| Total | 1 (100.0%) | 0 (0.0%) |
Income Below Poverty Among Single-Parent Households in Hollenberg
| Children | Single Father | Single Mother |
| No Children | 0 (0.0%) | 0 (0.0%) |
| 1 or 2 Children | 0 (0.0%) | 0 (0.0%) |
| 3 or 4 Children | 0 (0.0%) | 0 (0.0%) |
| 5 or more Children | 0 (0.0%) | 0 (0.0%) |
| Total | 0 (0.0%) | 0 (0.0%) |
Income Below Poverty Among Married-Couple vs Single-Parent Households in Hollenberg
| Children | Married-Couple Families | Single-Parent Households |
| No Children | 0 (0.0%) | 0 (0.0%) |
| 1 or 2 Children | 0 (0.0%) | 0 (0.0%) |
| 3 or 4 Children | 0 (0.0%) | 0 (0.0%) |
| 5 or more Children | 0 (0.0%) | 0 (0.0%) |
| Total | 0 (0.0%) | 0 (0.0%) |
Race in Hollenberg
The most populous races in Hollenberg are White / Caucasian (17 | 89.5%), and Two or more Races (2 | 10.5%).
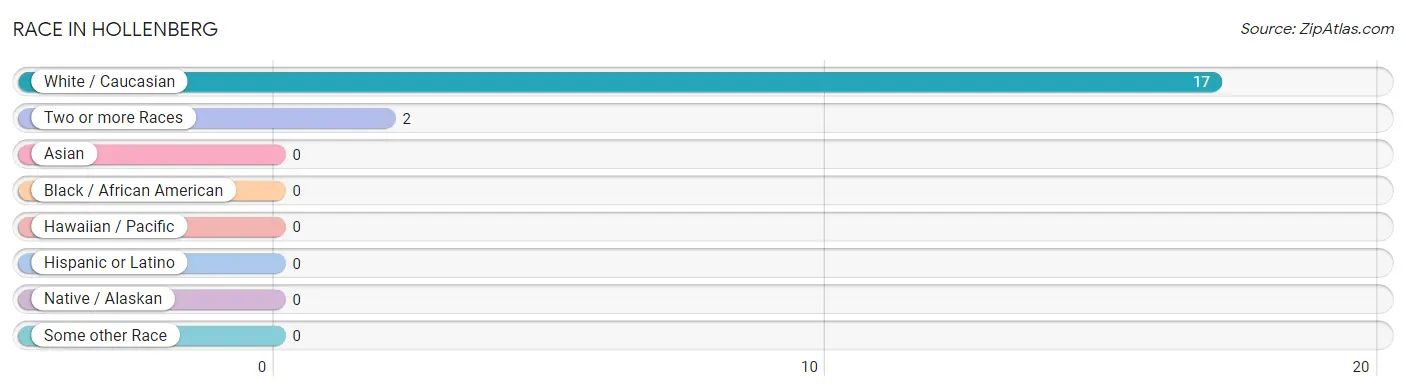
| Race | # Population | % Population |
| Asian | 0 | 0.0% |
| Black / African American | 0 | 0.0% |
| Hawaiian / Pacific | 0 | 0.0% |
| Hispanic or Latino | 0 | 0.0% |
| Native / Alaskan | 0 | 0.0% |
| White / Caucasian | 17 | 89.5% |
| Two or more Races | 2 | 10.5% |
| Some other Race | 0 | 0.0% |
| Total | 19 | 100.0% |
Ancestry in Hollenberg
The most populous ancestries reported in Hollenberg are Irish (11 | 57.9%), Swedish (9 | 47.4%), English (3 | 15.8%), German (3 | 15.8%), and Cherokee (2 | 10.5%), together accounting for 147.4% of all Hollenberg residents.
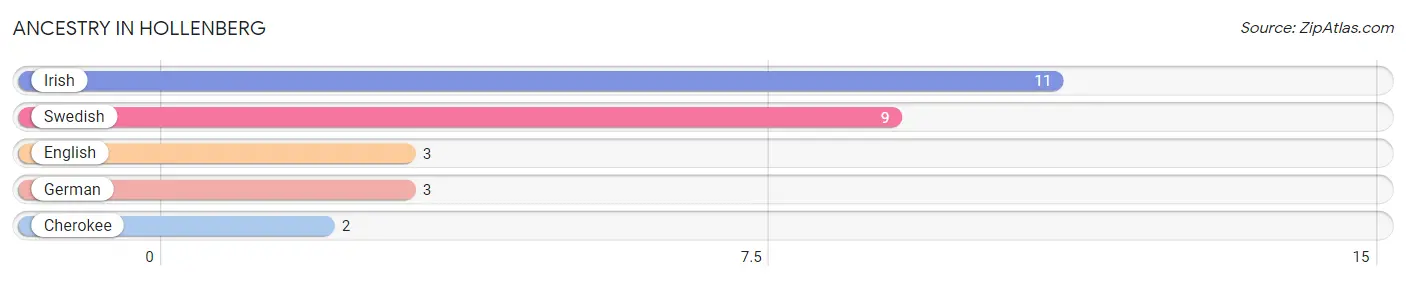
| Ancestry | # Population | % Population |
| Cherokee | 2 | 10.5% |
| English | 3 | 15.8% |
| German | 3 | 15.8% |
| Irish | 11 | 57.9% |
| Swedish | 9 | 47.4% | View All 5 Rows |
Immigrants in Hollenberg

| Immigration Origin | # Population | % Population | View All 0 Rows |
Sex and Age in Hollenberg
Sex and Age in Hollenberg
The most populous age groups in Hollenberg are 60 to 64 Years (9 | 69.2%) for men and 55 to 59 Years (3 | 50.0%) for women.
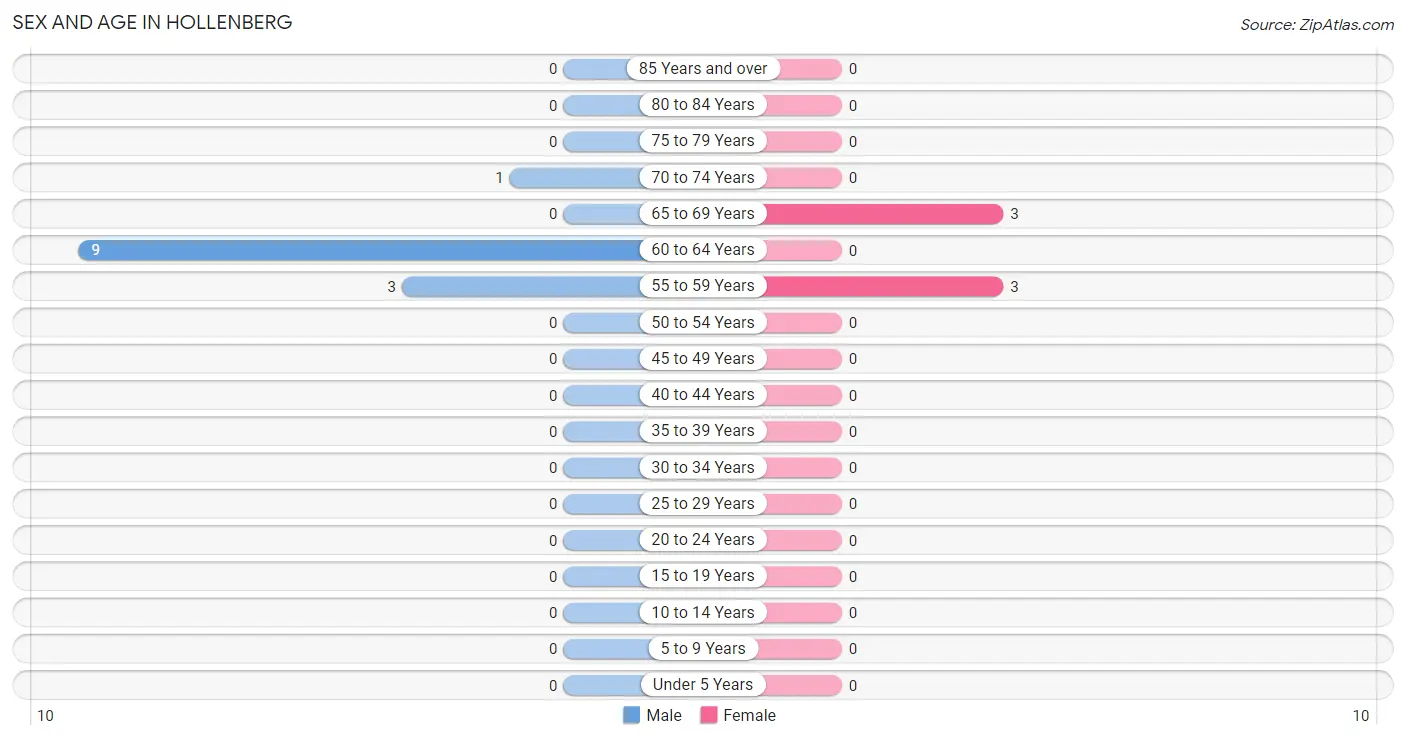
| Age Bracket | Male | Female |
| Under 5 Years | 0 (0.0%) | 0 (0.0%) |
| 5 to 9 Years | 0 (0.0%) | 0 (0.0%) |
| 10 to 14 Years | 0 (0.0%) | 0 (0.0%) |
| 15 to 19 Years | 0 (0.0%) | 0 (0.0%) |
| 20 to 24 Years | 0 (0.0%) | 0 (0.0%) |
| 25 to 29 Years | 0 (0.0%) | 0 (0.0%) |
| 30 to 34 Years | 0 (0.0%) | 0 (0.0%) |
| 35 to 39 Years | 0 (0.0%) | 0 (0.0%) |
| 40 to 44 Years | 0 (0.0%) | 0 (0.0%) |
| 45 to 49 Years | 0 (0.0%) | 0 (0.0%) |
| 50 to 54 Years | 0 (0.0%) | 0 (0.0%) |
| 55 to 59 Years | 3 (23.1%) | 3 (50.0%) |
| 60 to 64 Years | 9 (69.2%) | 0 (0.0%) |
| 65 to 69 Years | 0 (0.0%) | 3 (50.0%) |
| 70 to 74 Years | 1 (7.7%) | 0 (0.0%) |
| 75 to 79 Years | 0 (0.0%) | 0 (0.0%) |
| 80 to 84 Years | 0 (0.0%) | 0 (0.0%) |
| 85 Years and over | 0 (0.0%) | 0 (0.0%) |
| Total | 13 (100.0%) | 6 (100.0%) |
Families and Households in Hollenberg
Median Family Size in Hollenberg
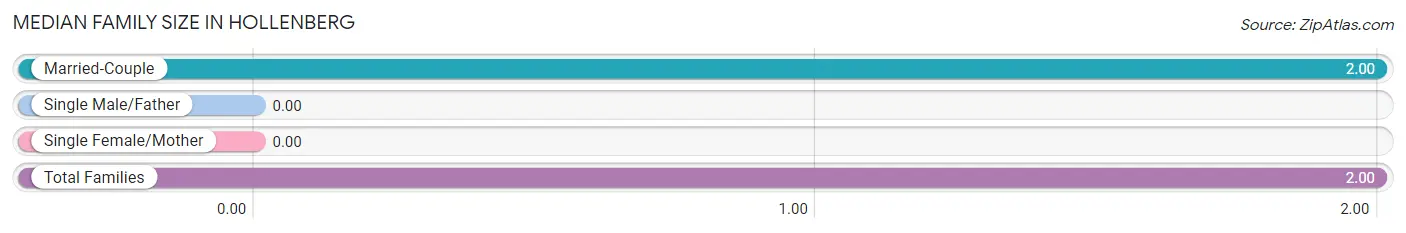
| Family Type | # Families | Family Size |
| Married-Couple | 1 (100.0%) | 2.00 |
| Single Male/Father | 0 (0.0%) | - |
| Single Female/Mother | 0 (0.0%) | - |
| Total Families | 1 (100.0%) | 2.00 |
Median Household Size in Hollenberg
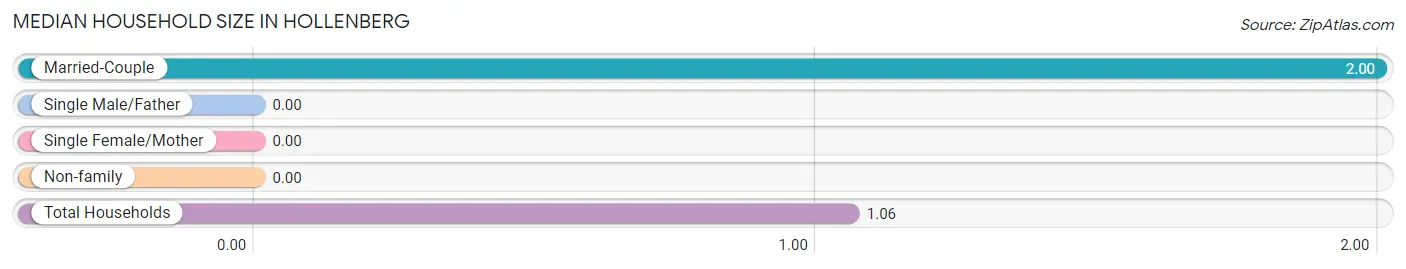
| Household Type | # Households | Household Size |
| Married-Couple | 1 (5.6%) | 2.00 |
| Single Male/Father | 0 (0.0%) | - |
| Single Female/Mother | 0 (0.0%) | - |
| Non-family | 17 (94.4%) | - |
| Total Households | 18 (100.0%) | 1.06 |
Household Size by Marriage Status in Hollenberg
Out of a total of 18 households in Hollenberg, 1 (5.6%) are family households, while 17 (94.4%) are nonfamily households. The most numerous type of family households are 2-person households, comprising 1, and the most common type of nonfamily households are 1-person households, comprising 17.
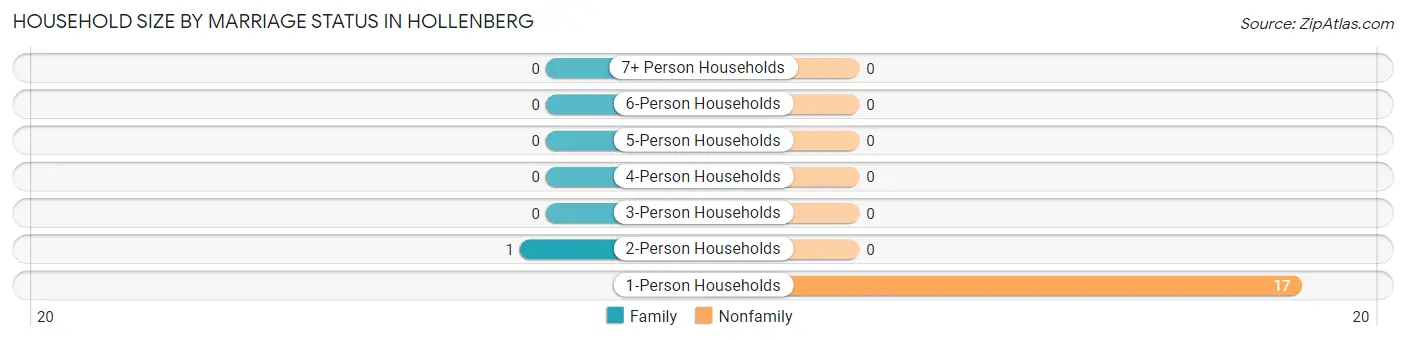
| Household Size | Family Households | Nonfamily Households |
| 1-Person Households | - | 17 (94.4%) |
| 2-Person Households | 1 (5.6%) | 0 (0.0%) |
| 3-Person Households | 0 (0.0%) | 0 (0.0%) |
| 4-Person Households | 0 (0.0%) | 0 (0.0%) |
| 5-Person Households | 0 (0.0%) | 0 (0.0%) |
| 6-Person Households | 0 (0.0%) | 0 (0.0%) |
| 7+ Person Households | 0 (0.0%) | 0 (0.0%) |
| Total | 1 (5.6%) | 17 (94.4%) |
Female Fertility in Hollenberg
Fertility by Age in Hollenberg
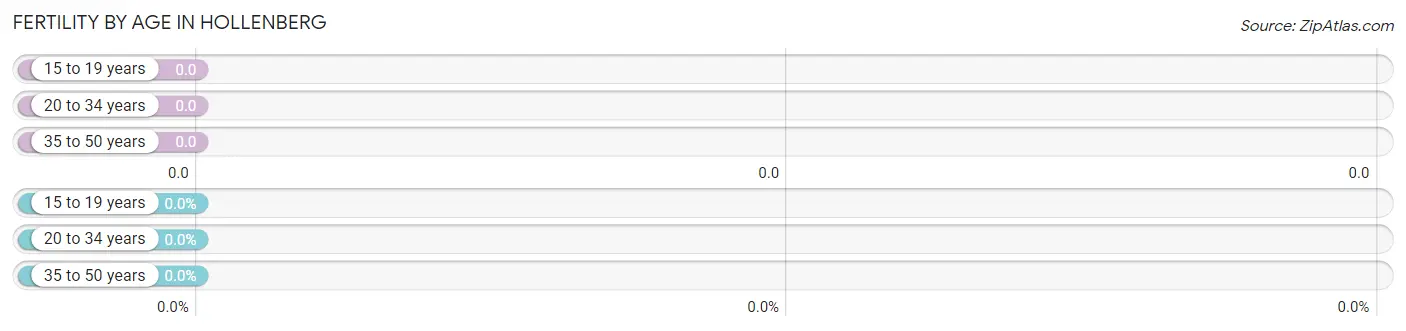
| Age Bracket | Women with Births | Births / 1,000 Women |
| 15 to 19 years | 0 (0.0%) | 0.0 |
| 20 to 34 years | 0 (0.0%) | 0.0 |
| 35 to 50 years | 0 (0.0%) | 0.0 |
| Total | 0 (0.0%) | 0.0 |
Fertility by Age by Marriage Status in Hollenberg
| Age Bracket | Married | Unmarried |
| 15 to 19 years | 0 (0.0%) | 0 (0.0%) |
| 20 to 34 years | 0 (0.0%) | 0 (0.0%) |
| 35 to 50 years | 0 (0.0%) | 0 (0.0%) |
| Total | 0 (0.0%) | 0 (0.0%) |
Fertility by Education in Hollenberg
| Educational Attainment | Women with Births | Births / 1,000 Women |
| Less than High School | 0 (0.0%) | 0.0 |
| High School Diploma | 0 (0.0%) | 0.0 |
| College or Associate's Degree | 0 (0.0%) | 0.0 |
| Bachelor's Degree | 0 (0.0%) | 0.0 |
| Graduate Degree | 0 (0.0%) | 0.0 |
| Total | 0 (0.0%) | 0.0 |
Fertility by Education by Marriage Status in Hollenberg
| Educational Attainment | Married | Unmarried |
| Less than High School | 0 (0.0%) | 0 (0.0%) |
| High School Diploma | 0 (0.0%) | 0 (0.0%) |
| College or Associate's Degree | 0 (0.0%) | 0 (0.0%) |
| Bachelor's Degree | 0 (0.0%) | 0 (0.0%) |
| Graduate Degree | 0 (0.0%) | 0 (0.0%) |
| Total | 0 (0.0%) | 0 (0.0%) |
Employment Characteristics in Hollenberg
Employment by Class of Employer in Hollenberg
Among the 9 employed individuals in Hollenberg, , and private company employees (9 | 100.0%) make up the most common classes of employment.
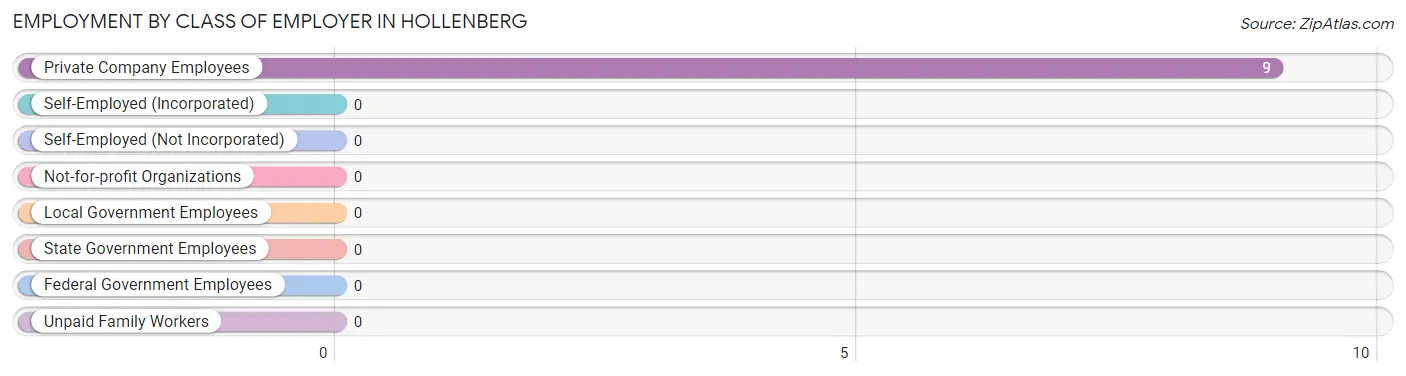
| Employer Class | # Employees | % Employees |
| Private Company Employees | 9 | 100.0% |
| Self-Employed (Incorporated) | 0 | 0.0% |
| Self-Employed (Not Incorporated) | 0 | 0.0% |
| Not-for-profit Organizations | 0 | 0.0% |
| Local Government Employees | 0 | 0.0% |
| State Government Employees | 0 | 0.0% |
| Federal Government Employees | 0 | 0.0% |
| Unpaid Family Workers | 0 | 0.0% |
| Total | 9 | 100.0% |
Employment Status by Age in Hollenberg
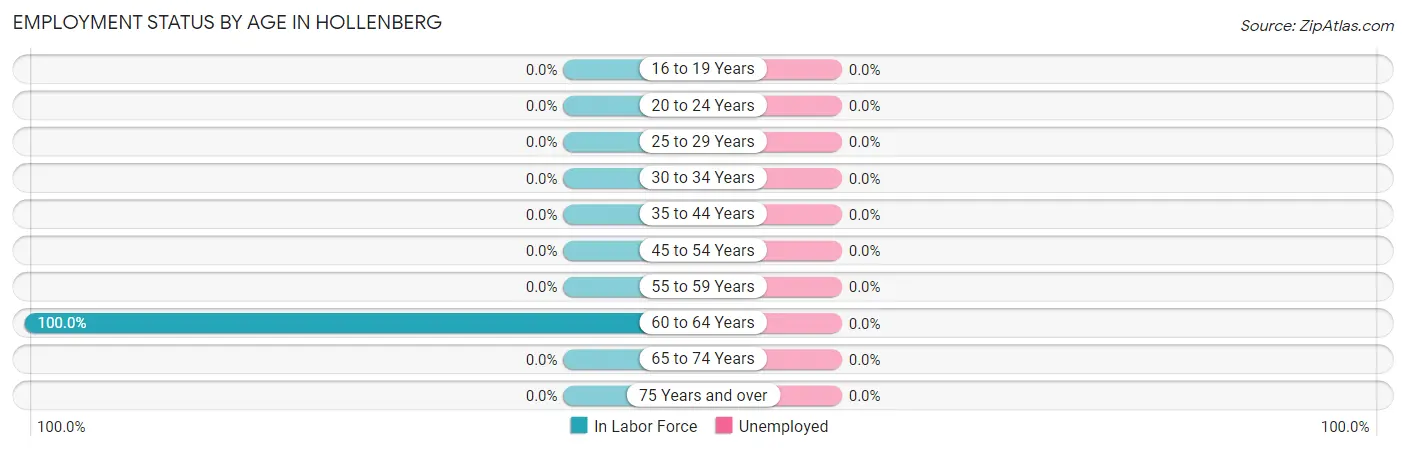
| Age Bracket | In Labor Force | Unemployed |
| 16 to 19 Years | 0 (0.0%) | 0 (0.0%) |
| 20 to 24 Years | 0 (0.0%) | 0 (0.0%) |
| 25 to 29 Years | 0 (0.0%) | 0 (0.0%) |
| 30 to 34 Years | 0 (0.0%) | 0 (0.0%) |
| 35 to 44 Years | 0 (0.0%) | 0 (0.0%) |
| 45 to 54 Years | 0 (0.0%) | 0 (0.0%) |
| 55 to 59 Years | 0 (0.0%) | 0 (0.0%) |
| 60 to 64 Years | 9 (100.0%) | 0 (0.0%) |
| 65 to 74 Years | 0 (0.0%) | 0 (0.0%) |
| 75 Years and over | 0 (0.0%) | 0 (0.0%) |
| Total | 9 (47.4%) | 0 (0.0%) |
Employment Status by Educational Attainment in Hollenberg
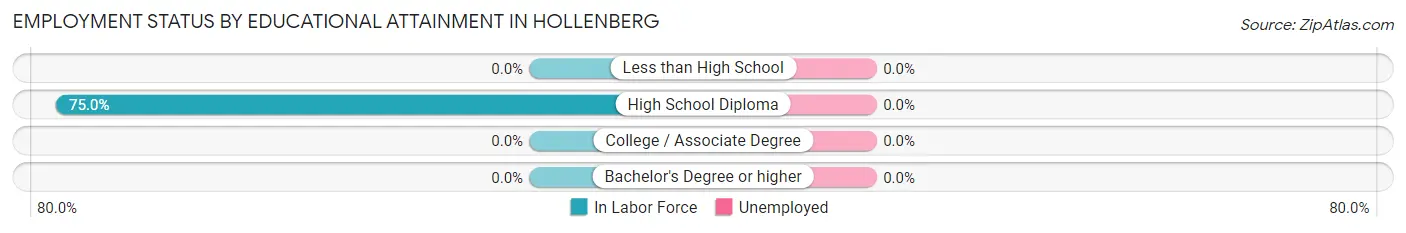
| Educational Attainment | In Labor Force | Unemployed |
| Less than High School | 0 (0.0%) | 0 (0.0%) |
| High School Diploma | 9 (75.0%) | 0 (0.0%) |
| College / Associate Degree | 0 (0.0%) | 0 (0.0%) |
| Bachelor's Degree or higher | 0 (0.0%) | 0 (0.0%) |
| Total | 9 (60.0%) | 0 (0.0%) |
Employment Occupations by Sex in Hollenberg
Management, Business, Science and Arts Occupations
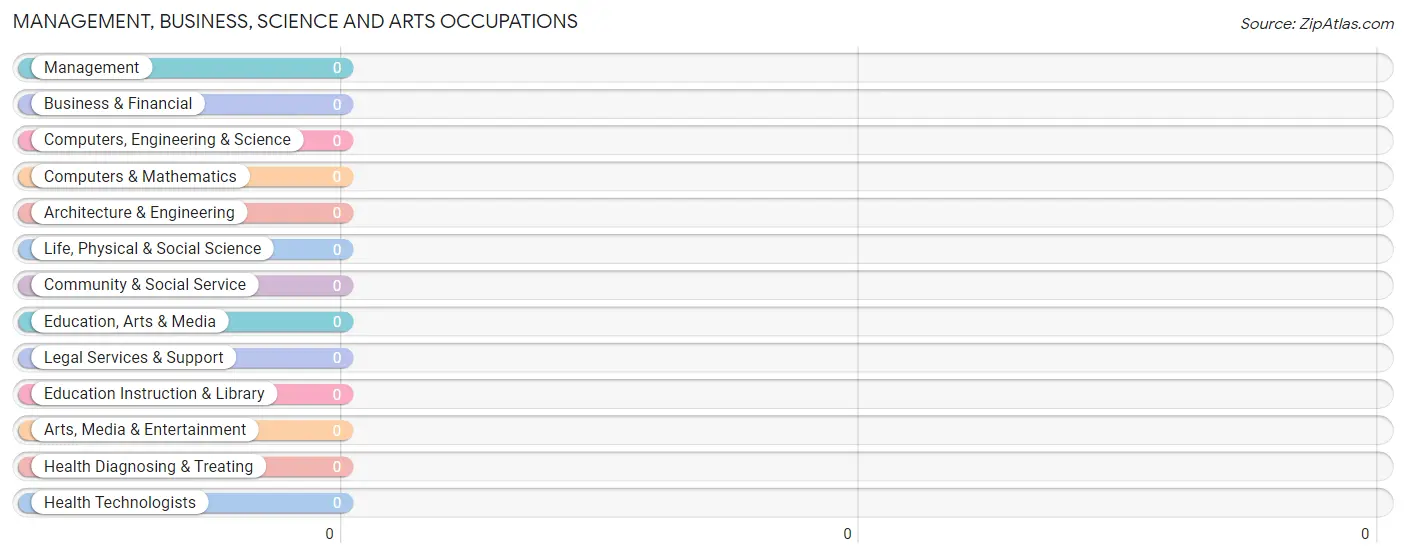
Management, Business, Science and Arts Occupations by Sex
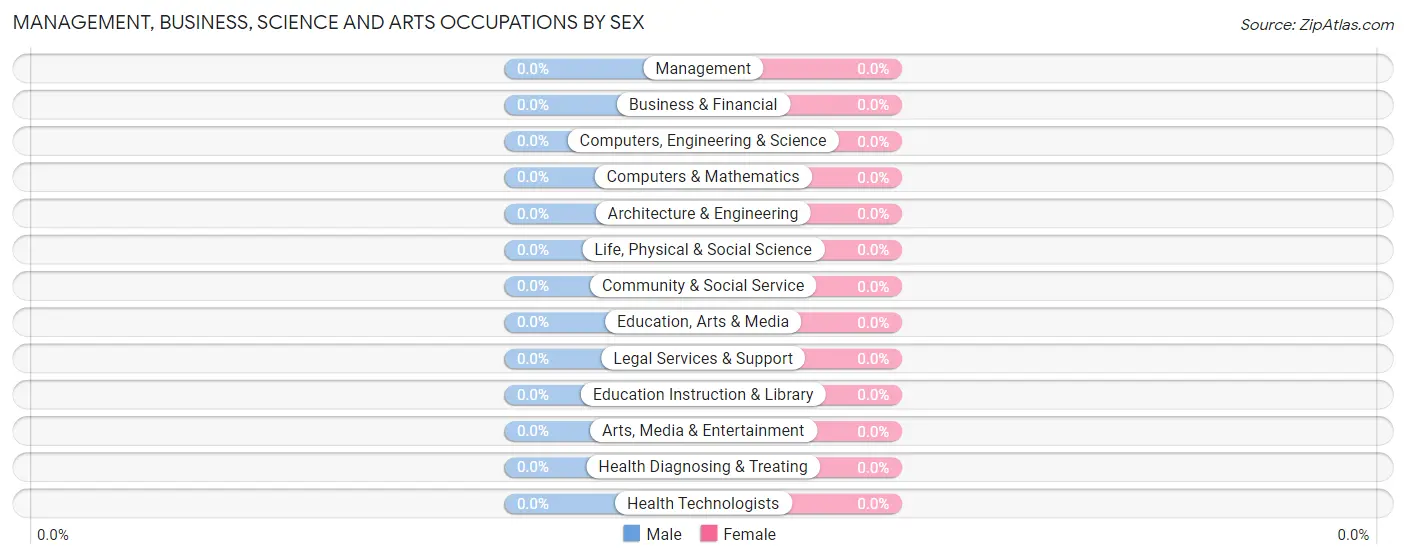
| Occupation | Male | Female |
| Management | 0 (0.0%) | 0 (0.0%) |
| Business & Financial | 0 (0.0%) | 0 (0.0%) |
| Computers, Engineering & Science | 0 (0.0%) | 0 (0.0%) |
| Computers & Mathematics | 0 (0.0%) | 0 (0.0%) |
| Architecture & Engineering | 0 (0.0%) | 0 (0.0%) |
| Life, Physical & Social Science | 0 (0.0%) | 0 (0.0%) |
| Community & Social Service | 0 (0.0%) | 0 (0.0%) |
| Education, Arts & Media | 0 (0.0%) | 0 (0.0%) |
| Legal Services & Support | 0 (0.0%) | 0 (0.0%) |
| Education Instruction & Library | 0 (0.0%) | 0 (0.0%) |
| Arts, Media & Entertainment | 0 (0.0%) | 0 (0.0%) |
| Health Diagnosing & Treating | 0 (0.0%) | 0 (0.0%) |
| Health Technologists | 0 (0.0%) | 0 (0.0%) |
| Total (Category) | 0 (0.0%) | 0 (0.0%) |
| Total (Overall) | 9 (100.0%) | 0 (0.0%) |
Services Occupations
Services Occupations by Sex
| Occupation | Male | Female |
| Healthcare Support | 0 (0.0%) | 0 (0.0%) |
| Security & Protection | 0 (0.0%) | 0 (0.0%) |
| Firefighting & Prevention | 0 (0.0%) | 0 (0.0%) |
| Law Enforcement | 0 (0.0%) | 0 (0.0%) |
| Food Preparation & Serving | 0 (0.0%) | 0 (0.0%) |
| Cleaning & Maintenance | 0 (0.0%) | 0 (0.0%) |
| Personal Care & Service | 0 (0.0%) | 0 (0.0%) |
| Total (Category) | 0 (0.0%) | 0 (0.0%) |
| Total (Overall) | 9 (100.0%) | 0 (0.0%) |
Sales and Office Occupations
Sales and Office Occupations by Sex
| Occupation | Male | Female |
| Sales & Related | 0 (0.0%) | 0 (0.0%) |
| Office & Administration | 0 (0.0%) | 0 (0.0%) |
| Total (Category) | 0 (0.0%) | 0 (0.0%) |
| Total (Overall) | 9 (100.0%) | 0 (0.0%) |
Natural Resources, Construction and Maintenance Occupations
Natural Resources, Construction and Maintenance Occupations by Sex
| Occupation | Male | Female |
| Farming, Fishing & Forestry | 0 (0.0%) | 0 (0.0%) |
| Construction & Extraction | 0 (0.0%) | 0 (0.0%) |
| Installation, Maintenance & Repair | 0 (0.0%) | 0 (0.0%) |
| Total (Category) | 0 (0.0%) | 0 (0.0%) |
| Total (Overall) | 9 (100.0%) | 0 (0.0%) |
Production, Transportation and Moving Occupations
The most common Production, Transportation and Moving occupations in Hollenberg are , and Production (9 | 100.0%).
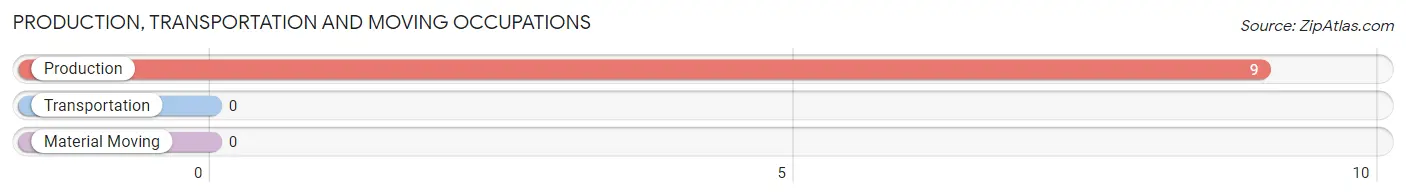
Production, Transportation and Moving Occupations by Sex
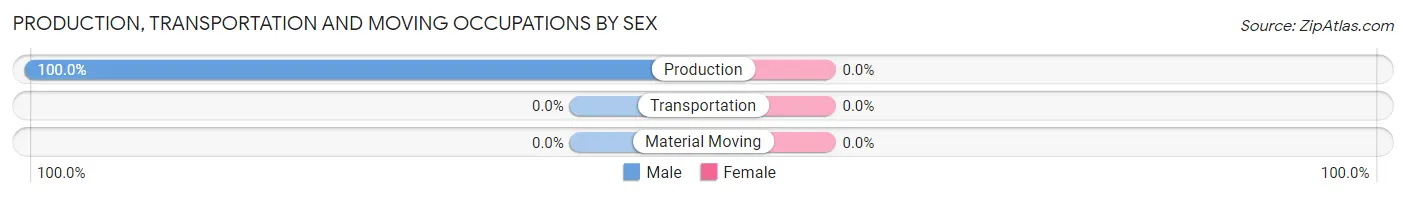
| Occupation | Male | Female |
| Production | 9 (100.0%) | 0 (0.0%) |
| Transportation | 0 (0.0%) | 0 (0.0%) |
| Material Moving | 0 (0.0%) | 0 (0.0%) |
| Total (Category) | 9 (100.0%) | 0 (0.0%) |
| Total (Overall) | 9 (100.0%) | 0 (0.0%) |
Employment Industries by Sex in Hollenberg
Employment Industries in Hollenberg
The major employment industries in Hollenberg include , and Manufacturing (9 | 100.0%).
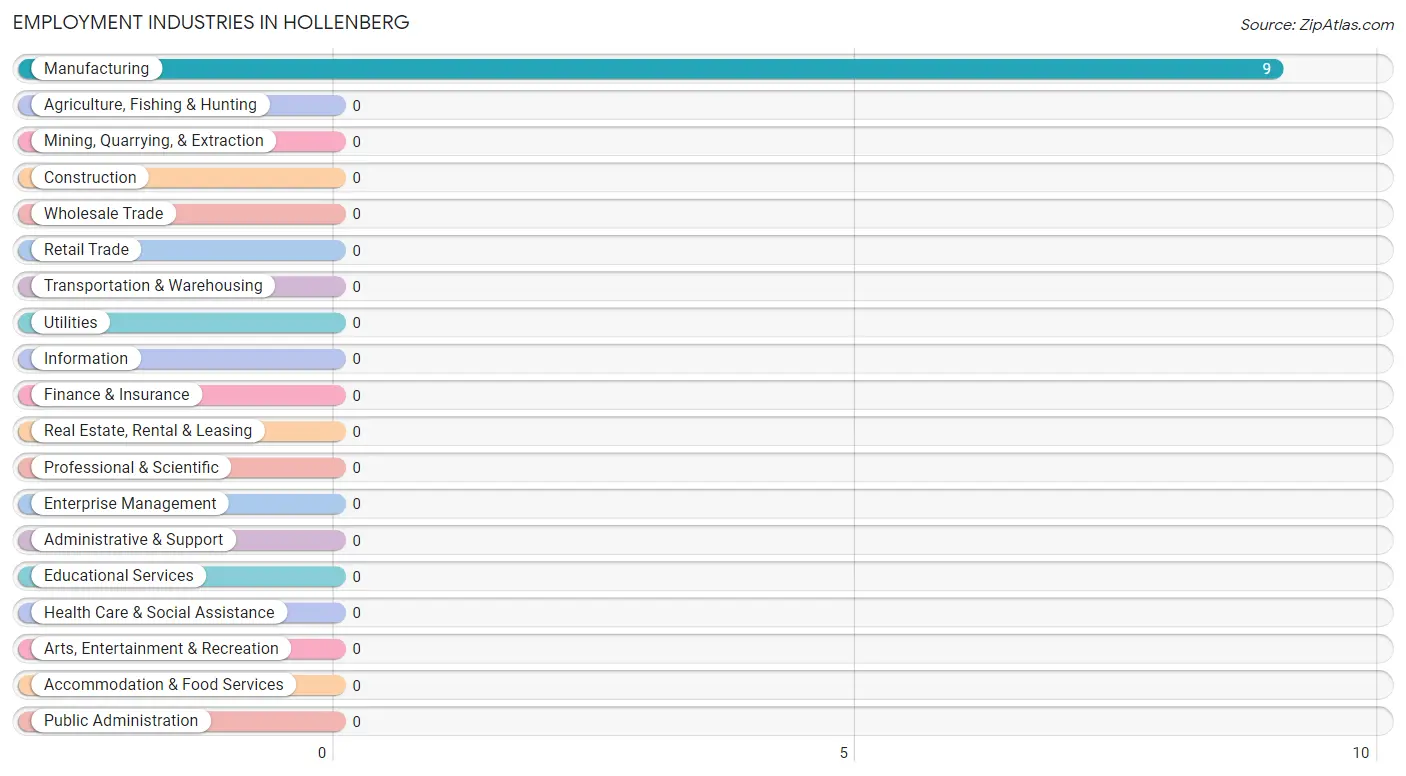
Employment Industries by Sex in Hollenberg
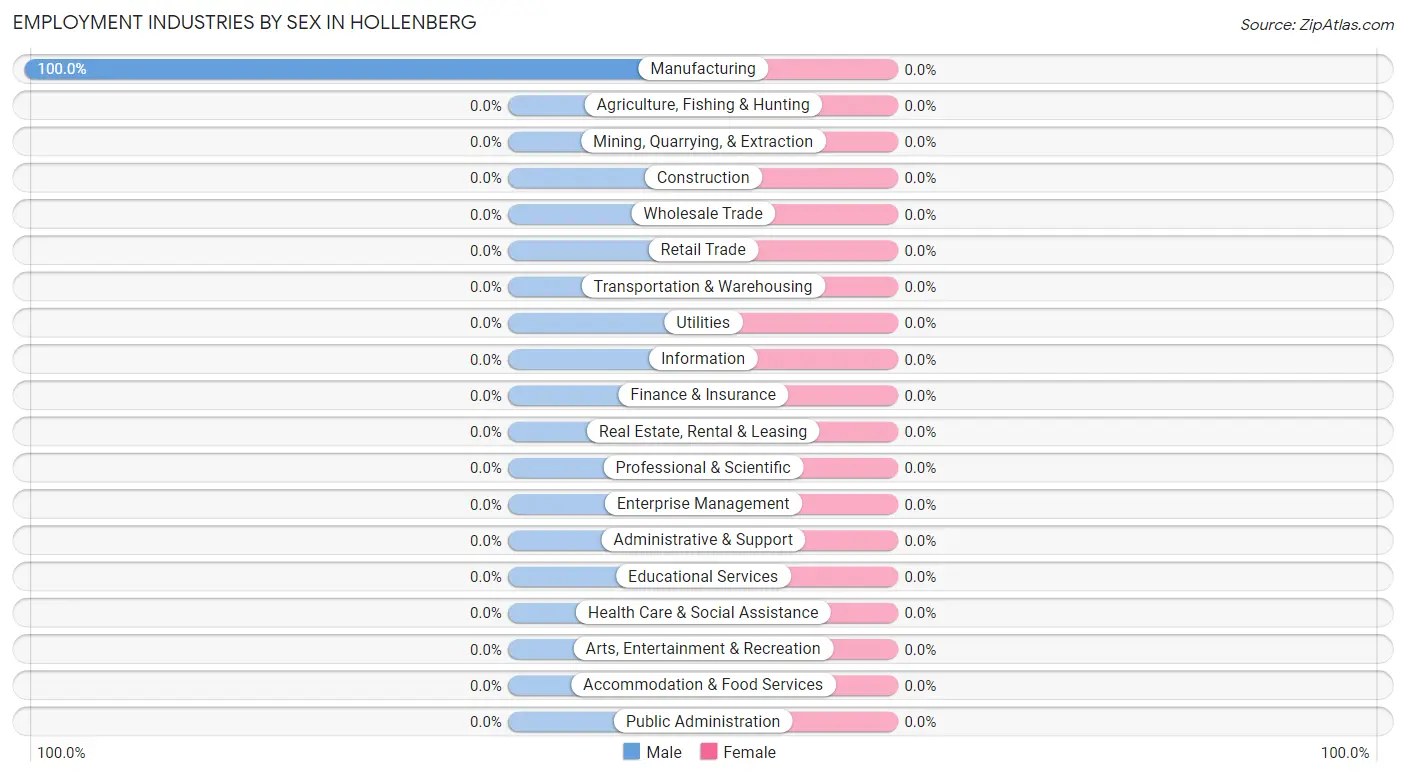
| Industry | Male | Female |
| Agriculture, Fishing & Hunting | 0 (0.0%) | 0 (0.0%) |
| Mining, Quarrying, & Extraction | 0 (0.0%) | 0 (0.0%) |
| Construction | 0 (0.0%) | 0 (0.0%) |
| Manufacturing | 9 (100.0%) | 0 (0.0%) |
| Wholesale Trade | 0 (0.0%) | 0 (0.0%) |
| Retail Trade | 0 (0.0%) | 0 (0.0%) |
| Transportation & Warehousing | 0 (0.0%) | 0 (0.0%) |
| Utilities | 0 (0.0%) | 0 (0.0%) |
| Information | 0 (0.0%) | 0 (0.0%) |
| Finance & Insurance | 0 (0.0%) | 0 (0.0%) |
| Real Estate, Rental & Leasing | 0 (0.0%) | 0 (0.0%) |
| Professional & Scientific | 0 (0.0%) | 0 (0.0%) |
| Enterprise Management | 0 (0.0%) | 0 (0.0%) |
| Administrative & Support | 0 (0.0%) | 0 (0.0%) |
| Educational Services | 0 (0.0%) | 0 (0.0%) |
| Health Care & Social Assistance | 0 (0.0%) | 0 (0.0%) |
| Arts, Entertainment & Recreation | 0 (0.0%) | 0 (0.0%) |
| Accommodation & Food Services | 0 (0.0%) | 0 (0.0%) |
| Public Administration | 0 (0.0%) | 0 (0.0%) |
| Total | 9 (100.0%) | 0 (0.0%) |
Education in Hollenberg
School Enrollment in Hollenberg
| School Level | # Students | % Students |
| Nursery / Preschool | 0 | 0.0% |
| Kindergarten | 0 | 0.0% |
| Elementary School | 0 | 0.0% |
| Middle School | 0 | 0.0% |
| High School | 0 | 0.0% |
| College / Undergraduate | 0 | 0.0% |
| Graduate / Professional | 0 | 0.0% |
| Total | 0 | 0.0% |
School Enrollment by Age by Funding Source in Hollenberg
| Age Bracket | Public School | Private School |
| 3 to 4 Year Olds | 0 (0.0%) | 0 (0.0%) |
| 5 to 9 Year Old | 0 (0.0%) | 0 (0.0%) |
| 10 to 14 Year Olds | 0 (0.0%) | 0 (0.0%) |
| 15 to 17 Year Olds | 0 (0.0%) | 0 (0.0%) |
| 18 to 19 Year Olds | 0 (0.0%) | 0 (0.0%) |
| 20 to 24 Year Olds | 0 (0.0%) | 0 (0.0%) |
| 25 to 34 Year Olds | 0 (0.0%) | 0 (0.0%) |
| 35 Years and over | 0 (0.0%) | 0 (0.0%) |
| Total | 0 (0.0%) | 0 (0.0%) |
Educational Attainment by Field of Study in Hollenberg
| Field of Study | # Graduates | % Graduates |
| Computers & Mathematics | 0 | 0.0% |
| Bio, Nature & Agricultural | 0 | 0.0% |
| Physical & Health Sciences | 0 | 0.0% |
| Psychology | 0 | 0.0% |
| Social Sciences | 0 | 0.0% |
| Engineering | 0 | 0.0% |
| Multidisciplinary Studies | 0 | 0.0% |
| Science & Technology | 0 | 0.0% |
| Business | 0 | 0.0% |
| Education | 0 | 0.0% |
| Literature & Languages | 0 | 0.0% |
| Liberal Arts & History | 0 | 0.0% |
| Visual & Performing Arts | 0 | 0.0% |
| Communications | 0 | 0.0% |
| Arts & Humanities | 0 | 0.0% |
| Total | 0 | 0.0% |
Transportation & Commute in Hollenberg
Vehicle Availability by Sex in Hollenberg
| Vehicles Available | Male | Female |
| No Vehicle | 0 (0.0%) | 0 (0.0%) |
| 1 Vehicle | 9 (100.0%) | 0 (0.0%) |
| 2 Vehicles | 0 (0.0%) | 0 (0.0%) |
| 3 Vehicles | 0 (0.0%) | 0 (0.0%) |
| 4 Vehicles | 0 (0.0%) | 0 (0.0%) |
| 5 or more Vehicles | 0 (0.0%) | 0 (0.0%) |
| Total | 9 (100.0%) | 0 (0.0%) |
Commute Time in Hollenberg
The most frequently occuring commute durations in Hollenberg are 45 to 59 minutes (9 commuters, 100.0%), less than 5 minutes (0 commuters, 0.0%), and 5 to 9 minutes (0 commuters, 0.0%).
| Commute Time | # Commuters | % Commuters |
| Less than 5 Minutes | 0 | 0.0% |
| 5 to 9 Minutes | 0 | 0.0% |
| 10 to 14 Minutes | 0 | 0.0% |
| 15 to 19 Minutes | 0 | 0.0% |
| 20 to 24 Minutes | 0 | 0.0% |
| 25 to 29 Minutes | 0 | 0.0% |
| 30 to 34 Minutes | 0 | 0.0% |
| 35 to 39 Minutes | 0 | 0.0% |
| 40 to 44 Minutes | 0 | 0.0% |
| 45 to 59 Minutes | 9 | 100.0% |
| 60 to 89 Minutes | 0 | 0.0% |
| 90 or more Minutes | 0 | 0.0% |
Commute Time by Sex in Hollenberg
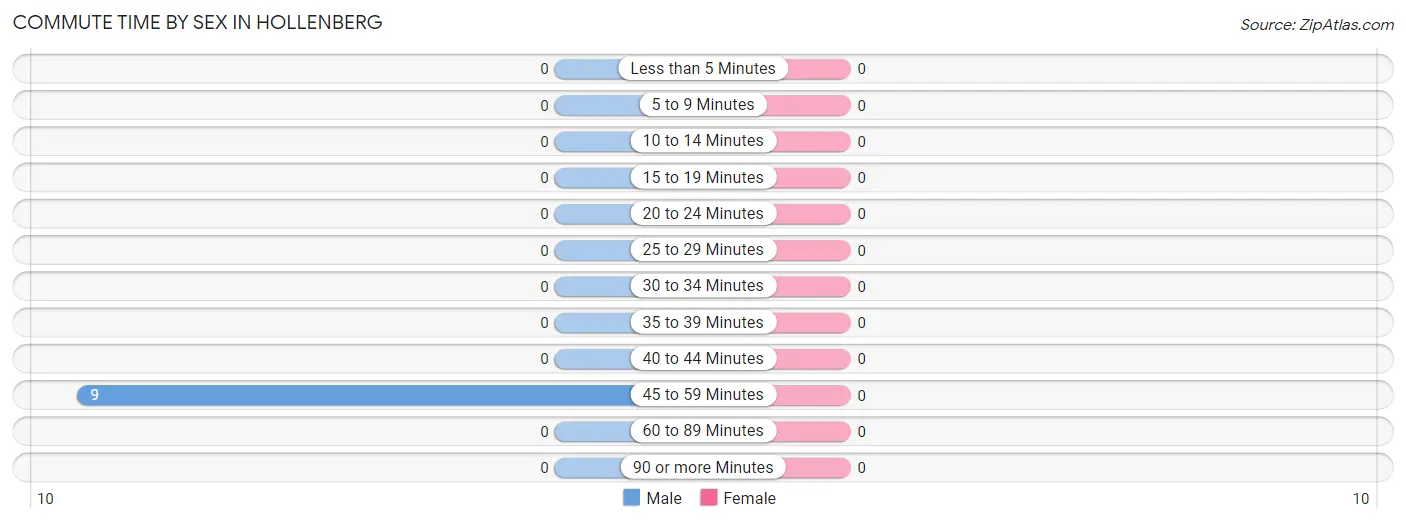
| Commute Time | Male | Female |
| Less than 5 Minutes | 0 (0.0%) | 0 (0.0%) |
| 5 to 9 Minutes | 0 (0.0%) | 0 (0.0%) |
| 10 to 14 Minutes | 0 (0.0%) | 0 (0.0%) |
| 15 to 19 Minutes | 0 (0.0%) | 0 (0.0%) |
| 20 to 24 Minutes | 0 (0.0%) | 0 (0.0%) |
| 25 to 29 Minutes | 0 (0.0%) | 0 (0.0%) |
| 30 to 34 Minutes | 0 (0.0%) | 0 (0.0%) |
| 35 to 39 Minutes | 0 (0.0%) | 0 (0.0%) |
| 40 to 44 Minutes | 0 (0.0%) | 0 (0.0%) |
| 45 to 59 Minutes | 9 (100.0%) | 0 (0.0%) |
| 60 to 89 Minutes | 0 (0.0%) | 0 (0.0%) |
| 90 or more Minutes | 0 (0.0%) | 0 (0.0%) |
Time of Departure to Work by Sex in Hollenberg
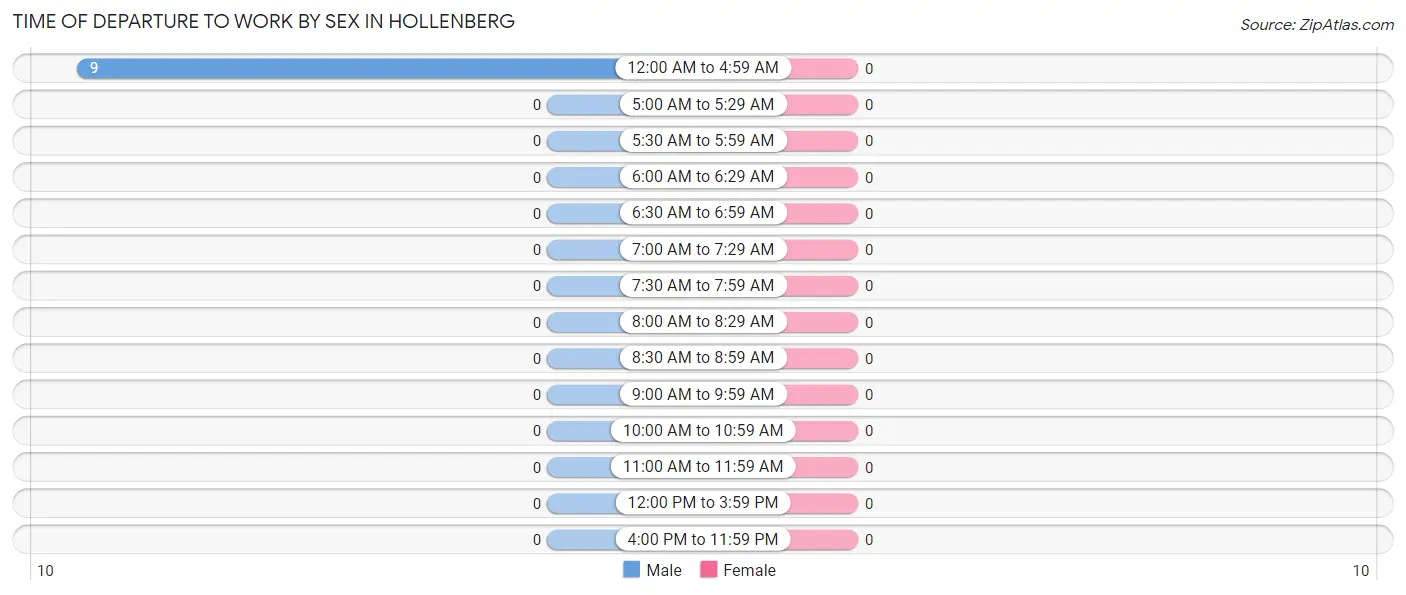
| Time of Departure | Male | Female |
| 12:00 AM to 4:59 AM | 9 (100.0%) | 0 (0.0%) |
| 5:00 AM to 5:29 AM | 0 (0.0%) | 0 (0.0%) |
| 5:30 AM to 5:59 AM | 0 (0.0%) | 0 (0.0%) |
| 6:00 AM to 6:29 AM | 0 (0.0%) | 0 (0.0%) |
| 6:30 AM to 6:59 AM | 0 (0.0%) | 0 (0.0%) |
| 7:00 AM to 7:29 AM | 0 (0.0%) | 0 (0.0%) |
| 7:30 AM to 7:59 AM | 0 (0.0%) | 0 (0.0%) |
| 8:00 AM to 8:29 AM | 0 (0.0%) | 0 (0.0%) |
| 8:30 AM to 8:59 AM | 0 (0.0%) | 0 (0.0%) |
| 9:00 AM to 9:59 AM | 0 (0.0%) | 0 (0.0%) |
| 10:00 AM to 10:59 AM | 0 (0.0%) | 0 (0.0%) |
| 11:00 AM to 11:59 AM | 0 (0.0%) | 0 (0.0%) |
| 12:00 PM to 3:59 PM | 0 (0.0%) | 0 (0.0%) |
| 4:00 PM to 11:59 PM | 0 (0.0%) | 0 (0.0%) |
| Total | 9 (100.0%) | 0 (0.0%) |
Housing Occupancy in Hollenberg
Occupancy by Ownership in Hollenberg
Of the total 18 dwellings in Hollenberg, owner-occupied units account for 15 (83.3%), while renter-occupied units make up 3 (16.7%).
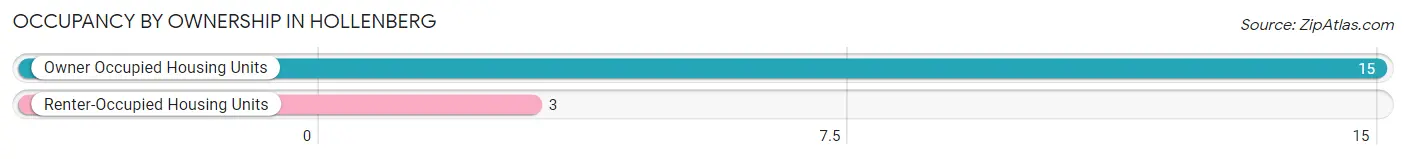
| Occupancy | # Housing Units | % Housing Units |
| Owner Occupied Housing Units | 15 | 83.3% |
| Renter-Occupied Housing Units | 3 | 16.7% |
| Total Occupied Housing Units | 18 | 100.0% |
Occupancy by Household Size in Hollenberg
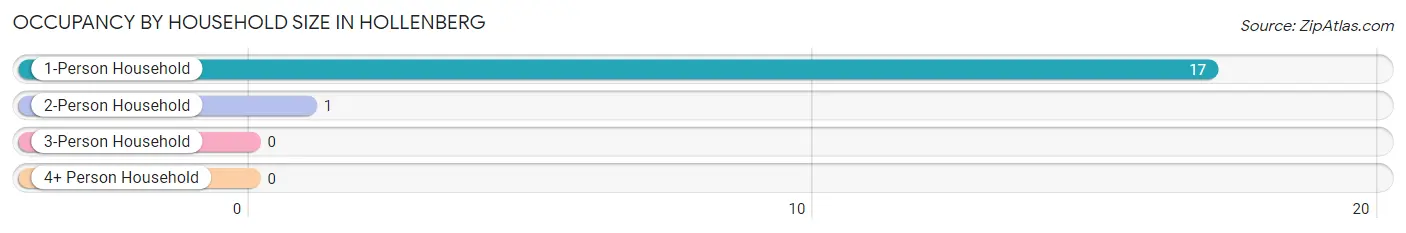
| Household Size | # Housing Units | % Housing Units |
| 1-Person Household | 17 | 94.4% |
| 2-Person Household | 1 | 5.6% |
| 3-Person Household | 0 | 0.0% |
| 4+ Person Household | 0 | 0.0% |
| Total Housing Units | 18 | 100.0% |
Occupancy by Ownership by Household Size in Hollenberg
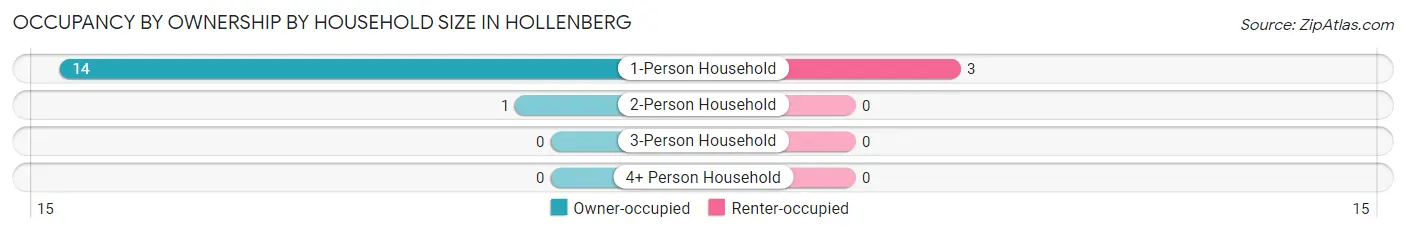
| Household Size | Owner-occupied | Renter-occupied |
| 1-Person Household | 14 (82.4%) | 3 (17.6%) |
| 2-Person Household | 1 (100.0%) | 0 (0.0%) |
| 3-Person Household | 0 (0.0%) | 0 (0.0%) |
| 4+ Person Household | 0 (0.0%) | 0 (0.0%) |
| Total Housing Units | 15 (83.3%) | 3 (16.7%) |
Occupancy by Educational Attainment in Hollenberg
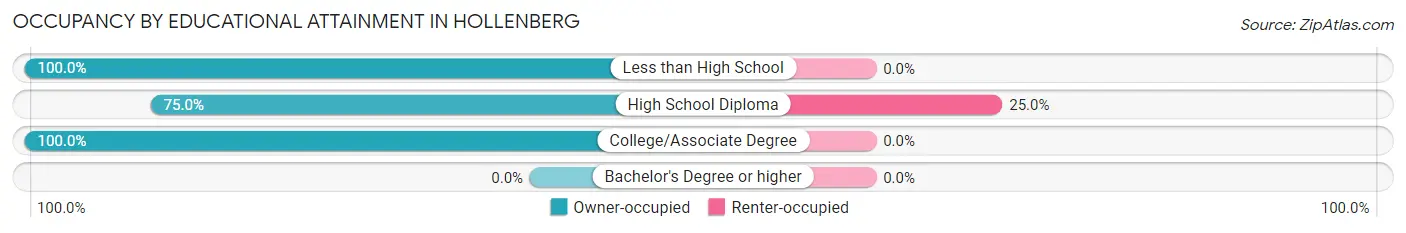
| Household Size | Owner-occupied | Renter-occupied |
| Less than High School | 4 (100.0%) | 0 (0.0%) |
| High School Diploma | 9 (75.0%) | 3 (25.0%) |
| College/Associate Degree | 2 (100.0%) | 0 (0.0%) |
| Bachelor's Degree or higher | 0 (0.0%) | 0 (0.0%) |
Occupancy by Age of Householder in Hollenberg
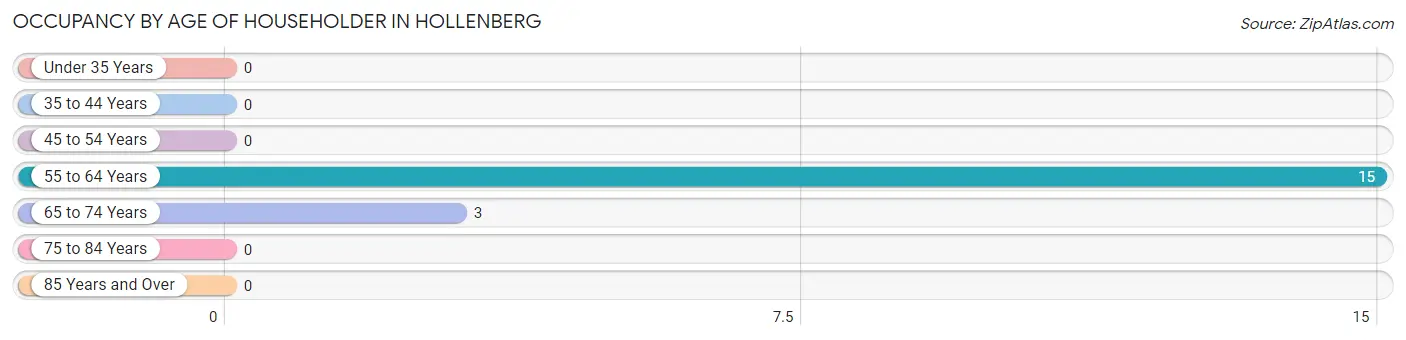
| Age Bracket | # Households | % Households |
| Under 35 Years | 0 | 0.0% |
| 35 to 44 Years | 0 | 0.0% |
| 45 to 54 Years | 0 | 0.0% |
| 55 to 64 Years | 15 | 83.3% |
| 65 to 74 Years | 3 | 16.7% |
| 75 to 84 Years | 0 | 0.0% |
| 85 Years and Over | 0 | 0.0% |
| Total | 18 | 100.0% |
Housing Finances in Hollenberg
Median Income by Occupancy in Hollenberg
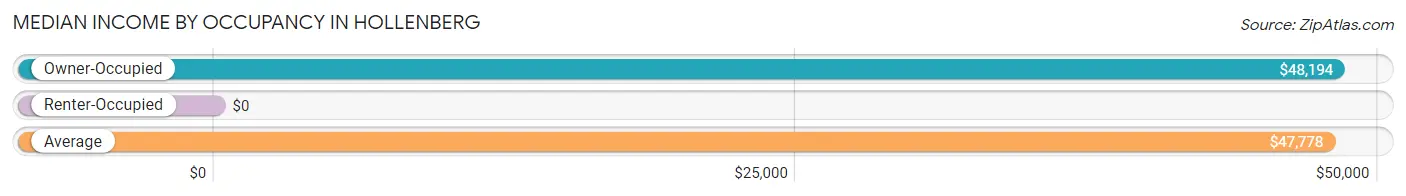
| Occupancy Type | # Households | Median Income |
| Owner-Occupied | 15 (83.3%) | $48,194 |
| Renter-Occupied | 3 (16.7%) | $0 |
| Average | 18 (100.0%) | $47,778 |
Occupancy by Householder Income Bracket in Hollenberg
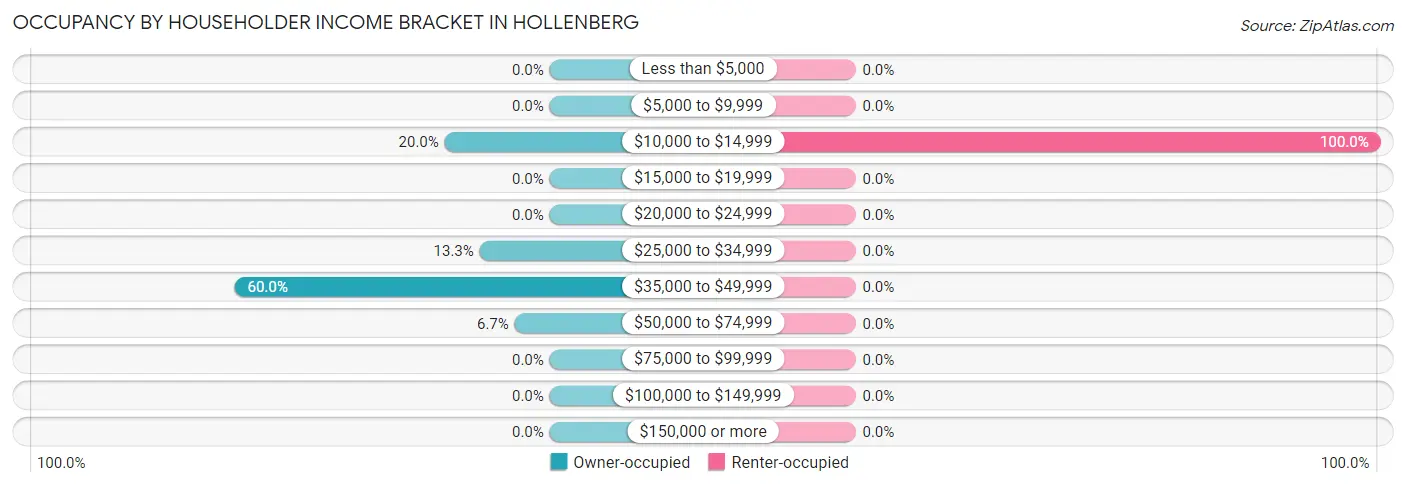
| Income Bracket | Owner-occupied | Renter-occupied |
| Less than $5,000 | 0 (0.0%) | 0 (0.0%) |
| $5,000 to $9,999 | 0 (0.0%) | 0 (0.0%) |
| $10,000 to $14,999 | 3 (20.0%) | 3 (100.0%) |
| $15,000 to $19,999 | 0 (0.0%) | 0 (0.0%) |
| $20,000 to $24,999 | 0 (0.0%) | 0 (0.0%) |
| $25,000 to $34,999 | 2 (13.3%) | 0 (0.0%) |
| $35,000 to $49,999 | 9 (60.0%) | 0 (0.0%) |
| $50,000 to $74,999 | 1 (6.7%) | 0 (0.0%) |
| $75,000 to $99,999 | 0 (0.0%) | 0 (0.0%) |
| $100,000 to $149,999 | 0 (0.0%) | 0 (0.0%) |
| $150,000 or more | 0 (0.0%) | 0 (0.0%) |
| Total | 15 (100.0%) | 3 (100.0%) |
Monthly Housing Cost Tiers in Hollenberg
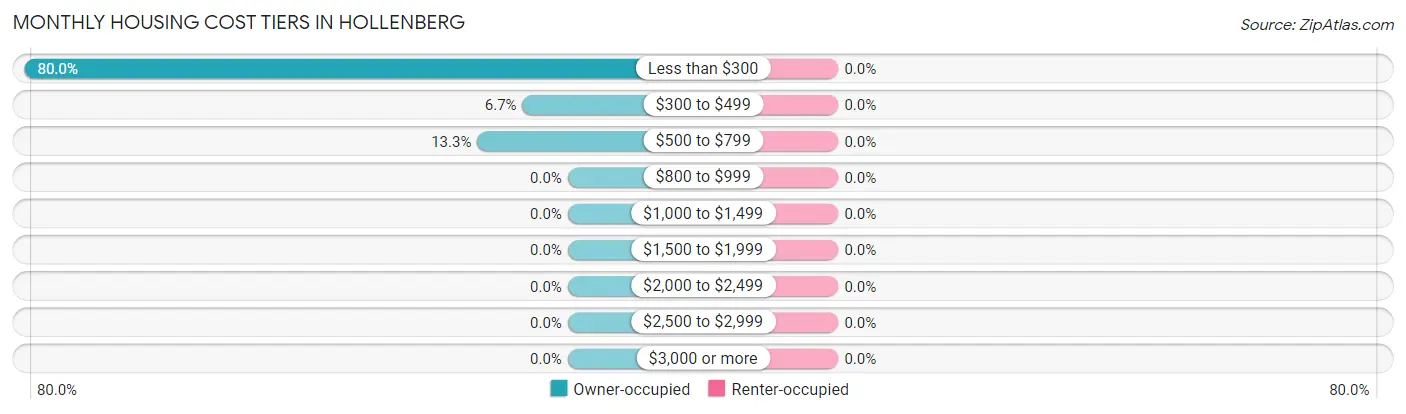
| Monthly Cost | Owner-occupied | Renter-occupied |
| Less than $300 | 12 (80.0%) | 0 (0.0%) |
| $300 to $499 | 1 (6.7%) | 0 (0.0%) |
| $500 to $799 | 2 (13.3%) | 0 (0.0%) |
| $800 to $999 | 0 (0.0%) | 0 (0.0%) |
| $1,000 to $1,499 | 0 (0.0%) | 0 (0.0%) |
| $1,500 to $1,999 | 0 (0.0%) | 0 (0.0%) |
| $2,000 to $2,499 | 0 (0.0%) | 0 (0.0%) |
| $2,500 to $2,999 | 0 (0.0%) | 0 (0.0%) |
| $3,000 or more | 0 (0.0%) | 0 (0.0%) |
| Total | 15 (100.0%) | 3 (100.0%) |
Physical Housing Characteristics in Hollenberg
Housing Structures in Hollenberg
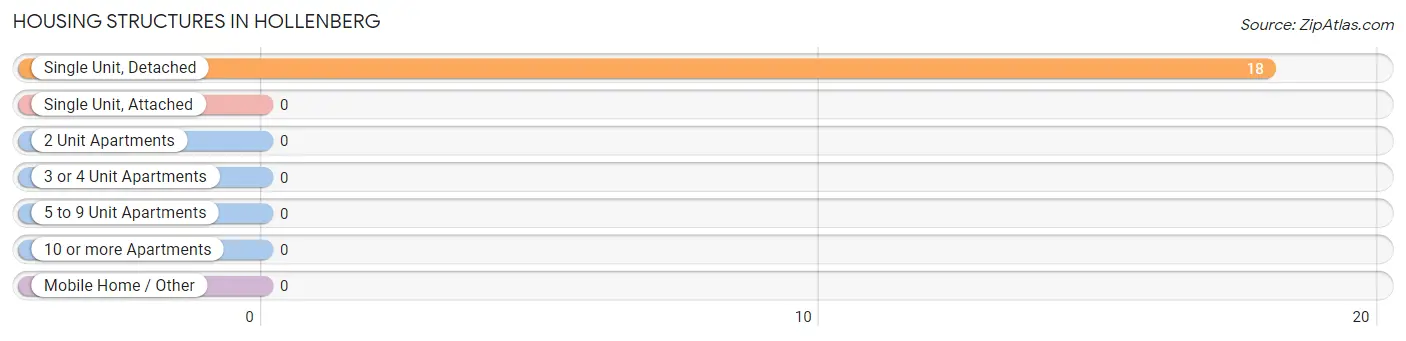
| Structure Type | # Housing Units | % Housing Units |
| Single Unit, Detached | 18 | 100.0% |
| Single Unit, Attached | 0 | 0.0% |
| 2 Unit Apartments | 0 | 0.0% |
| 3 or 4 Unit Apartments | 0 | 0.0% |
| 5 to 9 Unit Apartments | 0 | 0.0% |
| 10 or more Apartments | 0 | 0.0% |
| Mobile Home / Other | 0 | 0.0% |
| Total | 18 | 100.0% |
Housing Structures by Occupancy in Hollenberg
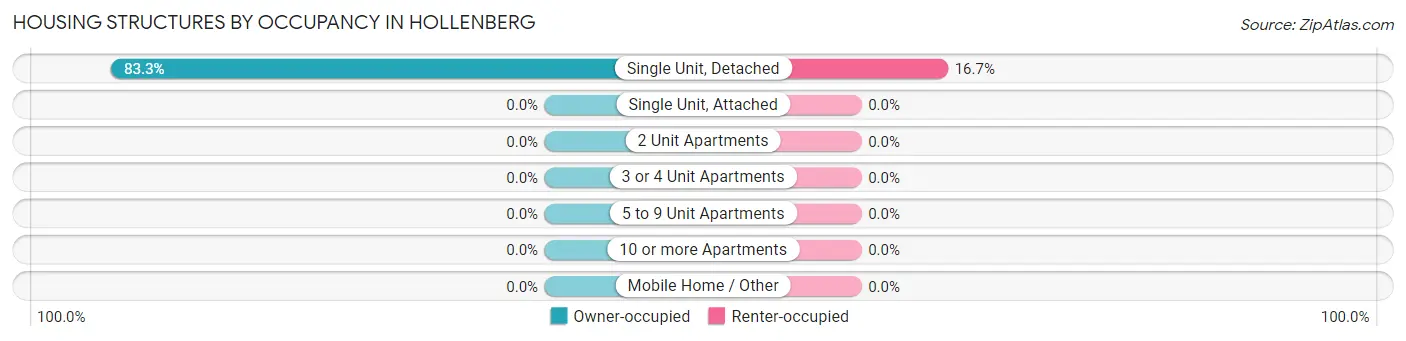
| Structure Type | Owner-occupied | Renter-occupied |
| Single Unit, Detached | 15 (83.3%) | 3 (16.7%) |
| Single Unit, Attached | 0 (0.0%) | 0 (0.0%) |
| 2 Unit Apartments | 0 (0.0%) | 0 (0.0%) |
| 3 or 4 Unit Apartments | 0 (0.0%) | 0 (0.0%) |
| 5 to 9 Unit Apartments | 0 (0.0%) | 0 (0.0%) |
| 10 or more Apartments | 0 (0.0%) | 0 (0.0%) |
| Mobile Home / Other | 0 (0.0%) | 0 (0.0%) |
| Total | 15 (83.3%) | 3 (16.7%) |
Housing Structures by Number of Rooms in Hollenberg
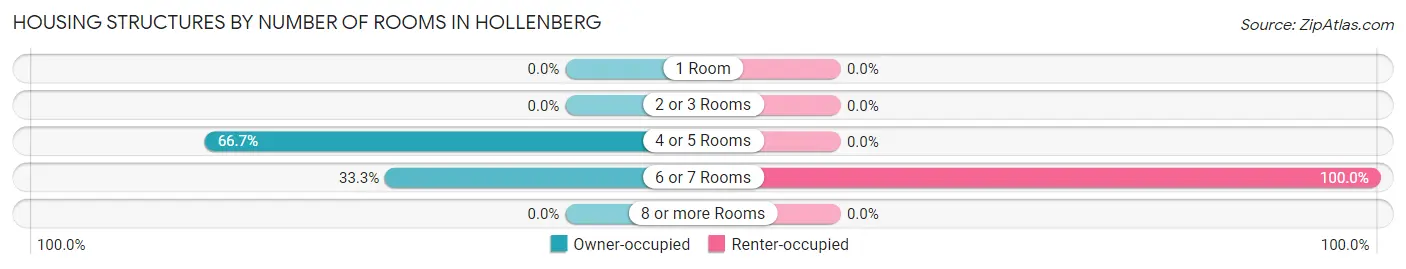
| Number of Rooms | Owner-occupied | Renter-occupied |
| 1 Room | 0 (0.0%) | 0 (0.0%) |
| 2 or 3 Rooms | 0 (0.0%) | 0 (0.0%) |
| 4 or 5 Rooms | 10 (66.7%) | 0 (0.0%) |
| 6 or 7 Rooms | 5 (33.3%) | 3 (100.0%) |
| 8 or more Rooms | 0 (0.0%) | 0 (0.0%) |
| Total | 15 (100.0%) | 3 (100.0%) |
Housing Structure by Heating Type in Hollenberg
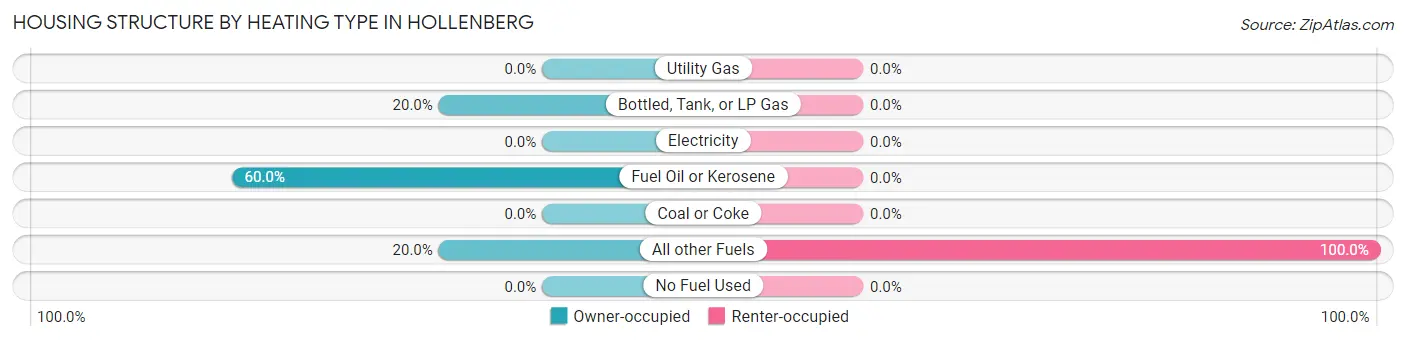
| Heating Type | Owner-occupied | Renter-occupied |
| Utility Gas | 0 (0.0%) | 0 (0.0%) |
| Bottled, Tank, or LP Gas | 3 (20.0%) | 0 (0.0%) |
| Electricity | 0 (0.0%) | 0 (0.0%) |
| Fuel Oil or Kerosene | 9 (60.0%) | 0 (0.0%) |
| Coal or Coke | 0 (0.0%) | 0 (0.0%) |
| All other Fuels | 3 (20.0%) | 3 (100.0%) |
| No Fuel Used | 0 (0.0%) | 0 (0.0%) |
| Total | 15 (100.0%) | 3 (100.0%) |
Household Vehicle Usage in Hollenberg
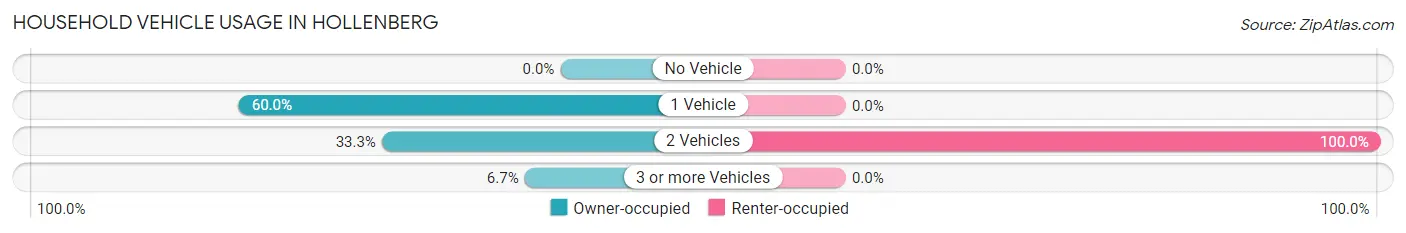
| Vehicles per Household | Owner-occupied | Renter-occupied |
| No Vehicle | 0 (0.0%) | 0 (0.0%) |
| 1 Vehicle | 9 (60.0%) | 0 (0.0%) |
| 2 Vehicles | 5 (33.3%) | 3 (100.0%) |
| 3 or more Vehicles | 1 (6.7%) | 0 (0.0%) |
| Total | 15 (100.0%) | 3 (100.0%) |
Real Estate & Mortgages in Hollenberg
Real Estate and Mortgage Overview in Hollenberg
| Characteristic | Without Mortgage | With Mortgage |
| Housing Units | 15 | 0 |
| Median Property Value | $9,999 | $0 |
| Median Household Income | $48,194 | $0 |
| Monthly Housing Costs | $175 | $0 |
| Real Estate Taxes | $239 | $0 |
Property Value by Mortgage Status in Hollenberg
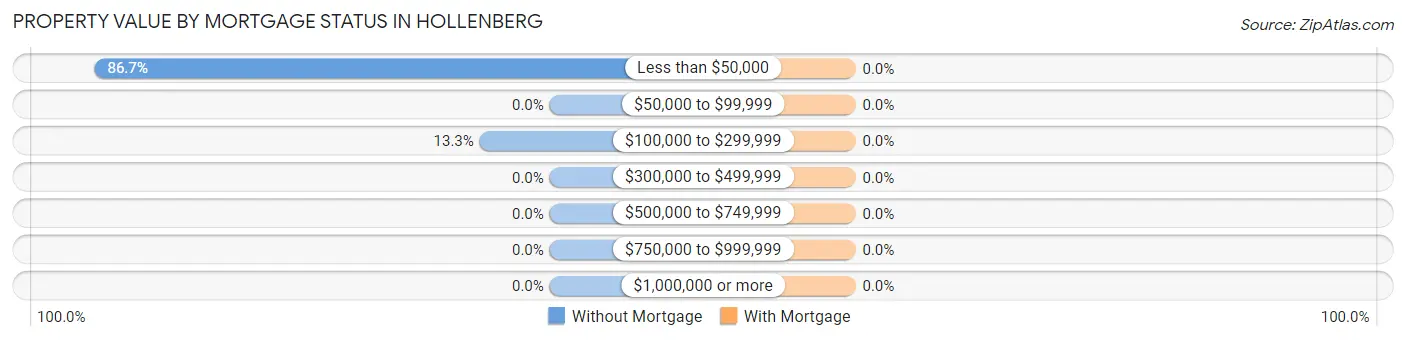
| Property Value | Without Mortgage | With Mortgage |
| Less than $50,000 | 13 (86.7%) | 0 (0.0%) |
| $50,000 to $99,999 | 0 (0.0%) | 0 (0.0%) |
| $100,000 to $299,999 | 2 (13.3%) | 0 (0.0%) |
| $300,000 to $499,999 | 0 (0.0%) | 0 (0.0%) |
| $500,000 to $749,999 | 0 (0.0%) | 0 (0.0%) |
| $750,000 to $999,999 | 0 (0.0%) | 0 (0.0%) |
| $1,000,000 or more | 0 (0.0%) | 0 (0.0%) |
| Total | 15 (100.0%) | 0 (0.0%) |
Household Income by Mortgage Status in Hollenberg
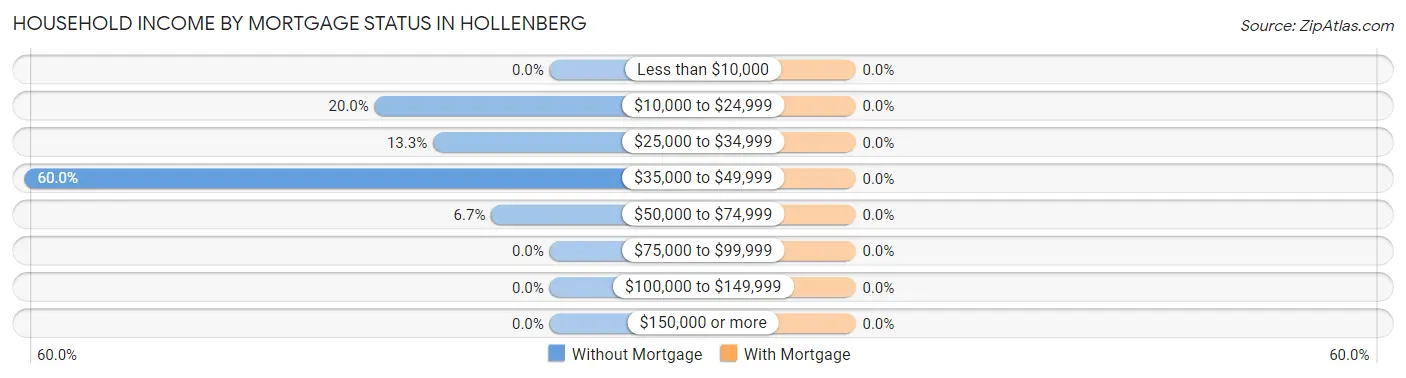
| Household Income | Without Mortgage | With Mortgage |
| Less than $10,000 | 0 (0.0%) | 0 (0.0%) |
| $10,000 to $24,999 | 3 (20.0%) | 0 (0.0%) |
| $25,000 to $34,999 | 2 (13.3%) | 0 (0.0%) |
| $35,000 to $49,999 | 9 (60.0%) | 0 (0.0%) |
| $50,000 to $74,999 | 1 (6.7%) | 0 (0.0%) |
| $75,000 to $99,999 | 0 (0.0%) | 0 (0.0%) |
| $100,000 to $149,999 | 0 (0.0%) | 0 (0.0%) |
| $150,000 or more | 0 (0.0%) | 0 (0.0%) |
| Total | 15 (100.0%) | 0 (0.0%) |
Property Value to Household Income Ratio in Hollenberg
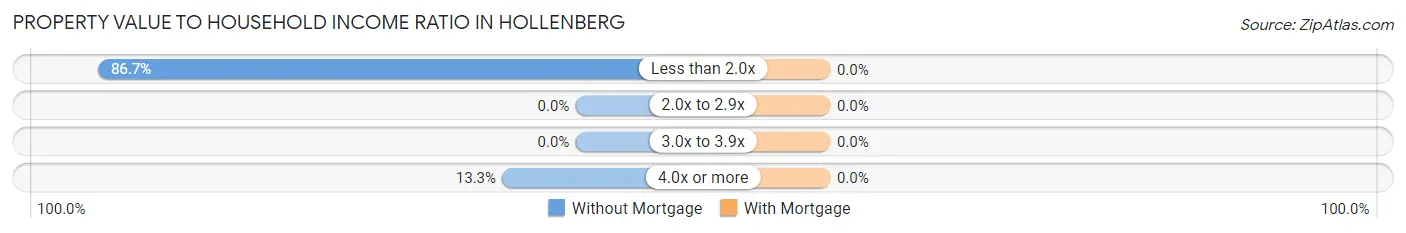
| Value-to-Income Ratio | Without Mortgage | With Mortgage |
| Less than 2.0x | 13 (86.7%) | 0 (0.0%) |
| 2.0x to 2.9x | 0 (0.0%) | 0 (0.0%) |
| 3.0x to 3.9x | 0 (0.0%) | 0 (0.0%) |
| 4.0x or more | 2 (13.3%) | 0 (0.0%) |
| Total | 15 (100.0%) | 0 (0.0%) |
Real Estate Taxes by Mortgage Status in Hollenberg
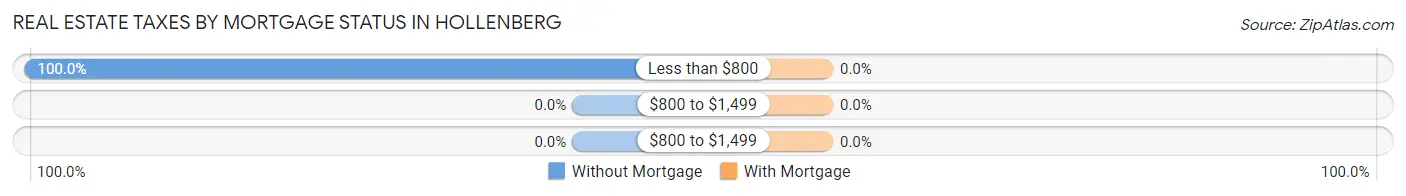
| Property Taxes | Without Mortgage | With Mortgage |
| Less than $800 | 15 (100.0%) | 0 (0.0%) |
| $800 to $1,499 | 0 (0.0%) | 0 (0.0%) |
| $800 to $1,499 | 0 (0.0%) | 0 (0.0%) |
| Total | 15 (100.0%) | 0 (0.0%) |
Health & Disability in Hollenberg
Health Insurance Coverage by Age in Hollenberg
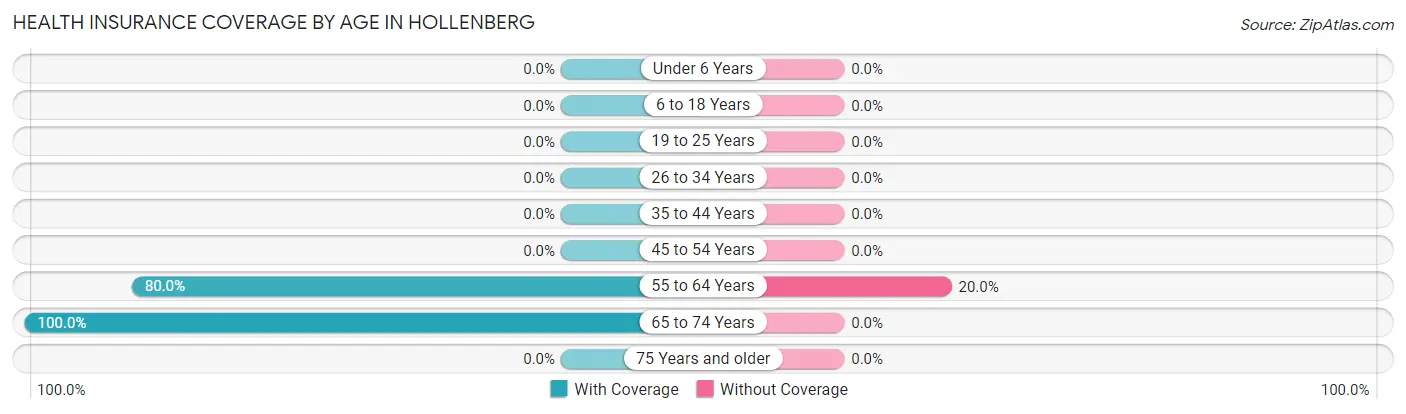
| Age Bracket | With Coverage | Without Coverage |
| Under 6 Years | 0 (0.0%) | 0 (0.0%) |
| 6 to 18 Years | 0 (0.0%) | 0 (0.0%) |
| 19 to 25 Years | 0 (0.0%) | 0 (0.0%) |
| 26 to 34 Years | 0 (0.0%) | 0 (0.0%) |
| 35 to 44 Years | 0 (0.0%) | 0 (0.0%) |
| 45 to 54 Years | 0 (0.0%) | 0 (0.0%) |
| 55 to 64 Years | 12 (80.0%) | 3 (20.0%) |
| 65 to 74 Years | 4 (100.0%) | 0 (0.0%) |
| 75 Years and older | 0 (0.0%) | 0 (0.0%) |
| Total | 16 (84.2%) | 3 (15.8%) |
Health Insurance Coverage by Citizenship Status in Hollenberg
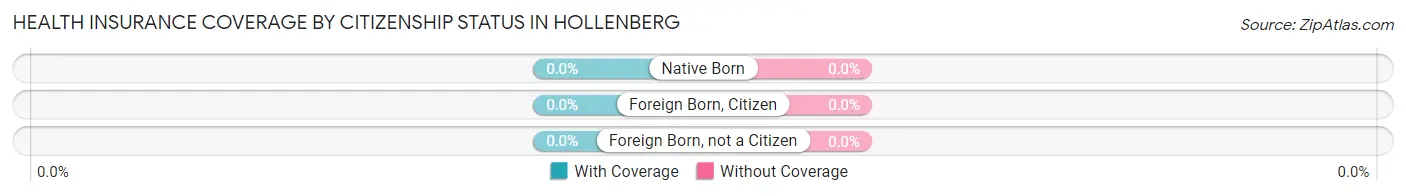
| Citizenship Status | With Coverage | Without Coverage |
| Native Born | 0 (0.0%) | 0 (0.0%) |
| Foreign Born, Citizen | 0 (0.0%) | 0 (0.0%) |
| Foreign Born, not a Citizen | 0 (0.0%) | 0 (0.0%) |
Health Insurance Coverage by Household Income in Hollenberg
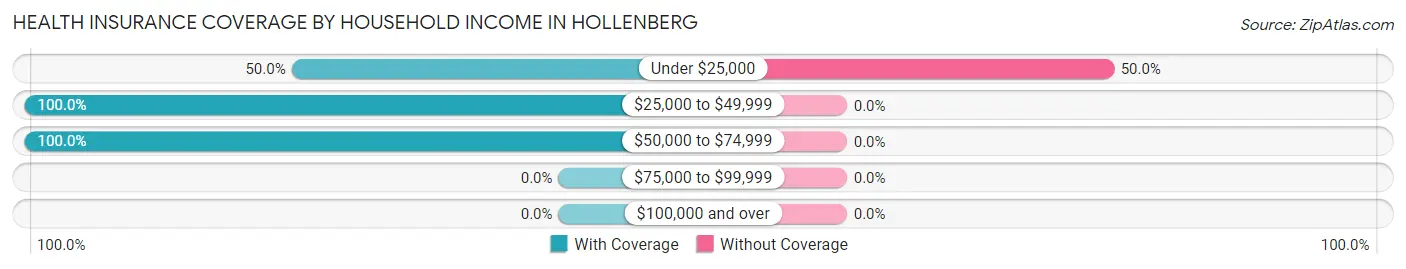
| Household Income | With Coverage | Without Coverage |
| Under $25,000 | 3 (50.0%) | 3 (50.0%) |
| $25,000 to $49,999 | 11 (100.0%) | 0 (0.0%) |
| $50,000 to $74,999 | 2 (100.0%) | 0 (0.0%) |
| $75,000 to $99,999 | 0 (0.0%) | 0 (0.0%) |
| $100,000 and over | 0 (0.0%) | 0 (0.0%) |
Public vs Private Health Insurance Coverage by Age in Hollenberg
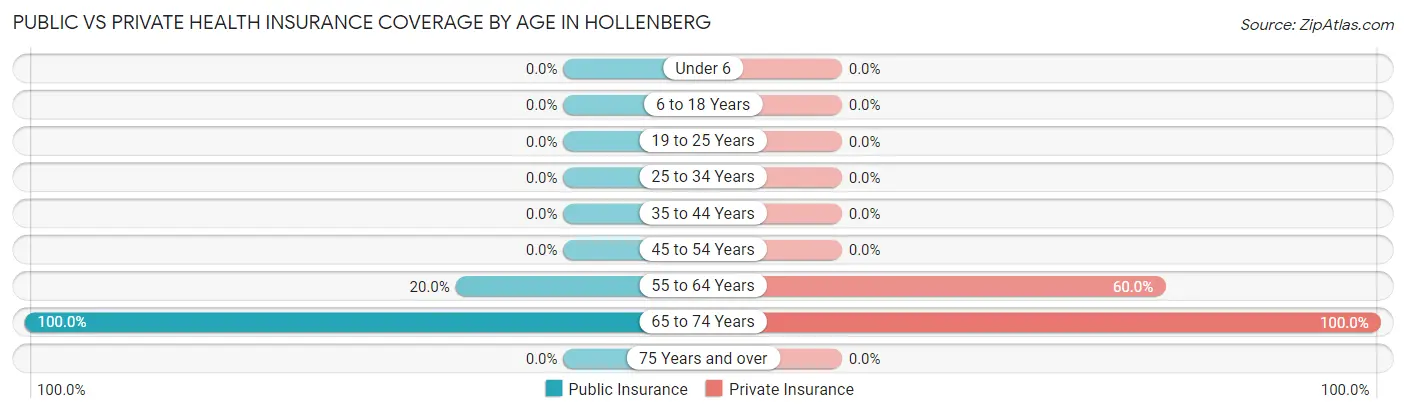
| Age Bracket | Public Insurance | Private Insurance |
| Under 6 | 0 (0.0%) | 0 (0.0%) |
| 6 to 18 Years | 0 (0.0%) | 0 (0.0%) |
| 19 to 25 Years | 0 (0.0%) | 0 (0.0%) |
| 25 to 34 Years | 0 (0.0%) | 0 (0.0%) |
| 35 to 44 Years | 0 (0.0%) | 0 (0.0%) |
| 45 to 54 Years | 0 (0.0%) | 0 (0.0%) |
| 55 to 64 Years | 3 (20.0%) | 9 (60.0%) |
| 65 to 74 Years | 4 (100.0%) | 4 (100.0%) |
| 75 Years and over | 0 (0.0%) | 0 (0.0%) |
| Total | 7 (36.8%) | 13 (68.4%) |
Disability Status by Sex by Age in Hollenberg
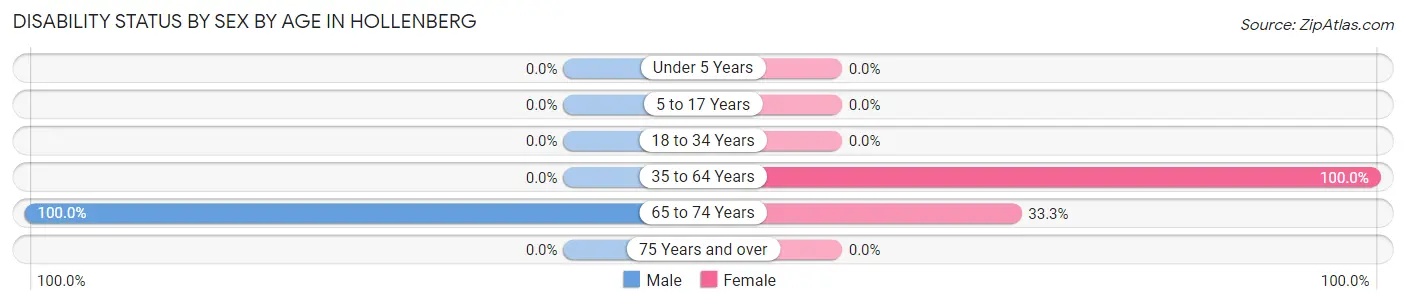
| Age Bracket | Male | Female |
| Under 5 Years | 0 (0.0%) | 0 (0.0%) |
| 5 to 17 Years | 0 (0.0%) | 0 (0.0%) |
| 18 to 34 Years | 0 (0.0%) | 0 (0.0%) |
| 35 to 64 Years | 0 (0.0%) | 3 (100.0%) |
| 65 to 74 Years | 1 (100.0%) | 1 (33.3%) |
| 75 Years and over | 0 (0.0%) | 0 (0.0%) |
Disability Class by Sex by Age in Hollenberg
Disability Class: Hearing Difficulty
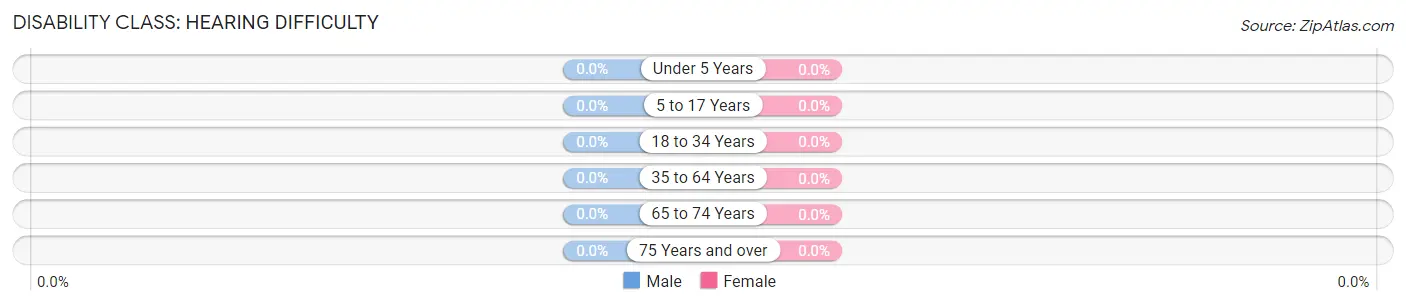
| Age Bracket | Male | Female |
| Under 5 Years | 0 (0.0%) | 0 (0.0%) |
| 5 to 17 Years | 0 (0.0%) | 0 (0.0%) |
| 18 to 34 Years | 0 (0.0%) | 0 (0.0%) |
| 35 to 64 Years | 0 (0.0%) | 0 (0.0%) |
| 65 to 74 Years | 0 (0.0%) | 0 (0.0%) |
| 75 Years and over | 0 (0.0%) | 0 (0.0%) |
Disability Class: Vision Difficulty
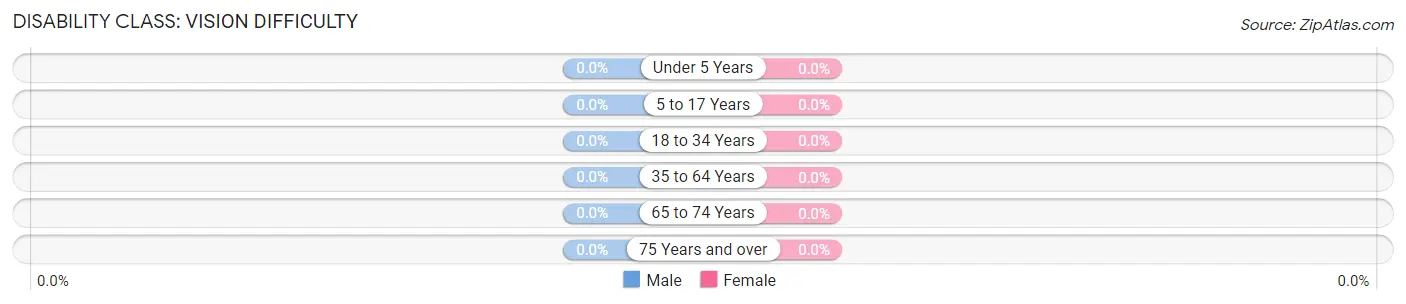
| Age Bracket | Male | Female |
| Under 5 Years | 0 (0.0%) | 0 (0.0%) |
| 5 to 17 Years | 0 (0.0%) | 0 (0.0%) |
| 18 to 34 Years | 0 (0.0%) | 0 (0.0%) |
| 35 to 64 Years | 0 (0.0%) | 0 (0.0%) |
| 65 to 74 Years | 0 (0.0%) | 0 (0.0%) |
| 75 Years and over | 0 (0.0%) | 0 (0.0%) |
Disability Class: Cognitive Difficulty
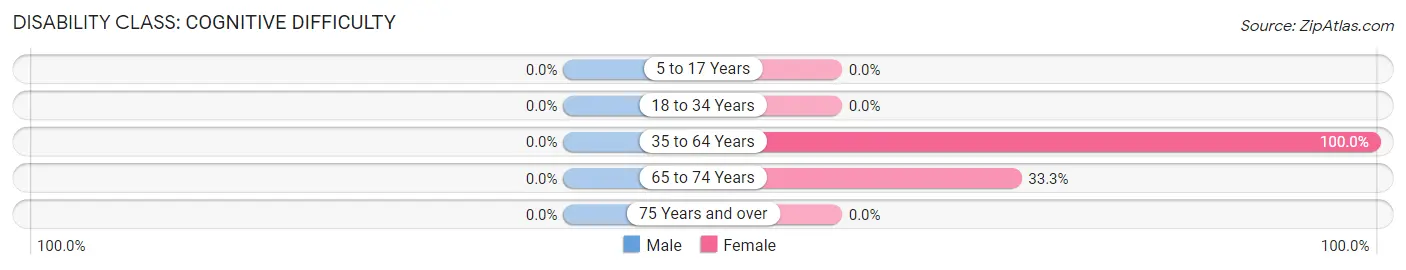
| Age Bracket | Male | Female |
| 5 to 17 Years | 0 (0.0%) | 0 (0.0%) |
| 18 to 34 Years | 0 (0.0%) | 0 (0.0%) |
| 35 to 64 Years | 0 (0.0%) | 3 (100.0%) |
| 65 to 74 Years | 0 (0.0%) | 1 (33.3%) |
| 75 Years and over | 0 (0.0%) | 0 (0.0%) |
Disability Class: Ambulatory Difficulty
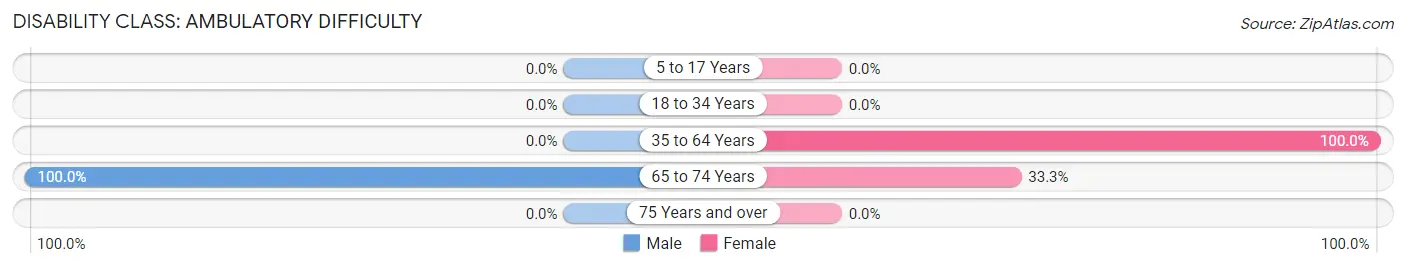
| Age Bracket | Male | Female |
| 5 to 17 Years | 0 (0.0%) | 0 (0.0%) |
| 18 to 34 Years | 0 (0.0%) | 0 (0.0%) |
| 35 to 64 Years | 0 (0.0%) | 3 (100.0%) |
| 65 to 74 Years | 1 (100.0%) | 1 (33.3%) |
| 75 Years and over | 0 (0.0%) | 0 (0.0%) |
Disability Class: Self-Care Difficulty
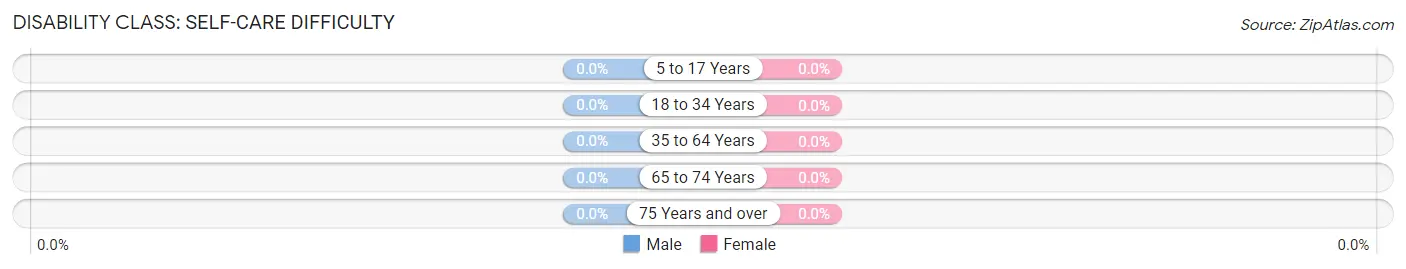
| Age Bracket | Male | Female |
| 5 to 17 Years | 0 (0.0%) | 0 (0.0%) |
| 18 to 34 Years | 0 (0.0%) | 0 (0.0%) |
| 35 to 64 Years | 0 (0.0%) | 0 (0.0%) |
| 65 to 74 Years | 0 (0.0%) | 0 (0.0%) |
| 75 Years and over | 0 (0.0%) | 0 (0.0%) |
Technology Access in Hollenberg
Computing Device Access in Hollenberg
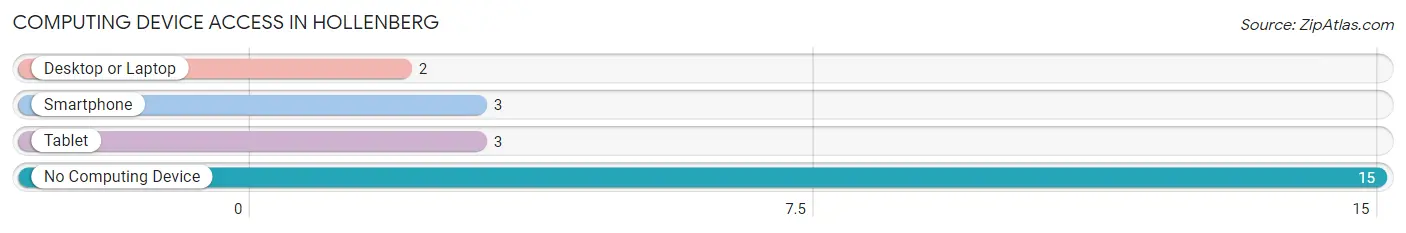
| Device Type | # Households | % Households |
| Desktop or Laptop | 2 | 11.1% |
| Smartphone | 3 | 16.7% |
| Tablet | 3 | 16.7% |
| No Computing Device | 15 | 83.3% |
| Total | 18 | 100.0% |
Internet Access in Hollenberg
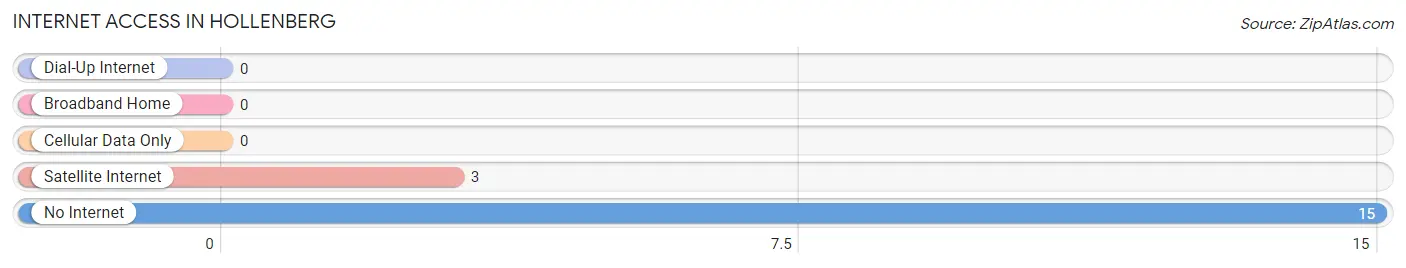
| Internet Type | # Households | % Households |
| Dial-Up Internet | 0 | 0.0% |
| Broadband Home | 0 | 0.0% |
| Cellular Data Only | 0 | 0.0% |
| Satellite Internet | 3 | 16.7% |
| No Internet | 15 | 83.3% |
| Total | 18 | 100.0% |
Hollenberg Summary
Hollenberg is a small unincorporated community located in Washington County, Kansas, United States. It is situated along the Big Blue River, approximately 10 miles east of Hanover. The population was estimated to be around 50 in 2020.
History
Hollenberg was founded in 1857 by German immigrants, who named it after their hometown of Hollenberg, Germany. The town was originally a trading post and stagecoach stop, and it quickly grew into a thriving community. The town was home to a post office, a general store, a blacksmith shop, a hotel, a saloon, and a school.
In 1864, the town was destroyed by a tornado, but it was quickly rebuilt. In 1867, the town was incorporated and a new school was built. The town continued to grow and prosper until the early 1900s, when the railroad bypassed it. This caused the town to decline, and by the 1950s, the population had dwindled to just a few dozen people.
Geography
Hollenberg is located at 39°45'45"N, 96°25'45"W (39.7625, -96.4292). It is situated along the Big Blue River, approximately 10 miles east of Hanover. The town is located in the rolling hills of the Great Plains, and the terrain is mostly flat. The climate is semi-arid, with hot summers and cold winters.
Economy
Hollenberg's economy is largely based on agriculture. The town is home to several farms, which produce corn, wheat, soybeans, and other crops. The town also has a few small businesses, including a general store, a gas station, and a restaurant.
Demographics
As of the 2010 census, the population of Hollenberg was estimated to be around 50 people. The racial makeup of the town was 97.1% White, 0.9% African American, 0.9% Native American, and 1.1% from other races. The median household income was $37,500, and the median family income was $41,250. The per capita income was $17,500.
Conclusion
Hollenberg is a small unincorporated community located in Washington County, Kansas. It was founded in 1857 by German immigrants, and it quickly grew into a thriving community. The town was destroyed by a tornado in 1864, but it was quickly rebuilt. The town declined in the early 1900s when the railroad bypassed it, and the population dwindled to just a few dozen people. Today, Hollenberg's economy is largely based on agriculture, and the town is home to several farms. The population of Hollenberg was estimated to be around 50 people in 2020.
Common Questions
What is Per Capita Income in Hollenberg?
Per Capita income in Hollenberg is $33,642.
What is the Median Household income in Hollenberg?
Median Household Income in Hollenberg is $47,778.
What is Inequality or Gini Index in Hollenberg?
Inequality or Gini Index in Hollenberg is 0.27.
What is the Total Population of Hollenberg?
Total Population of Hollenberg is 19.
What is the Total Male Population of Hollenberg?
Total Male Population of Hollenberg is 13.
What is the Total Female Population of Hollenberg?
Total Female Population of Hollenberg is 6.
What is the Ratio of Males per 100 Females in Hollenberg?
There are 216.67 Males per 100 Females in Hollenberg.
What is the Ratio of Females per 100 Males in Hollenberg?
There are 46.15 Females per 100 Males in Hollenberg.
What is the Median Population Age in Hollenberg?
Median Population Age in Hollenberg is 63.4 Years.
What is the Average Family Size in Hollenberg
Average Family Size in Hollenberg is 2.0 People.
What is the Average Household Size in Hollenberg
Average Household Size in Hollenberg is 1.1 People.
How Large is the Labor Force in Hollenberg?
There are 9 People in the Labor Forcein in Hollenberg.
What is the Percentage of People in the Labor Force in Hollenberg?
47.4% of People are in the Labor Force in Hollenberg.