Zip Codes with the Highest Percentage of Population with a Degree in Communications in Indiana
RELATED REPORTS & OPTIONS
Communications
Indiana
Compare Zip Codes
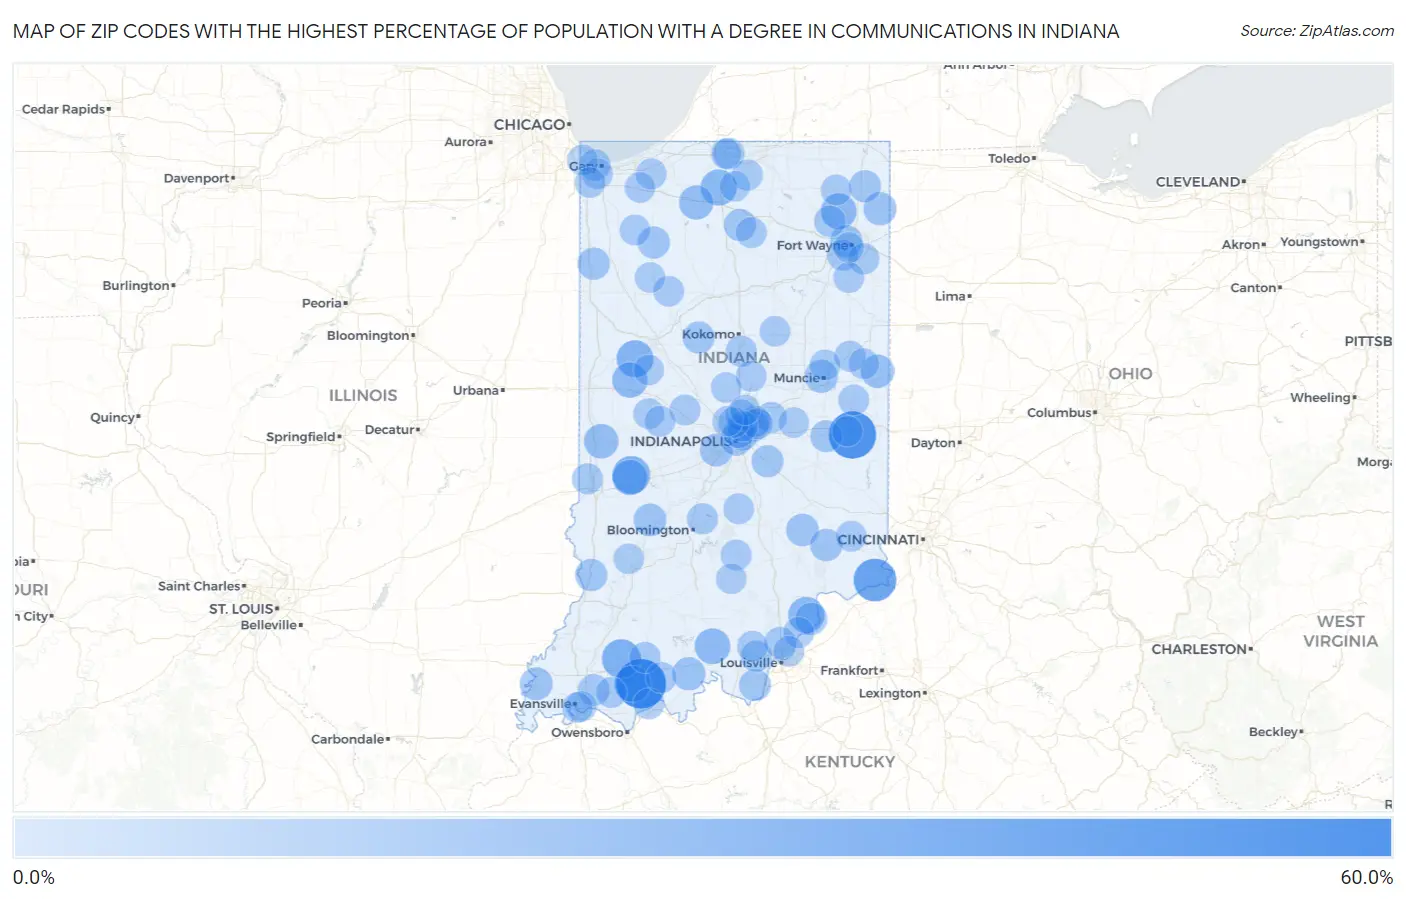
Map of Zip Codes with the Highest Percentage of Population with a Degree in Communications in Indiana
0.0%
60.0%
Zip Codes with the Highest Percentage of Population with a Degree in Communications in Indiana
| Zip Code | % Graduates | vs State | vs National | |
| 1. | 47552 | 50.9% | 3.7%(+47.2)#1 | 4.1%(+46.7)#43 |
| 2. | 47370 | 45.5% | 3.7%(+41.8)#2 | 4.1%(+41.3)#68 |
| 3. | 47020 | 34.3% | 3.7%(+30.7)#3 | 4.1%(+30.2)#115 |
| 4. | 47585 | 25.0% | 3.7%(+21.3)#4 | 4.1%(+20.9)#209 |
| 5. | 47853 | 23.1% | 3.7%(+19.4)#5 | 4.1%(+18.9)#250 |
| 6. | 47992 | 20.6% | 3.7%(+17.0)#6 | 4.1%(+16.5)#310 |
| 7. | 47537 | 19.7% | 3.7%(+16.0)#7 | 4.1%(+15.6)#345 |
| 8. | 47147 | 19.0% | 3.7%(+15.3)#8 | 4.1%(+14.8)#368 |
| 9. | 46537 | 18.9% | 3.7%(+15.3)#9 | 4.1%(+14.8)#371 |
| 10. | 46763 | 17.9% | 3.7%(+14.3)#10 | 4.1%(+13.8)#399 |
| 11. | 47140 | 17.7% | 3.7%(+14.1)#11 | 4.1%(+13.6)#410 |
| 12. | 47994 | 17.2% | 3.7%(+13.5)#12 | 4.1%(+13.1)#430 |
| 13. | 47857 | 16.7% | 3.7%(+13.0)#13 | 4.1%(+12.5)#457 |
| 14. | 47862 | 15.1% | 3.7%(+11.5)#14 | 4.1%(+11.0)#544 |
| 15. | 46531 | 14.5% | 3.7%(+10.8)#15 | 4.1%(+10.4)#585 |
| 16. | 47382 | 12.5% | 3.7%(+8.85)#16 | 4.1%(+8.36)#764 |
| 17. | 47576 | 12.4% | 3.7%(+8.71)#17 | 4.1%(+8.22)#780 |
| 18. | 47306 | 12.2% | 3.7%(+8.54)#18 | 4.1%(+8.06)#793 |
| 19. | 46785 | 11.6% | 3.7%(+7.93)#19 | 4.1%(+7.44)#884 |
| 20. | 47631 | 11.4% | 3.7%(+7.73)#20 | 4.1%(+7.25)#916 |
| 21. | 46231 | 11.2% | 3.7%(+7.58)#21 | 4.1%(+7.10)#939 |
| 22. | 47431 | 11.2% | 3.7%(+7.55)#22 | 4.1%(+7.06)#942 |
| 23. | 47283 | 10.7% | 3.7%(+7.06)#23 | 4.1%(+6.58)#1,021 |
| 24. | 46808 | 10.1% | 3.7%(+6.49)#24 | 4.1%(+6.01)#1,111 |
| 25. | 47957 | 10.0% | 3.7%(+6.35)#25 | 4.1%(+5.86)#1,134 |
| 26. | 47963 | 10.0% | 3.7%(+6.30)#26 | 4.1%(+5.82)#1,163 |
| 27. | 47561 | 9.9% | 3.7%(+6.24)#27 | 4.1%(+5.76)#1,174 |
| 28. | 47023 | 9.8% | 3.7%(+6.16)#28 | 4.1%(+5.68)#1,191 |
| 29. | 46570 | 9.7% | 3.7%(+6.03)#29 | 4.1%(+5.54)#1,220 |
| 30. | 47162 | 9.6% | 3.7%(+5.94)#30 | 4.1%(+5.45)#1,244 |
| 31. | 46793 | 9.5% | 3.7%(+5.81)#31 | 4.1%(+5.32)#1,283 |
| 32. | 46126 | 9.2% | 3.7%(+5.59)#32 | 4.1%(+5.10)#1,344 |
| 33. | 46216 | 9.1% | 3.7%(+5.45)#33 | 4.1%(+4.97)#1,395 |
| 34. | 47352 | 9.0% | 3.7%(+5.39)#34 | 4.1%(+4.90)#1,420 |
| 35. | 46920 | 8.9% | 3.7%(+5.28)#35 | 4.1%(+4.79)#1,463 |
| 36. | 47117 | 8.9% | 3.7%(+5.24)#36 | 4.1%(+4.76)#1,475 |
| 37. | 47610 | 8.5% | 3.7%(+4.80)#37 | 4.1%(+4.32)#1,655 |
| 38. | 46723 | 8.2% | 3.7%(+4.56)#38 | 4.1%(+4.07)#1,761 |
| 39. | 46204 | 8.1% | 3.7%(+4.46)#39 | 4.1%(+3.98)#1,809 |
| 40. | 46615 | 8.0% | 3.7%(+4.35)#40 | 4.1%(+3.87)#1,879 |
| 41. | 46406 | 7.8% | 3.7%(+4.15)#41 | 4.1%(+3.66)#2,012 |
| 42. | 47122 | 7.7% | 3.7%(+4.03)#42 | 4.1%(+3.54)#2,080 |
| 43. | 47172 | 7.6% | 3.7%(+3.98)#43 | 4.1%(+3.50)#2,108 |
| 44. | 46809 | 7.4% | 3.7%(+3.78)#44 | 4.1%(+3.30)#2,242 |
| 45. | 46068 | 7.4% | 3.7%(+3.76)#45 | 4.1%(+3.28)#2,255 |
| 46. | 46816 | 7.4% | 3.7%(+3.73)#46 | 4.1%(+3.25)#2,277 |
| 47. | 46218 | 7.4% | 3.7%(+3.71)#47 | 4.1%(+3.22)#2,299 |
| 48. | 47542 | 7.3% | 3.7%(+3.70)#48 | 4.1%(+3.21)#2,304 |
| 49. | 46040 | 7.3% | 3.7%(+3.69)#49 | 4.1%(+3.21)#2,306 |
| 50. | 46205 | 7.2% | 3.7%(+3.55)#50 | 4.1%(+3.07)#2,432 |
| 51. | 47408 | 7.2% | 3.7%(+3.54)#51 | 4.1%(+3.05)#2,447 |
| 52. | 47615 | 7.1% | 3.7%(+3.40)#52 | 4.1%(+2.92)#2,550 |
| 53. | 47373 | 7.0% | 3.7%(+3.37)#53 | 4.1%(+2.89)#2,587 |
| 54. | 47876 | 7.0% | 3.7%(+3.33)#54 | 4.1%(+2.84)#2,627 |
| 55. | 46256 | 7.0% | 3.7%(+3.32)#55 | 4.1%(+2.84)#2,632 |
| 56. | 46573 | 6.9% | 3.7%(+3.28)#56 | 4.1%(+2.80)#2,671 |
| 57. | 47235 | 6.9% | 3.7%(+3.27)#57 | 4.1%(+2.79)#2,680 |
| 58. | 46539 | 6.9% | 3.7%(+3.22)#58 | 4.1%(+2.73)#2,733 |
| 59. | 46031 | 6.9% | 3.7%(+3.21)#59 | 4.1%(+2.73)#2,738 |
| 60. | 47577 | 6.8% | 3.7%(+3.20)#60 | 4.1%(+2.71)#2,746 |
| 61. | 47111 | 6.8% | 3.7%(+3.19)#61 | 4.1%(+2.70)#2,754 |
| 62. | 46147 | 6.8% | 3.7%(+3.14)#62 | 4.1%(+2.66)#2,794 |
| 63. | 46280 | 6.8% | 3.7%(+3.12)#63 | 4.1%(+2.64)#2,822 |
| 64. | 46236 | 6.7% | 3.7%(+3.02)#64 | 4.1%(+2.53)#2,937 |
| 65. | 47965 | 6.7% | 3.7%(+3.02)#65 | 4.1%(+2.53)#2,952 |
| 66. | 47380 | 6.6% | 3.7%(+2.95)#66 | 4.1%(+2.47)#3,012 |
| 67. | 47601 | 6.5% | 3.7%(+2.88)#67 | 4.1%(+2.39)#3,102 |
| 68. | 47303 | 6.5% | 3.7%(+2.85)#68 | 4.1%(+2.37)#3,129 |
| 69. | 47358 | 6.5% | 3.7%(+2.84)#69 | 4.1%(+2.36)#3,142 |
| 70. | 47130 | 6.5% | 3.7%(+2.82)#70 | 4.1%(+2.34)#3,160 |
| 71. | 47031 | 6.5% | 3.7%(+2.82)#71 | 4.1%(+2.33)#3,169 |
| 72. | 47124 | 6.5% | 3.7%(+2.81)#72 | 4.1%(+2.33)#3,180 |
| 73. | 47954 | 6.5% | 3.7%(+2.80)#73 | 4.1%(+2.32)#3,189 |
| 74. | 47960 | 6.4% | 3.7%(+2.77)#74 | 4.1%(+2.29)#3,214 |
| 75. | 46755 | 6.4% | 3.7%(+2.76)#75 | 4.1%(+2.27)#3,235 |
| 76. | 46777 | 6.4% | 3.7%(+2.75)#76 | 4.1%(+2.27)#3,241 |
| 77. | 46408 | 6.4% | 3.7%(+2.72)#77 | 4.1%(+2.23)#3,295 |
| 78. | 46391 | 6.4% | 3.7%(+2.70)#78 | 4.1%(+2.22)#3,309 |
| 79. | 46220 | 6.3% | 3.7%(+2.61)#79 | 4.1%(+2.13)#3,405 |
| 80. | 46392 | 6.2% | 3.7%(+2.59)#80 | 4.1%(+2.11)#3,434 |
| 81. | 46327 | 6.2% | 3.7%(+2.57)#81 | 4.1%(+2.09)#3,459 |
| 82. | 46260 | 6.2% | 3.7%(+2.57)#82 | 4.1%(+2.08)#3,465 |
| 83. | 47714 | 6.2% | 3.7%(+2.51)#83 | 4.1%(+2.02)#3,539 |
| 84. | 46164 | 6.1% | 3.7%(+2.46)#84 | 4.1%(+1.98)#3,614 |
| 85. | 46383 | 6.1% | 3.7%(+2.44)#85 | 4.1%(+1.96)#3,638 |
| 86. | 46986 | 6.1% | 3.7%(+2.44)#86 | 4.1%(+1.96)#3,644 |
| 87. | 47443 | 5.9% | 3.7%(+2.29)#87 | 4.1%(+1.81)#3,873 |
| 88. | 47327 | 5.9% | 3.7%(+2.23)#88 | 4.1%(+1.75)#3,962 |
| 89. | 46375 | 5.9% | 3.7%(+2.23)#89 | 4.1%(+1.74)#3,985 |
| 90. | 46802 | 5.9% | 3.7%(+2.21)#90 | 4.1%(+1.73)#4,005 |
| 91. | 46069 | 5.8% | 3.7%(+2.19)#91 | 4.1%(+1.71)#4,039 |
| 92. | 47981 | 5.8% | 3.7%(+2.19)#92 | 4.1%(+1.71)#4,041 |
| 93. | 47260 | 5.8% | 3.7%(+2.17)#93 | 4.1%(+1.69)#4,074 |
| 94. | 47959 | 5.8% | 3.7%(+2.10)#94 | 4.1%(+1.62)#4,173 |
| 95. | 46268 | 5.8% | 3.7%(+2.10)#95 | 4.1%(+1.62)#4,179 |
| 96. | 46186 | 5.7% | 3.7%(+2.05)#96 | 4.1%(+1.57)#4,269 |
| 97. | 46617 | 5.7% | 3.7%(+2.05)#97 | 4.1%(+1.57)#4,270 |
| 98. | 46506 | 5.7% | 3.7%(+2.04)#98 | 4.1%(+1.56)#4,286 |
| 99. | 46033 | 5.6% | 3.7%(+1.99)#99 | 4.1%(+1.51)#4,374 |
| 100. | 47713 | 5.6% | 3.7%(+1.97)#100 | 4.1%(+1.48)#4,409 |
Common Questions
What are the Top 10 Zip Codes with the Highest Percentage of Population with a Degree in Communications in Indiana?
Top 10 Zip Codes with the Highest Percentage of Population with a Degree in Communications in Indiana are:
What zip code has the Highest Percentage of Population with a Degree in Communications in Indiana?
47552 has the Highest Percentage of Population with a Degree in Communications in Indiana with 50.9%.
What is the Percentage of Population with a Degree in Communications in the State of Indiana?
Percentage of Population with a Degree in Communications in Indiana is 3.7%.
What is the Percentage of Population with a Degree in Communications in the United States?
Percentage of Population with a Degree in Communications in the United States is 4.1%.