Zip Codes with the Highest Percentage of Population Employed in Sales & Related in Indiana
RELATED REPORTS & OPTIONS
Sales & Related
Indiana
Compare Zip Codes
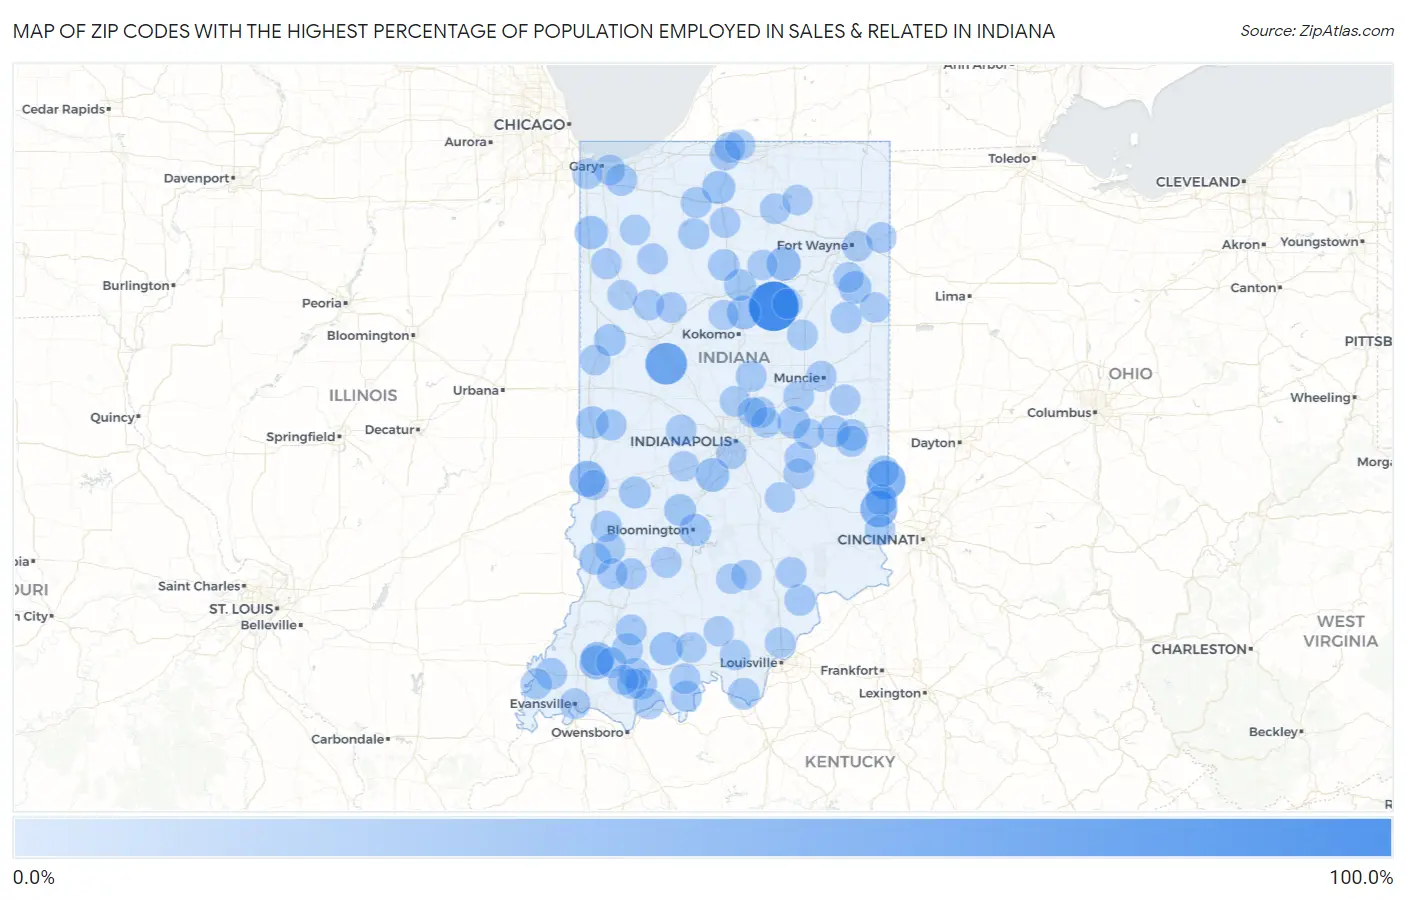
Map of Zip Codes with the Highest Percentage of Population Employed in Sales & Related in Indiana
0.0%
100.0%
Zip Codes with the Highest Percentage of Population Employed in Sales & Related in Indiana
| Zip Code | % Employed | vs State | vs National | |
| 1. | 46984 | 100.0% | 8.8%(+91.2)#1 | 9.6%(+90.4)#38 |
| 2. | 47983 | 63.0% | 8.8%(+54.2)#2 | 9.6%(+53.4)#61 |
| 3. | 47010 | 50.0% | 8.8%(+41.2)#3 | 9.6%(+40.4)#104 |
| 4. | 47035 | 41.9% | 8.8%(+33.1)#4 | 9.6%(+32.3)#186 |
| 5. | 47876 | 37.1% | 8.8%(+28.3)#5 | 9.6%(+27.5)#237 |
| 6. | 46980 | 28.8% | 8.8%(+20.0)#6 | 9.6%(+19.2)#442 |
| 7. | 47654 | 27.3% | 8.8%(+18.4)#7 | 9.6%(+17.7)#511 |
| 8. | 47683 | 26.9% | 8.8%(+18.1)#8 | 9.6%(+17.3)#523 |
| 9. | 46111 | 26.8% | 8.8%(+17.9)#9 | 9.6%(+17.2)#529 |
| 10. | 46914 | 26.5% | 8.8%(+17.7)#10 | 9.6%(+16.9)#543 |
| 11. | 46379 | 25.2% | 8.8%(+16.3)#11 | 9.6%(+15.6)#615 |
| 12. | 46537 | 24.5% | 8.8%(+15.6)#12 | 9.6%(+14.9)#687 |
| 13. | 47580 | 24.3% | 8.8%(+15.5)#13 | 9.6%(+14.7)#697 |
| 14. | 46731 | 22.6% | 8.8%(+13.8)#14 | 9.6%(+13.0)#836 |
| 15. | 47966 | 21.3% | 8.8%(+12.4)#15 | 9.6%(+11.7)#986 |
| 16. | 46186 | 21.0% | 8.8%(+12.2)#16 | 9.6%(+11.4)#1,016 |
| 17. | 47405 | 20.8% | 8.8%(+12.0)#17 | 9.6%(+11.2)#1,035 |
| 18. | 47840 | 19.1% | 8.8%(+10.2)#18 | 9.6%(+9.48)#1,325 |
| 19. | 47838 | 18.9% | 8.8%(+10.1)#19 | 9.6%(+9.33)#1,364 |
| 20. | 47016 | 18.8% | 8.8%(+9.95)#20 | 9.6%(+9.19)#1,386 |
| 21. | 47975 | 18.5% | 8.8%(+9.68)#21 | 9.6%(+8.92)#1,431 |
| 22. | 46958 | 18.5% | 8.8%(+9.68)#22 | 9.6%(+8.92)#1,432 |
| 23. | 47464 | 18.3% | 8.8%(+9.45)#23 | 9.6%(+8.69)#1,491 |
| 24. | 47135 | 18.2% | 8.8%(+9.40)#24 | 9.6%(+8.64)#1,505 |
| 25. | 47633 | 17.6% | 8.8%(+8.72)#25 | 9.6%(+7.96)#1,675 |
| 26. | 47387 | 17.5% | 8.8%(+8.69)#26 | 9.6%(+7.93)#1,685 |
| 27. | 46931 | 17.4% | 8.8%(+8.55)#27 | 9.6%(+7.80)#1,719 |
| 28. | 46393 | 17.3% | 8.8%(+8.44)#28 | 9.6%(+7.69)#1,748 |
| 29. | 47370 | 17.1% | 8.8%(+8.30)#29 | 9.6%(+7.55)#1,791 |
| 30. | 47138 | 16.8% | 8.8%(+8.00)#30 | 9.6%(+7.25)#1,884 |
| 31. | 47552 | 16.7% | 8.8%(+7.91)#31 | 9.6%(+7.15)#1,912 |
| 32. | 47523 | 16.5% | 8.8%(+7.62)#32 | 9.6%(+6.87)#2,031 |
| 33. | 47631 | 16.4% | 8.8%(+7.60)#33 | 9.6%(+6.84)#2,040 |
| 34. | 46759 | 16.0% | 8.8%(+7.16)#34 | 9.6%(+6.40)#2,237 |
| 35. | 47357 | 16.0% | 8.8%(+7.15)#35 | 9.6%(+6.40)#2,243 |
| 36. | 47003 | 15.9% | 8.8%(+7.10)#36 | 9.6%(+6.34)#2,266 |
| 37. | 46031 | 15.9% | 8.8%(+7.10)#37 | 9.6%(+6.34)#2,267 |
| 38. | 46960 | 15.9% | 8.8%(+7.05)#38 | 9.6%(+6.30)#2,284 |
| 39. | 47615 | 15.5% | 8.8%(+6.62)#39 | 9.6%(+5.86)#2,493 |
| 40. | 47590 | 15.4% | 8.8%(+6.61)#40 | 9.6%(+5.85)#2,499 |
| 41. | 47855 | 15.0% | 8.8%(+6.15)#41 | 9.6%(+5.39)#2,740 |
| 42. | 47520 | 15.0% | 8.8%(+6.14)#42 | 9.6%(+5.38)#2,750 |
| 43. | 47564 | 15.0% | 8.8%(+6.12)#43 | 9.6%(+5.36)#2,763 |
| 44. | 46531 | 14.9% | 8.8%(+6.07)#44 | 9.6%(+5.32)#2,799 |
| 45. | 46037 | 14.8% | 8.8%(+5.94)#45 | 9.6%(+5.18)#2,880 |
| 46. | 47832 | 14.7% | 8.8%(+5.90)#46 | 9.6%(+5.14)#2,909 |
| 47. | 47529 | 14.7% | 8.8%(+5.88)#47 | 9.6%(+5.13)#2,916 |
| 48. | 47354 | 14.7% | 8.8%(+5.87)#48 | 9.6%(+5.11)#2,930 |
| 49. | 46017 | 14.7% | 8.8%(+5.86)#49 | 9.6%(+5.11)#2,940 |
| 50. | 46104 | 14.7% | 8.8%(+5.83)#50 | 9.6%(+5.07)#2,964 |
| 51. | 47946 | 14.6% | 8.8%(+5.72)#51 | 9.6%(+4.97)#3,038 |
| 52. | 46933 | 14.5% | 8.8%(+5.62)#52 | 9.6%(+4.86)#3,106 |
| 53. | 47227 | 14.4% | 8.8%(+5.57)#53 | 9.6%(+4.81)#3,149 |
| 54. | 47453 | 14.3% | 8.8%(+5.45)#54 | 9.6%(+4.69)#3,262 |
| 55. | 47964 | 14.3% | 8.8%(+5.45)#55 | 9.6%(+4.69)#3,269 |
| 56. | 47929 | 14.2% | 8.8%(+5.32)#56 | 9.6%(+4.57)#3,349 |
| 57. | 47596 | 14.1% | 8.8%(+5.26)#57 | 9.6%(+4.51)#3,388 |
| 58. | 46601 | 14.1% | 8.8%(+5.24)#58 | 9.6%(+4.48)#3,411 |
| 59. | 46635 | 14.0% | 8.8%(+5.11)#59 | 9.6%(+4.36)#3,517 |
| 60. | 46405 | 13.9% | 8.8%(+5.01)#60 | 9.6%(+4.26)#3,594 |
| 61. | 47306 | 13.8% | 8.8%(+5.01)#61 | 9.6%(+4.25)#3,598 |
| 62. | 47993 | 13.8% | 8.8%(+4.97)#62 | 9.6%(+4.21)#3,637 |
| 63. | 47708 | 13.8% | 8.8%(+4.94)#63 | 9.6%(+4.18)#3,672 |
| 64. | 46150 | 13.8% | 8.8%(+4.91)#64 | 9.6%(+4.16)#3,698 |
| 65. | 47537 | 13.7% | 8.8%(+4.90)#65 | 9.6%(+4.15)#3,704 |
| 66. | 46501 | 13.7% | 8.8%(+4.90)#66 | 9.6%(+4.14)#3,712 |
| 67. | 47514 | 13.7% | 8.8%(+4.89)#67 | 9.6%(+4.13)#3,728 |
| 68. | 47584 | 13.5% | 8.8%(+4.67)#68 | 9.6%(+3.92)#3,928 |
| 69. | 46777 | 13.5% | 8.8%(+4.62)#69 | 9.6%(+3.87)#3,978 |
| 70. | 47997 | 13.4% | 8.8%(+4.55)#70 | 9.6%(+3.80)#4,044 |
| 71. | 46803 | 13.4% | 8.8%(+4.52)#71 | 9.6%(+3.77)#4,080 |
| 72. | 46217 | 13.3% | 8.8%(+4.50)#72 | 9.6%(+3.74)#4,115 |
| 73. | 46074 | 13.3% | 8.8%(+4.46)#73 | 9.6%(+3.71)#4,162 |
| 74. | 46165 | 13.3% | 8.8%(+4.43)#74 | 9.6%(+3.68)#4,188 |
| 75. | 46322 | 13.2% | 8.8%(+4.41)#75 | 9.6%(+3.65)#4,224 |
| 76. | 46538 | 13.1% | 8.8%(+4.31)#76 | 9.6%(+3.55)#4,331 |
| 77. | 46797 | 13.1% | 8.8%(+4.22)#77 | 9.6%(+3.46)#4,420 |
| 78. | 47166 | 12.9% | 8.8%(+4.10)#78 | 9.6%(+3.35)#4,541 |
| 79. | 47175 | 12.9% | 8.8%(+4.05)#79 | 9.6%(+3.29)#4,619 |
| 80. | 47260 | 12.8% | 8.8%(+4.00)#80 | 9.6%(+3.24)#4,689 |
| 81. | 47848 | 12.8% | 8.8%(+3.99)#81 | 9.6%(+3.24)#4,700 |
| 82. | 47234 | 12.8% | 8.8%(+3.94)#82 | 9.6%(+3.19)#4,779 |
| 83. | 46392 | 12.8% | 8.8%(+3.93)#83 | 9.6%(+3.17)#4,797 |
| 84. | 46530 | 12.7% | 8.8%(+3.82)#84 | 9.6%(+3.07)#4,935 |
| 85. | 46732 | 12.7% | 8.8%(+3.82)#85 | 9.6%(+3.06)#4,943 |
| 86. | 46940 | 12.6% | 8.8%(+3.73)#86 | 9.6%(+2.98)#5,046 |
| 87. | 47025 | 12.6% | 8.8%(+3.73)#87 | 9.6%(+2.97)#5,058 |
| 88. | 46180 | 12.5% | 8.8%(+3.66)#88 | 9.6%(+2.90)#5,175 |
| 89. | 47172 | 12.4% | 8.8%(+3.60)#89 | 9.6%(+2.85)#5,265 |
| 90. | 47807 | 12.4% | 8.8%(+3.59)#90 | 9.6%(+2.84)#5,276 |
| 91. | 47220 | 12.4% | 8.8%(+3.57)#91 | 9.6%(+2.82)#5,310 |
| 92. | 46055 | 12.4% | 8.8%(+3.54)#92 | 9.6%(+2.79)#5,350 |
| 93. | 46148 | 12.4% | 8.8%(+3.53)#93 | 9.6%(+2.78)#5,371 |
| 94. | 47977 | 12.2% | 8.8%(+3.39)#94 | 9.6%(+2.64)#5,613 |
| 95. | 47125 | 12.2% | 8.8%(+3.37)#95 | 9.6%(+2.62)#5,640 |
| 96. | 46711 | 12.2% | 8.8%(+3.34)#96 | 9.6%(+2.58)#5,712 |
| 97. | 46974 | 12.2% | 8.8%(+3.31)#97 | 9.6%(+2.56)#5,761 |
| 98. | 46932 | 12.1% | 8.8%(+3.30)#98 | 9.6%(+2.54)#5,787 |
| 99. | 46038 | 12.1% | 8.8%(+3.27)#99 | 9.6%(+2.51)#5,855 |
| 100. | 47637 | 12.1% | 8.8%(+3.26)#100 | 9.6%(+2.50)#5,875 |
Common Questions
What are the Top 10 Zip Codes with the Highest Percentage of Population Employed in Sales & Related in Indiana?
Top 10 Zip Codes with the Highest Percentage of Population Employed in Sales & Related in Indiana are:
What zip code has the Highest Percentage of Population Employed in Sales & Related in Indiana?
46984 has the Highest Percentage of Population Employed in Sales & Related in Indiana with 100.0%.
What is the Percentage of Population Employed in Sales & Related in the State of Indiana?
Percentage of Population Employed in Sales & Related in Indiana is 8.8%.
What is the Percentage of Population Employed in Sales & Related in the United States?
Percentage of Population Employed in Sales & Related in the United States is 9.6%.