Zip Codes with the Highest Percentage of Families with Income Below $10,000 in Indiana
RELATED REPORTS & OPTIONS
Family Income | $0-10k
Indiana
Compare Zip Codes
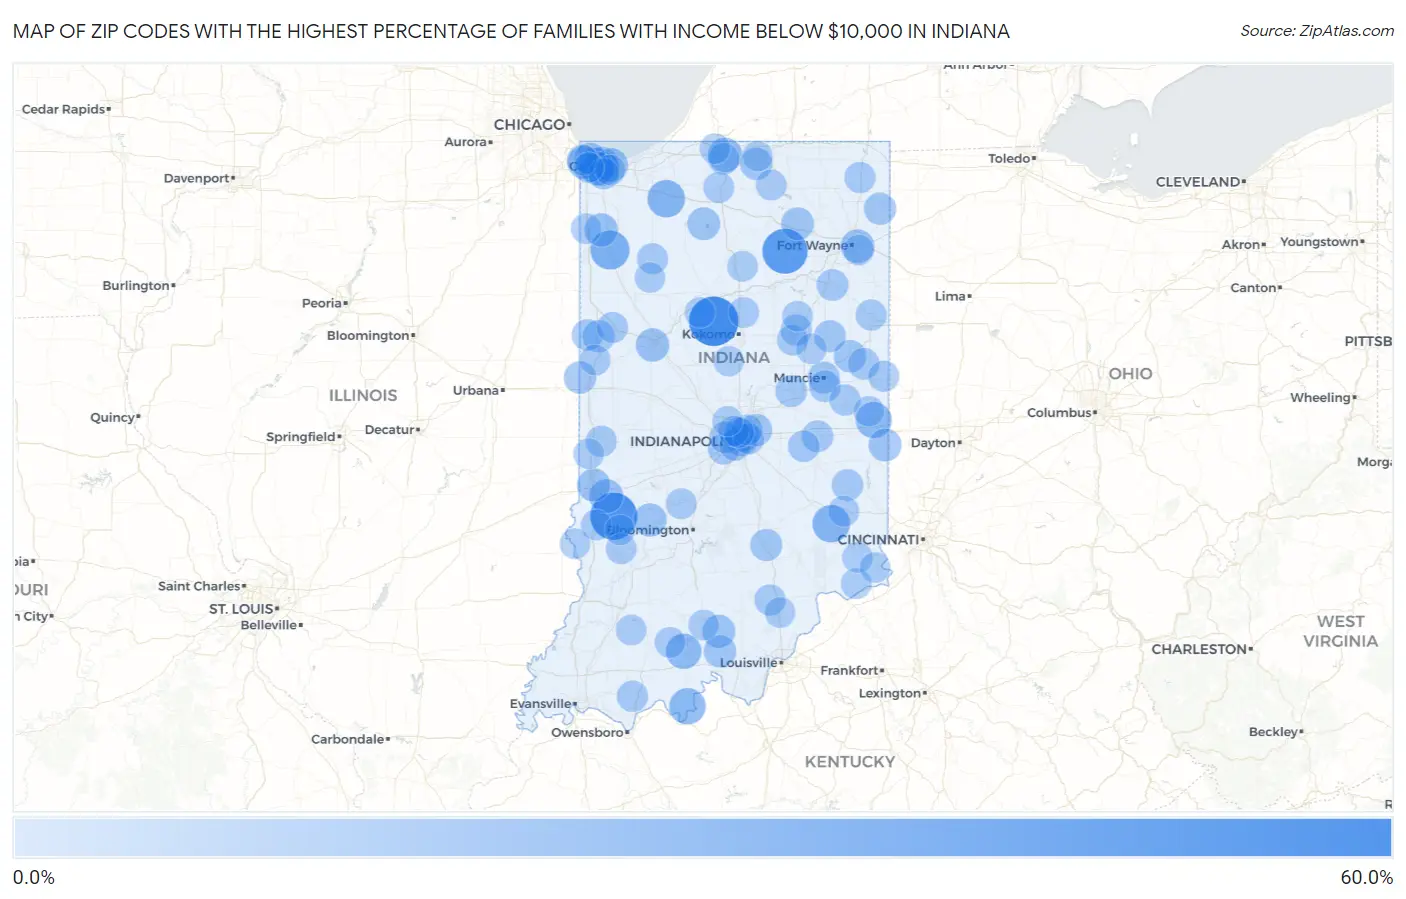
Map of Zip Codes with the Highest Percentage of Families with Income Below $10,000 in Indiana
0.0%
60.0%
Zip Codes with the Highest Percentage of Families with Income Below $10,000 in Indiana
| Zip Code | Families with Income < $10k | vs State | vs National | |
| 1. | 46998 | 51.7% | 3.1%(+48.6)#1 | 3.1%(+48.6)#59 |
| 2. | 47858 | 45.8% | 3.1%(+42.7)#2 | 3.1%(+42.7)#77 |
| 3. | 46946 | 40.9% | 3.1%(+37.8)#3 | 3.1%(+37.8)#102 |
| 4. | 47943 | 26.4% | 3.1%(+23.3)#4 | 3.1%(+23.3)#267 |
| 5. | 47034 | 22.7% | 3.1%(+19.6)#5 | 3.1%(+19.6)#383 |
| 6. | 46340 | 22.4% | 3.1%(+19.3)#6 | 3.1%(+19.3)#391 |
| 7. | 47574 | 19.6% | 3.1%(+16.5)#7 | 3.1%(+16.5)#503 |
| 8. | 47392 | 19.1% | 3.1%(+16.0)#8 | 3.1%(+16.0)#525 |
| 9. | 47116 | 17.4% | 3.1%(+14.3)#9 | 3.1%(+14.3)#637 |
| 10. | 46406 | 15.4% | 3.1%(+12.3)#10 | 3.1%(+12.3)#809 |
| 11. | 46601 | 15.3% | 3.1%(+12.2)#11 | 3.1%(+12.2)#826 |
| 12. | 47871 | 14.3% | 3.1%(+11.2)#12 | 3.1%(+11.2)#942 |
| 13. | 46402 | 14.1% | 3.1%(+11.0)#13 | 3.1%(+11.0)#959 |
| 14. | 46407 | 13.7% | 3.1%(+10.6)#14 | 3.1%(+10.6)#1,014 |
| 15. | 46803 | 13.6% | 3.1%(+10.5)#15 | 3.1%(+10.5)#1,028 |
| 16. | 46403 | 13.5% | 3.1%(+10.4)#16 | 3.1%(+10.4)#1,045 |
| 17. | 46404 | 12.9% | 3.1%(+9.80)#17 | 3.1%(+9.80)#1,135 |
| 18. | 47901 | 12.9% | 3.1%(+9.80)#18 | 3.1%(+9.80)#1,139 |
| 19. | 46381 | 12.8% | 3.1%(+9.70)#19 | 3.1%(+9.70)#1,172 |
| 20. | 47431 | 12.6% | 3.1%(+9.50)#20 | 3.1%(+9.50)#1,203 |
| 21. | 46218 | 12.2% | 3.1%(+9.10)#21 | 3.1%(+9.10)#1,275 |
| 22. | 47807 | 12.0% | 3.1%(+8.90)#22 | 3.1%(+8.90)#1,320 |
| 23. | 46320 | 11.9% | 3.1%(+8.80)#23 | 3.1%(+8.80)#1,342 |
| 24. | 47125 | 11.9% | 3.1%(+8.80)#24 | 3.1%(+8.80)#1,355 |
| 25. | 47324 | 11.6% | 3.1%(+8.50)#25 | 3.1%(+8.50)#1,440 |
| 26. | 46511 | 11.5% | 3.1%(+8.40)#26 | 3.1%(+8.40)#1,456 |
| 27. | 46764 | 11.3% | 3.1%(+8.20)#27 | 3.1%(+8.20)#1,514 |
| 28. | 46517 | 10.6% | 3.1%(+7.50)#28 | 3.1%(+7.50)#1,701 |
| 29. | 47373 | 10.6% | 3.1%(+7.50)#29 | 3.1%(+7.50)#1,714 |
| 30. | 47145 | 10.6% | 3.1%(+7.50)#30 | 3.1%(+7.50)#1,717 |
| 31. | 47982 | 10.4% | 3.1%(+7.30)#31 | 3.1%(+7.30)#1,795 |
| 32. | 46201 | 9.9% | 3.1%(+6.80)#32 | 3.1%(+6.80)#1,949 |
| 33. | 46785 | 9.9% | 3.1%(+6.80)#33 | 3.1%(+6.80)#1,967 |
| 34. | 47921 | 9.9% | 3.1%(+6.80)#34 | 3.1%(+6.80)#1,973 |
| 35. | 46235 | 9.7% | 3.1%(+6.60)#35 | 3.1%(+6.60)#2,030 |
| 36. | 46312 | 9.6% | 3.1%(+6.50)#36 | 3.1%(+6.50)#2,069 |
| 37. | 47247 | 9.6% | 3.1%(+6.50)#37 | 3.1%(+6.50)#2,105 |
| 38. | 47305 | 9.4% | 3.1%(+6.30)#38 | 3.1%(+6.30)#2,171 |
| 39. | 47348 | 9.3% | 3.1%(+6.20)#39 | 3.1%(+6.20)#2,205 |
| 40. | 46770 | 9.0% | 3.1%(+5.90)#40 | 3.1%(+5.90)#2,378 |
| 41. | 47302 | 8.9% | 3.1%(+5.80)#41 | 3.1%(+5.80)#2,402 |
| 42. | 46241 | 8.8% | 3.1%(+5.70)#42 | 3.1%(+5.70)#2,450 |
| 43. | 46016 | 8.8% | 3.1%(+5.70)#43 | 3.1%(+5.70)#2,457 |
| 44. | 47337 | 8.8% | 3.1%(+5.70)#44 | 3.1%(+5.70)#2,499 |
| 45. | 47380 | 8.6% | 3.1%(+5.50)#45 | 3.1%(+5.50)#2,603 |
| 46. | 46613 | 8.5% | 3.1%(+5.40)#46 | 3.1%(+5.40)#2,638 |
| 47. | 47024 | 8.5% | 3.1%(+5.40)#47 | 3.1%(+5.40)#2,664 |
| 48. | 46224 | 8.4% | 3.1%(+5.30)#48 | 3.1%(+5.30)#2,704 |
| 49. | 46115 | 8.4% | 3.1%(+5.30)#49 | 3.1%(+5.30)#2,750 |
| 50. | 46225 | 8.3% | 3.1%(+5.20)#50 | 3.1%(+5.20)#2,790 |
| 51. | 47917 | 8.3% | 3.1%(+5.20)#51 | 3.1%(+5.20)#2,816 |
| 52. | 47611 | 7.9% | 3.1%(+4.80)#52 | 3.1%(+4.80)#3,060 |
| 53. | 46953 | 7.8% | 3.1%(+4.70)#53 | 3.1%(+4.70)#3,081 |
| 54. | 47862 | 7.8% | 3.1%(+4.70)#54 | 3.1%(+4.70)#3,103 |
| 55. | 46740 | 7.7% | 3.1%(+4.60)#55 | 3.1%(+4.60)#3,144 |
| 56. | 47354 | 7.7% | 3.1%(+4.60)#56 | 3.1%(+4.60)#3,162 |
| 57. | 47170 | 7.5% | 3.1%(+4.40)#57 | 3.1%(+4.40)#3,278 |
| 58. | 46705 | 7.5% | 3.1%(+4.40)#58 | 3.1%(+4.40)#3,303 |
| 59. | 46409 | 7.4% | 3.1%(+4.30)#59 | 3.1%(+4.30)#3,353 |
| 60. | 47946 | 7.3% | 3.1%(+4.20)#60 | 3.1%(+4.20)#3,438 |
| 61. | 47971 | 7.3% | 3.1%(+4.20)#61 | 3.1%(+4.20)#3,440 |
| 62. | 46219 | 7.2% | 3.1%(+4.10)#62 | 3.1%(+4.10)#3,467 |
| 63. | 47390 | 7.2% | 3.1%(+4.10)#63 | 3.1%(+4.10)#3,499 |
| 64. | 46938 | 7.2% | 3.1%(+4.10)#64 | 3.1%(+4.10)#3,508 |
| 65. | 46537 | 7.1% | 3.1%(+4.00)#65 | 3.1%(+4.00)#3,606 |
| 66. | 46553 | 7.0% | 3.1%(+3.90)#66 | 3.1%(+3.90)#3,655 |
| 67. | 47441 | 6.9% | 3.1%(+3.80)#67 | 3.1%(+3.80)#3,720 |
| 68. | 47879 | 6.9% | 3.1%(+3.80)#68 | 3.1%(+3.80)#3,737 |
| 69. | 47006 | 6.8% | 3.1%(+3.70)#69 | 3.1%(+3.70)#3,819 |
| 70. | 47521 | 6.8% | 3.1%(+3.70)#70 | 3.1%(+3.70)#3,863 |
| 71. | 47433 | 6.7% | 3.1%(+3.60)#71 | 3.1%(+3.60)#3,937 |
| 72. | 46327 | 6.6% | 3.1%(+3.50)#72 | 3.1%(+3.50)#4,013 |
| 73. | 47993 | 6.6% | 3.1%(+3.50)#73 | 3.1%(+3.50)#4,037 |
| 74. | 46226 | 6.5% | 3.1%(+3.40)#74 | 3.1%(+3.40)#4,093 |
| 75. | 46914 | 6.5% | 3.1%(+3.40)#75 | 3.1%(+3.40)#4,144 |
| 76. | 46952 | 6.4% | 3.1%(+3.30)#76 | 3.1%(+3.30)#4,224 |
| 77. | 47454 | 6.4% | 3.1%(+3.30)#77 | 3.1%(+3.30)#4,238 |
| 78. | 47043 | 6.4% | 3.1%(+3.30)#78 | 3.1%(+3.30)#4,248 |
| 79. | 47564 | 6.4% | 3.1%(+3.30)#79 | 3.1%(+3.30)#4,264 |
| 80. | 46951 | 6.3% | 3.1%(+3.20)#80 | 3.1%(+3.20)#4,359 |
| 81. | 47393 | 6.3% | 3.1%(+3.20)#81 | 3.1%(+3.20)#4,366 |
| 82. | 46376 | 6.3% | 3.1%(+3.20)#82 | 3.1%(+3.20)#4,412 |
| 83. | 46405 | 6.2% | 3.1%(+3.10)#83 | 3.1%(+3.10)#4,456 |
| 84. | 47018 | 6.2% | 3.1%(+3.10)#84 | 3.1%(+3.10)#4,470 |
| 85. | 46208 | 6.1% | 3.1%(+3.00)#85 | 3.1%(+3.00)#4,546 |
| 86. | 46917 | 6.1% | 3.1%(+3.00)#86 | 3.1%(+3.00)#4,599 |
| 87. | 46628 | 6.0% | 3.1%(+2.90)#87 | 3.1%(+2.90)#4,645 |
| 88. | 46806 | 6.0% | 3.1%(+2.90)#88 | 3.1%(+2.90)#4,649 |
| 89. | 47842 | 6.0% | 3.1%(+2.90)#89 | 3.1%(+2.90)#4,674 |
| 90. | 46049 | 6.0% | 3.1%(+2.90)#90 | 3.1%(+2.90)#4,733 |
| 91. | 47861 | 6.0% | 3.1%(+2.90)#91 | 3.1%(+2.90)#4,751 |
| 92. | 46957 | 6.0% | 3.1%(+2.90)#92 | 3.1%(+2.90)#4,757 |
| 93. | 46205 | 5.9% | 3.1%(+2.80)#93 | 3.1%(+2.80)#4,782 |
| 94. | 47040 | 5.9% | 3.1%(+2.80)#94 | 3.1%(+2.80)#4,821 |
| 95. | 47438 | 5.9% | 3.1%(+2.80)#95 | 3.1%(+2.80)#4,827 |
| 96. | 47959 | 5.9% | 3.1%(+2.80)#96 | 3.1%(+2.80)#4,843 |
| 97. | 47177 | 5.9% | 3.1%(+2.80)#97 | 3.1%(+2.80)#4,848 |
| 98. | 46516 | 5.8% | 3.1%(+2.70)#98 | 3.1%(+2.70)#4,903 |
| 99. | 46268 | 5.8% | 3.1%(+2.70)#99 | 3.1%(+2.70)#4,910 |
| 100. | 46323 | 5.8% | 3.1%(+2.70)#100 | 3.1%(+2.70)#4,912 |
Common Questions
What are the Top 10 Zip Codes with the Highest Percentage of Families with Income Below $10,000 in Indiana?
Top 10 Zip Codes with the Highest Percentage of Families with Income Below $10,000 in Indiana are:
What zip code has the Highest Percentage of Families with Income Below $10,000 in Indiana?
46998 has the Highest Percentage of Families with Income Below $10,000 in Indiana with 51.7%.
What is the Percentage of Families with Income Below $10,000 in the State of Indiana?
Percentage of Families with Income Below $10,000 in Indiana is 3.1%.
What is the Percentage of Families with Income Below $10,000 in the United States?
Percentage of Families with Income Below $10,000 in the United States is 3.1%.