Zip Codes with the Lowest Poverty Level Among Children Under the Age of 5 in Indiana
RELATED REPORTS & OPTIONS
Lowest Poverty | Child 0-5
Indiana
Compare Zip Codes
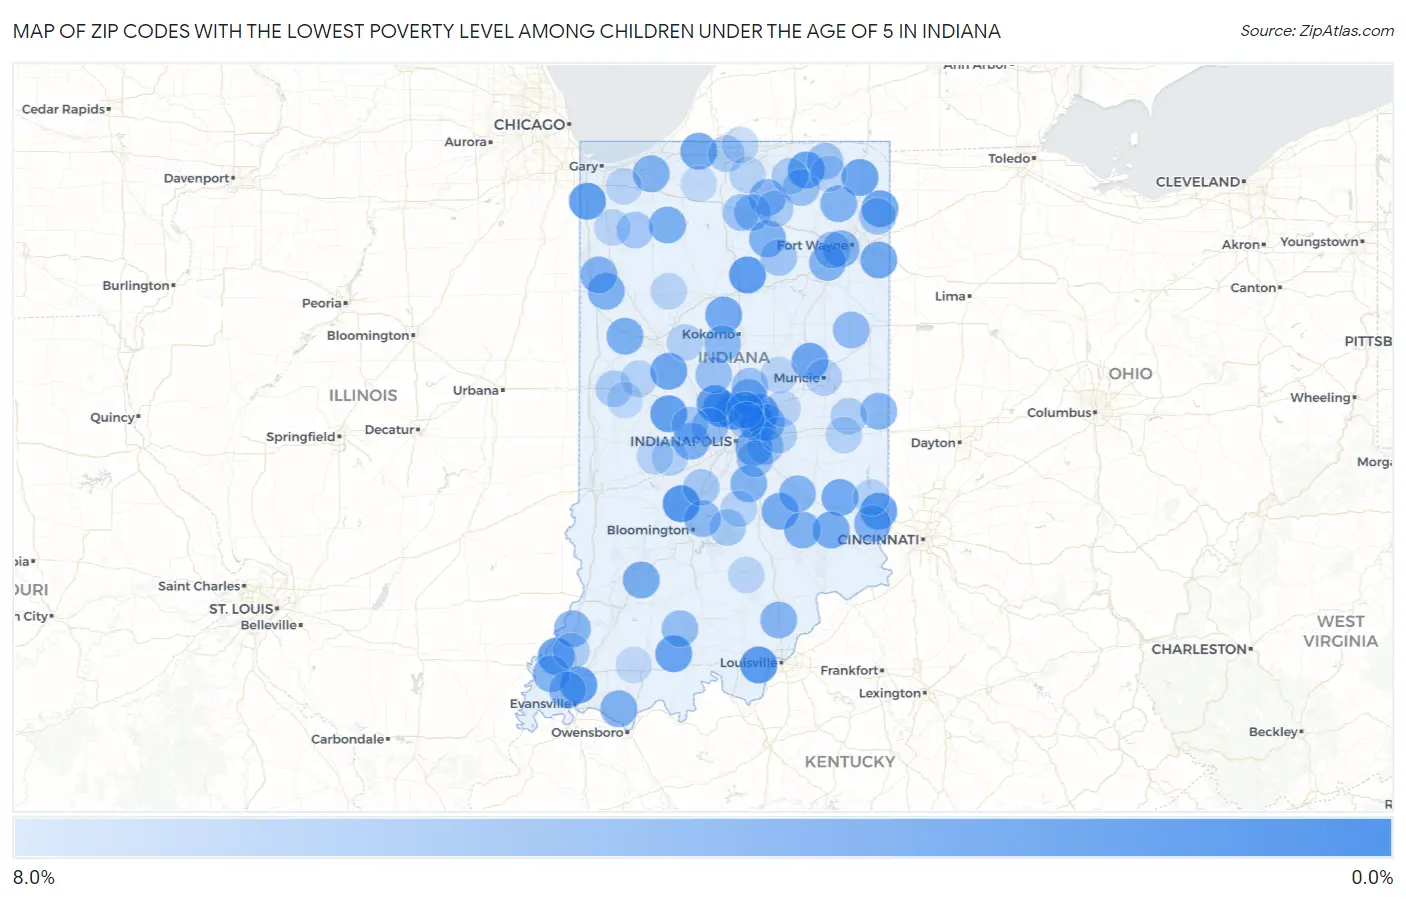
Map of Zip Codes with the Lowest Poverty Level Among Children Under the Age of 5 in Indiana
8.0%
0.0%
Zip Codes with the Lowest Poverty Level Among Children Under the Age of 5 in Indiana
| Zip Code | Child Poverty | vs State | vs National | |
| 1. | 47433 | 0.53% | 18.4%(-17.9)#1 | 18.1%(-17.5)#68 |
| 2. | 47136 | 0.81% | 18.4%(-17.6)#2 | 18.1%(-17.3)#178 |
| 3. | 46032 | 0.99% | 18.4%(-17.4)#3 | 18.1%(-17.1)#273 |
| 4. | 46926 | 1.0% | 18.4%(-17.4)#4 | 18.1%(-17.1)#275 |
| 5. | 47725 | 1.0% | 18.4%(-17.4)#5 | 18.1%(-17.0)#298 |
| 6. | 46303 | 1.1% | 18.4%(-17.3)#6 | 18.1%(-17.0)#318 |
| 7. | 46077 | 1.3% | 18.4%(-17.2)#7 | 18.1%(-16.8)#407 |
| 8. | 47968 | 1.3% | 18.4%(-17.1)#8 | 18.1%(-16.8)#416 |
| 9. | 46037 | 1.3% | 18.4%(-17.1)#9 | 18.1%(-16.8)#428 |
| 10. | 46075 | 1.4% | 18.4%(-17.1)#10 | 18.1%(-16.7)#447 |
| 11. | 47665 | 1.4% | 18.4%(-17.1)#11 | 18.1%(-16.7)#457 |
| 12. | 47060 | 1.4% | 18.4%(-17.0)#12 | 18.1%(-16.7)#475 |
| 13. | 47513 | 1.5% | 18.4%(-16.9)#13 | 18.1%(-16.6)#535 |
| 14. | 46571 | 1.6% | 18.4%(-16.8)#14 | 18.1%(-16.5)#582 |
| 15. | 47930 | 1.7% | 18.4%(-16.7)#15 | 18.1%(-16.4)#642 |
| 16. | 46785 | 1.7% | 18.4%(-16.7)#16 | 18.1%(-16.3)#654 |
| 17. | 47342 | 1.7% | 18.4%(-16.7)#17 | 18.1%(-16.3)#661 |
| 18. | 46705 | 1.8% | 18.4%(-16.6)#18 | 18.1%(-16.3)#702 |
| 19. | 46773 | 1.9% | 18.4%(-16.5)#19 | 18.1%(-16.1)#794 |
| 20. | 46552 | 2.1% | 18.4%(-16.4)#20 | 18.1%(-16.0)#875 |
| 21. | 46932 | 2.1% | 18.4%(-16.3)#21 | 18.1%(-16.0)#885 |
| 22. | 46239 | 2.1% | 18.4%(-16.3)#22 | 18.1%(-16.0)#908 |
| 23. | 47036 | 2.1% | 18.4%(-16.3)#23 | 18.1%(-15.9)#920 |
| 24. | 47246 | 2.2% | 18.4%(-16.2)#24 | 18.1%(-15.8)#975 |
| 25. | 47037 | 2.2% | 18.4%(-16.2)#25 | 18.1%(-15.8)#982 |
| 26. | 47562 | 2.3% | 18.4%(-16.1)#26 | 18.1%(-15.7)#1,048 |
| 27. | 47970 | 2.5% | 18.4%(-16.0)#27 | 18.1%(-15.6)#1,148 |
| 28. | 46038 | 2.5% | 18.4%(-15.9)#28 | 18.1%(-15.5)#1,194 |
| 29. | 46366 | 2.5% | 18.4%(-15.9)#29 | 18.1%(-15.5)#1,196 |
| 30. | 47948 | 2.6% | 18.4%(-15.8)#30 | 18.1%(-15.5)#1,229 |
| 31. | 46122 | 2.6% | 18.4%(-15.8)#31 | 18.1%(-15.4)#1,259 |
| 32. | 46510 | 2.7% | 18.4%(-15.7)#32 | 18.1%(-15.4)#1,281 |
| 33. | 47283 | 2.7% | 18.4%(-15.7)#33 | 18.1%(-15.3)#1,314 |
| 34. | 47022 | 2.7% | 18.4%(-15.7)#34 | 18.1%(-15.3)#1,318 |
| 35. | 46236 | 2.8% | 18.4%(-15.7)#35 | 18.1%(-15.3)#1,329 |
| 36. | 47922 | 2.8% | 18.4%(-15.7)#36 | 18.1%(-15.3)#1,332 |
| 37. | 46391 | 2.8% | 18.4%(-15.7)#37 | 18.1%(-15.3)#1,335 |
| 38. | 47634 | 2.8% | 18.4%(-15.7)#38 | 18.1%(-15.3)#1,340 |
| 39. | 46804 | 2.8% | 18.4%(-15.6)#39 | 18.1%(-15.3)#1,370 |
| 40. | 46062 | 2.8% | 18.4%(-15.6)#40 | 18.1%(-15.3)#1,372 |
| 41. | 46783 | 2.8% | 18.4%(-15.6)#41 | 18.1%(-15.3)#1,373 |
| 42. | 46131 | 2.8% | 18.4%(-15.6)#42 | 18.1%(-15.2)#1,399 |
| 43. | 46710 | 2.9% | 18.4%(-15.6)#43 | 18.1%(-15.2)#1,420 |
| 44. | 46055 | 2.9% | 18.4%(-15.5)#44 | 18.1%(-15.2)#1,434 |
| 45. | 47633 | 2.9% | 18.4%(-15.5)#45 | 18.1%(-15.1)#1,452 |
| 46. | 47272 | 3.0% | 18.4%(-15.4)#46 | 18.1%(-15.1)#1,507 |
| 47. | 47524 | 3.0% | 18.4%(-15.4)#47 | 18.1%(-15.0)#1,528 |
| 48. | 46542 | 3.1% | 18.4%(-15.4)#48 | 18.1%(-15.0)#1,547 |
| 49. | 47720 | 3.1% | 18.4%(-15.4)#49 | 18.1%(-15.0)#1,549 |
| 50. | 47126 | 3.1% | 18.4%(-15.3)#50 | 18.1%(-15.0)#1,578 |
| 51. | 47341 | 3.2% | 18.4%(-15.2)#51 | 18.1%(-14.9)#1,634 |
| 52. | 46979 | 3.3% | 18.4%(-15.2)#52 | 18.1%(-14.8)#1,680 |
| 53. | 47408 | 3.4% | 18.4%(-15.0)#53 | 18.1%(-14.7)#1,761 |
| 54. | 47369 | 3.5% | 18.4%(-14.9)#54 | 18.1%(-14.6)#1,823 |
| 55. | 46524 | 3.7% | 18.4%(-14.7)#55 | 18.1%(-14.4)#1,956 |
| 56. | 47432 | 3.8% | 18.4%(-14.6)#56 | 18.1%(-14.3)#2,027 |
| 57. | 46814 | 3.9% | 18.4%(-14.5)#57 | 18.1%(-14.1)#2,115 |
| 58. | 46767 | 4.0% | 18.4%(-14.5)#58 | 18.1%(-14.1)#2,145 |
| 59. | 46112 | 4.0% | 18.4%(-14.4)#59 | 18.1%(-14.1)#2,160 |
| 60. | 46788 | 4.1% | 18.4%(-14.3)#60 | 18.1%(-14.0)#2,241 |
| 61. | 46034 | 4.1% | 18.4%(-14.3)#61 | 18.1%(-14.0)#2,253 |
| 62. | 46050 | 4.1% | 18.4%(-14.3)#62 | 18.1%(-14.0)#2,261 |
| 63. | 46163 | 4.1% | 18.4%(-14.3)#63 | 18.1%(-13.9)#2,274 |
| 64. | 46761 | 4.2% | 18.4%(-14.3)#64 | 18.1%(-13.9)#2,316 |
| 65. | 46259 | 4.2% | 18.4%(-14.2)#65 | 18.1%(-13.9)#2,343 |
| 66. | 46504 | 4.3% | 18.4%(-14.1)#66 | 18.1%(-13.7)#2,423 |
| 67. | 46962 | 4.4% | 18.4%(-14.0)#67 | 18.1%(-13.6)#2,499 |
| 68. | 46033 | 4.5% | 18.4%(-13.9)#68 | 18.1%(-13.6)#2,548 |
| 69. | 46151 | 4.6% | 18.4%(-13.8)#69 | 18.1%(-13.4)#2,649 |
| 70. | 46392 | 4.6% | 18.4%(-13.8)#70 | 18.1%(-13.4)#2,656 |
| 71. | 46149 | 4.7% | 18.4%(-13.8)#71 | 18.1%(-13.4)#2,674 |
| 72. | 47448 | 4.8% | 18.4%(-13.6)#72 | 18.1%(-13.3)#2,752 |
| 73. | 46538 | 4.8% | 18.4%(-13.6)#73 | 18.1%(-13.2)#2,791 |
| 74. | 46617 | 4.9% | 18.4%(-13.5)#74 | 18.1%(-13.2)#2,833 |
| 75. | 46543 | 5.0% | 18.4%(-13.5)#75 | 18.1%(-13.1)#2,869 |
| 76. | 47987 | 5.0% | 18.4%(-13.4)#76 | 18.1%(-13.1)#2,900 |
| 77. | 46140 | 5.1% | 18.4%(-13.4)#77 | 18.1%(-13.0)#2,945 |
| 78. | 46250 | 5.1% | 18.4%(-13.3)#78 | 18.1%(-13.0)#2,966 |
| 79. | 47670 | 5.1% | 18.4%(-13.3)#79 | 18.1%(-13.0)#2,967 |
| 80. | 47346 | 5.2% | 18.4%(-13.3)#80 | 18.1%(-12.9)#3,008 |
| 81. | 47305 | 5.3% | 18.4%(-13.2)#81 | 18.1%(-12.8)#3,067 |
| 82. | 46065 | 5.3% | 18.4%(-13.1)#82 | 18.1%(-12.7)#3,115 |
| 83. | 46128 | 5.4% | 18.4%(-13.1)#83 | 18.1%(-12.7)#3,127 |
| 84. | 46164 | 5.4% | 18.4%(-13.0)#84 | 18.1%(-12.7)#3,144 |
| 85. | 47012 | 5.4% | 18.4%(-13.0)#85 | 18.1%(-12.6)#3,193 |
| 86. | 47967 | 5.6% | 18.4%(-12.9)#86 | 18.1%(-12.5)#3,291 |
| 87. | 47335 | 5.6% | 18.4%(-12.9)#87 | 18.1%(-12.5)#3,295 |
| 88. | 46135 | 5.6% | 18.4%(-12.8)#88 | 18.1%(-12.5)#3,310 |
| 89. | 46310 | 5.6% | 18.4%(-12.8)#89 | 18.1%(-12.5)#3,318 |
| 90. | 46573 | 5.6% | 18.4%(-12.8)#90 | 18.1%(-12.4)#3,329 |
| 91. | 47960 | 5.6% | 18.4%(-12.8)#91 | 18.1%(-12.4)#3,339 |
| 92. | 46044 | 5.7% | 18.4%(-12.8)#92 | 18.1%(-12.4)#3,365 |
| 93. | 46385 | 5.7% | 18.4%(-12.8)#93 | 18.1%(-12.4)#3,374 |
| 94. | 46064 | 5.7% | 18.4%(-12.7)#94 | 18.1%(-12.4)#3,395 |
| 95. | 47220 | 5.7% | 18.4%(-12.7)#95 | 18.1%(-12.3)#3,398 |
| 96. | 46795 | 5.7% | 18.4%(-12.7)#96 | 18.1%(-12.3)#3,415 |
| 97. | 46530 | 5.9% | 18.4%(-12.5)#97 | 18.1%(-12.2)#3,491 |
| 98. | 47541 | 6.0% | 18.4%(-12.4)#98 | 18.1%(-12.0)#3,604 |
| 99. | 46574 | 6.0% | 18.4%(-12.4)#99 | 18.1%(-12.0)#3,624 |
| 100. | 47949 | 6.1% | 18.4%(-12.4)#100 | 18.1%(-12.0)#3,640 |
Common Questions
What are the Top 10 Zip Codes with the Lowest Poverty Level Among Children Under the Age of 5 in Indiana?
Top 10 Zip Codes with the Lowest Poverty Level Among Children Under the Age of 5 in Indiana are:
What zip code has the Lowest Poverty Level Among Children Under the Age of 5 in Indiana?
47433 has the Lowest Poverty Level Among Children Under the Age of 5 in Indiana with 0.53%.
What is the Poverty Level Among Children Under the Age of 5 in the State of Indiana?
Poverty Level Among Children Under the Age of 5 in Indiana is 18.4%.
What is the Poverty Level Among Children Under the Age of 5 in the United States?
Poverty Level Among Children Under the Age of 5 in the United States is 18.1%.