Zip Codes with the Youngest Population in Indiana
RELATED REPORTS & OPTIONS
Youngest Population
Indiana
Compare Zip Codes
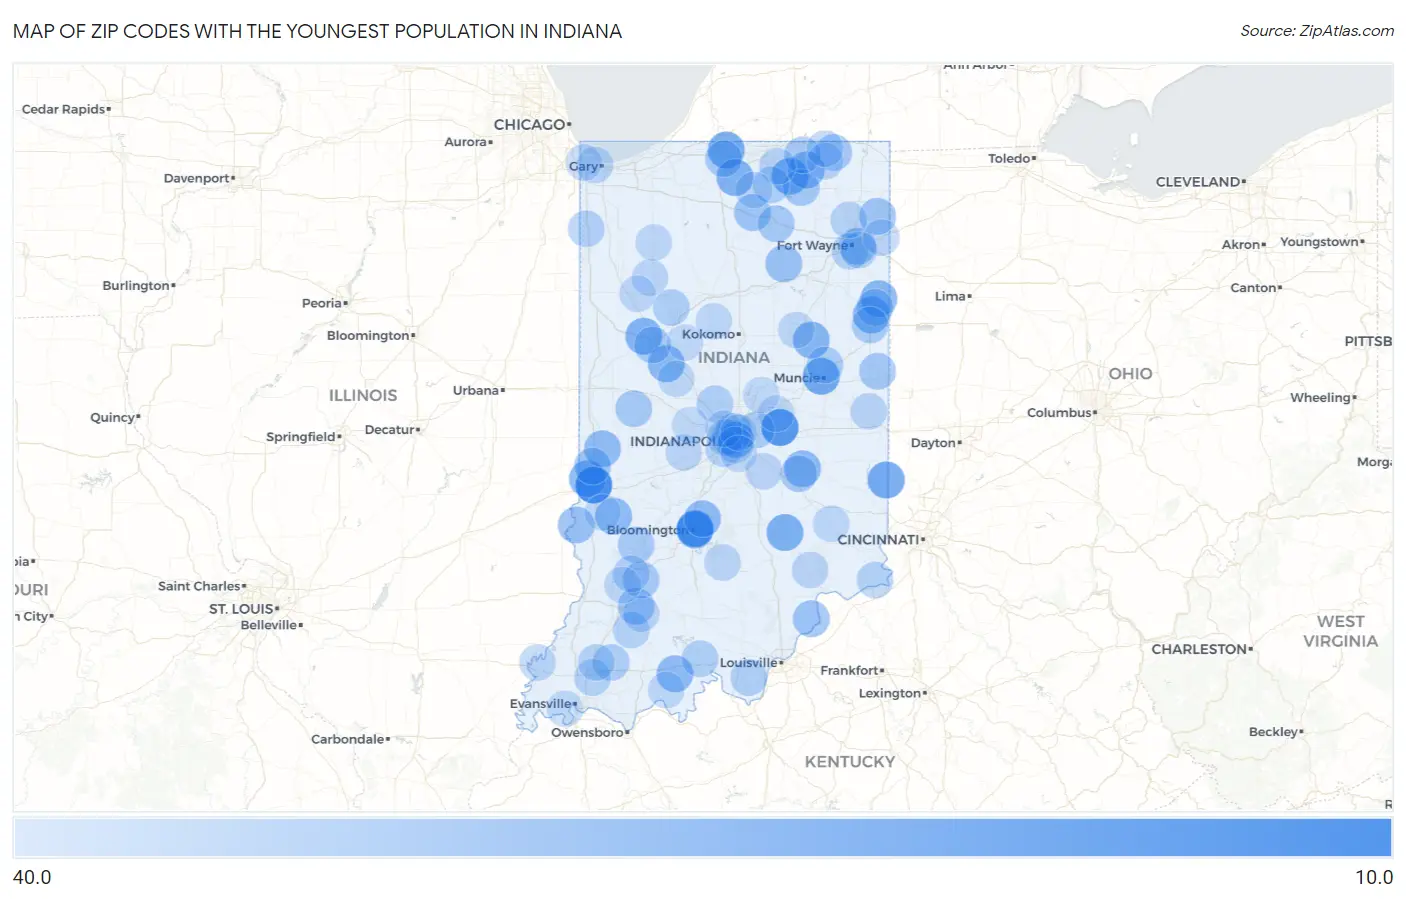
Map of Zip Codes with the Youngest Population in Indiana
40.0
10.0
Zip Codes with the Youngest Population in Indiana
| Zip Code | Median Age | vs State | vs National | |
| 1. | 46154 | 14.4 | 38.0(-23.6)#1 | 38.5(-24.1)#64 |
| 2. | 47405 | 19.2 | 38.0(-18.8)#2 | 38.5(-19.3)#196 |
| 3. | 47406 | 19.3 | 38.0(-18.7)#3 | 38.5(-19.2)#203 |
| 4. | 47306 | 19.4 | 38.0(-18.6)#4 | 38.5(-19.1)#232 |
| 5. | 47809 | 19.4 | 38.0(-18.6)#5 | 38.5(-19.1)#234 |
| 6. | 47010 | 19.9 | 38.0(-18.1)#6 | 38.5(-18.6)#358 |
| 7. | 46556 | 20.2 | 38.0(-17.8)#7 | 38.5(-18.3)#397 |
| 8. | 46543 | 21.0 | 38.0(-17.0)#8 | 38.5(-17.5)#507 |
| 9. | 47236 | 21.2 | 38.0(-16.8)#9 | 38.5(-17.3)#537 |
| 10. | 46595 | 21.9 | 38.0(-16.1)#10 | 38.5(-16.6)#649 |
| 11. | 47906 | 22.3 | 38.0(-15.7)#11 | 38.5(-16.2)#696 |
| 12. | 46740 | 22.8 | 38.0(-15.2)#12 | 38.5(-15.7)#749 |
| 13. | 47876 | 23.0 | 38.0(-15.0)#13 | 38.5(-15.5)#779 |
| 14. | 46989 | 23.2 | 38.0(-14.8)#14 | 38.5(-15.3)#797 |
| 15. | 46772 | 23.6 | 38.0(-14.4)#15 | 38.5(-14.9)#843 |
| 16. | 47983 | 23.6 | 38.0(-14.4)#16 | 38.5(-14.9)#848 |
| 17. | 47807 | 24.1 | 38.0(-13.9)#17 | 38.5(-14.4)#905 |
| 18. | 46146 | 24.1 | 38.0(-13.9)#18 | 38.5(-14.4)#908 |
| 19. | 46571 | 24.4 | 38.0(-13.6)#19 | 38.5(-14.1)#930 |
| 20. | 47515 | 24.4 | 38.0(-13.6)#20 | 38.5(-14.1)#935 |
| 21. | 47408 | 24.5 | 38.0(-13.5)#21 | 38.5(-14.0)#944 |
| 22. | 47858 | 24.8 | 38.0(-13.2)#22 | 38.5(-13.7)#977 |
| 23. | 47860 | 24.9 | 38.0(-13.1)#23 | 38.5(-13.6)#994 |
| 24. | 47849 | 26.0 | 38.0(-12.0)#24 | 38.5(-12.5)#1,111 |
| 25. | 46980 | 26.5 | 38.0(-11.5)#25 | 38.5(-12.0)#1,185 |
| 26. | 46524 | 26.9 | 38.0(-11.1)#26 | 38.5(-11.6)#1,240 |
| 27. | 47162 | 26.9 | 38.0(-11.1)#27 | 38.5(-11.6)#1,244 |
| 28. | 46803 | 27.2 | 38.0(-10.8)#28 | 38.5(-11.3)#1,284 |
| 29. | 46788 | 27.5 | 38.0(-10.5)#29 | 38.5(-11.0)#1,341 |
| 30. | 47880 | 27.5 | 38.0(-10.5)#30 | 38.5(-11.0)#1,351 |
| 31. | 47558 | 27.8 | 38.0(-10.2)#31 | 38.5(-10.7)#1,396 |
| 32. | 47382 | 28.3 | 38.0(-9.70)#32 | 38.5(-10.2)#1,508 |
| 33. | 46767 | 28.4 | 38.0(-9.60)#33 | 38.5(-10.1)#1,517 |
| 34. | 47901 | 28.4 | 38.0(-9.60)#34 | 38.5(-10.1)#1,521 |
| 35. | 46613 | 28.5 | 38.0(-9.50)#35 | 38.5(-10.00)#1,539 |
| 36. | 46771 | 28.5 | 38.0(-9.50)#36 | 38.5(-10.00)#1,554 |
| 37. | 47916 | 28.8 | 38.0(-9.20)#37 | 38.5(-9.70)#1,642 |
| 38. | 46590 | 28.9 | 38.0(-9.10)#38 | 38.5(-9.60)#1,655 |
| 39. | 47562 | 29.2 | 38.0(-8.80)#39 | 38.5(-9.30)#1,726 |
| 40. | 47465 | 29.2 | 38.0(-8.80)#40 | 38.5(-9.30)#1,738 |
| 41. | 46565 | 29.4 | 38.0(-8.60)#41 | 38.5(-9.10)#1,773 |
| 42. | 46711 | 29.4 | 38.0(-8.60)#42 | 38.5(-9.10)#1,774 |
| 43. | 46150 | 29.4 | 38.0(-8.60)#43 | 38.5(-9.10)#1,779 |
| 44. | 46202 | 29.6 | 38.0(-8.40)#44 | 38.5(-8.90)#1,831 |
| 45. | 46235 | 29.7 | 38.0(-8.30)#45 | 38.5(-8.80)#1,860 |
| 46. | 47303 | 29.7 | 38.0(-8.30)#46 | 38.5(-8.80)#1,864 |
| 47. | 47326 | 29.7 | 38.0(-8.30)#47 | 38.5(-8.80)#1,876 |
| 48. | 47584 | 30.0 | 38.0(-8.00)#48 | 38.5(-8.50)#2,007 |
| 49. | 46075 | 30.2 | 38.0(-7.80)#49 | 38.5(-8.30)#2,063 |
| 50. | 46553 | 30.3 | 38.0(-7.70)#50 | 38.5(-8.20)#2,095 |
| 51. | 47997 | 30.4 | 38.0(-7.60)#51 | 38.5(-8.10)#2,153 |
| 52. | 47123 | 30.4 | 38.0(-7.60)#52 | 38.5(-8.10)#2,154 |
| 53. | 47160 | 30.5 | 38.0(-7.50)#53 | 38.5(-8.00)#2,208 |
| 54. | 46222 | 30.8 | 38.0(-7.20)#54 | 38.5(-7.70)#2,306 |
| 55. | 47529 | 30.8 | 38.0(-7.20)#55 | 38.5(-7.70)#2,337 |
| 56. | 46376 | 30.8 | 38.0(-7.20)#56 | 38.5(-7.70)#2,353 |
| 57. | 46208 | 30.9 | 38.0(-7.10)#57 | 38.5(-7.60)#2,375 |
| 58. | 47564 | 31.0 | 38.0(-7.00)#58 | 38.5(-7.50)#2,436 |
| 59. | 46241 | 31.1 | 38.0(-6.90)#59 | 38.5(-7.40)#2,457 |
| 60. | 46807 | 31.1 | 38.0(-6.90)#60 | 38.5(-7.40)#2,466 |
| 61. | 47020 | 31.1 | 38.0(-6.90)#61 | 38.5(-7.40)#2,482 |
| 62. | 46806 | 31.2 | 38.0(-6.80)#62 | 38.5(-7.30)#2,507 |
| 63. | 46224 | 31.3 | 38.0(-6.70)#63 | 38.5(-7.20)#2,555 |
| 64. | 47613 | 31.3 | 38.0(-6.70)#64 | 38.5(-7.20)#2,575 |
| 65. | 46528 | 31.4 | 38.0(-6.60)#65 | 38.5(-7.10)#2,607 |
| 66. | 47654 | 31.5 | 38.0(-6.50)#66 | 38.5(-7.00)#2,695 |
| 67. | 46748 | 31.6 | 38.0(-6.40)#67 | 38.5(-6.90)#2,721 |
| 68. | 47393 | 31.7 | 38.0(-6.30)#68 | 38.5(-6.80)#2,784 |
| 69. | 47616 | 31.7 | 38.0(-6.30)#69 | 38.5(-6.80)#2,798 |
| 70. | 46761 | 31.8 | 38.0(-6.20)#70 | 38.5(-6.70)#2,821 |
| 71. | 46204 | 31.8 | 38.0(-6.20)#71 | 38.5(-6.70)#2,824 |
| 72. | 46406 | 31.8 | 38.0(-6.20)#72 | 38.5(-6.70)#2,825 |
| 73. | 46746 | 31.9 | 38.0(-6.10)#73 | 38.5(-6.60)#2,893 |
| 74. | 47264 | 32.1 | 38.0(-5.90)#74 | 38.5(-6.40)#3,009 |
| 75. | 47519 | 32.1 | 38.0(-5.90)#75 | 38.5(-6.40)#3,017 |
| 76. | 46254 | 32.2 | 38.0(-5.80)#76 | 38.5(-6.30)#3,039 |
| 77. | 46225 | 32.2 | 38.0(-5.80)#77 | 38.5(-6.30)#3,078 |
| 78. | 47231 | 32.2 | 38.0(-5.80)#78 | 38.5(-6.30)#3,090 |
| 79. | 46797 | 32.3 | 38.0(-5.70)#79 | 38.5(-6.20)#3,143 |
| 80. | 46103 | 32.3 | 38.0(-5.70)#80 | 38.5(-6.20)#3,171 |
| 81. | 47959 | 32.4 | 38.0(-5.60)#81 | 38.5(-6.10)#3,227 |
| 82. | 46110 | 32.4 | 38.0(-5.60)#82 | 38.5(-6.10)#3,238 |
| 83. | 46205 | 32.6 | 38.0(-5.40)#83 | 38.5(-5.90)#3,325 |
| 84. | 46550 | 32.6 | 38.0(-5.40)#84 | 38.5(-5.90)#3,337 |
| 85. | 47034 | 32.6 | 38.0(-5.40)#85 | 38.5(-5.90)#3,374 |
| 86. | 46320 | 32.7 | 38.0(-5.30)#86 | 38.5(-5.80)#3,408 |
| 87. | 46035 | 32.7 | 38.0(-5.30)#87 | 38.5(-5.80)#3,424 |
| 88. | 47588 | 32.7 | 38.0(-5.30)#88 | 38.5(-5.80)#3,430 |
| 89. | 46048 | 33.0 | 38.0(-5.00)#89 | 38.5(-5.50)#3,646 |
| 90. | 47957 | 33.1 | 38.0(-4.90)#90 | 38.5(-5.40)#3,718 |
| 91. | 47995 | 33.1 | 38.0(-4.90)#91 | 38.5(-5.40)#3,722 |
| 92. | 47568 | 33.1 | 38.0(-4.90)#92 | 38.5(-5.40)#3,726 |
| 93. | 46953 | 33.2 | 38.0(-4.80)#93 | 38.5(-5.30)#3,762 |
| 94. | 46998 | 33.2 | 38.0(-4.80)#94 | 38.5(-5.30)#3,802 |
| 95. | 46227 | 33.3 | 38.0(-4.70)#95 | 38.5(-5.20)#3,808 |
| 96. | 46060 | 33.3 | 38.0(-4.70)#96 | 38.5(-5.20)#3,812 |
| 97. | 46149 | 33.3 | 38.0(-4.70)#97 | 38.5(-5.20)#3,855 |
| 98. | 47866 | 33.3 | 38.0(-4.70)#98 | 38.5(-5.20)#3,867 |
| 99. | 47712 | 33.4 | 38.0(-4.60)#99 | 38.5(-5.10)#3,903 |
| 100. | 46065 | 33.4 | 38.0(-4.60)#100 | 38.5(-5.10)#3,921 |
Common Questions
What are the Top 10 Zip Codes with the Youngest Population in Indiana?
Top 10 Zip Codes with the Youngest Population in Indiana are:
What zip code has the Youngest Population in Indiana?
46154 has the Youngest Population in Indiana with 14.4.
What is the Median Age in the State of Indiana?
Median Age in Indiana is 38.0.
What is the Median Age in the United States?
Median Age in the United States is 38.5.