Zip Codes with the Highest Percentage of Czech Population in Indiana
RELATED REPORTS & OPTIONS
Czech
Indiana
Compare Zip Codes
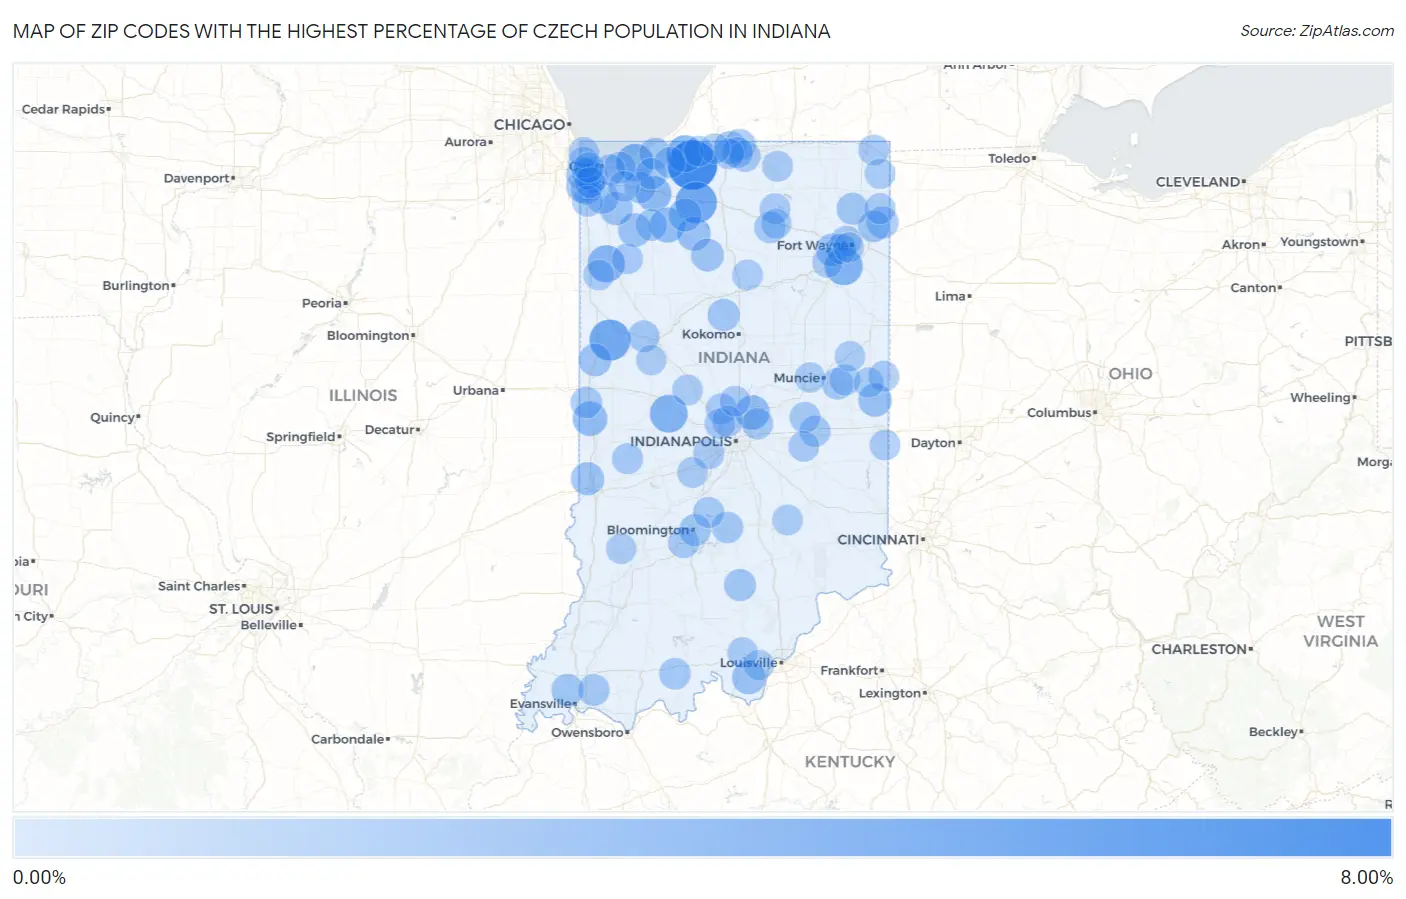
Map of Zip Codes with the Highest Percentage of Czech Population in Indiana
0.00%
8.00%
Zip Codes with the Highest Percentage of Czech Population in Indiana
| Zip Code | Czech | vs State | vs National | |
| 1. | 46365 | 6.09% | 0.21%(+5.87)#1 | 0.38%(+5.70)#497 |
| 2. | 46531 | 3.60% | 0.21%(+3.38)#2 | 0.38%(+3.21)#971 |
| 3. | 47975 | 3.47% | 0.21%(+3.26)#3 | 0.38%(+3.09)#1,011 |
| 4. | 46798 | 2.57% | 0.21%(+2.35)#4 | 0.38%(+2.19)#1,453 |
| 5. | 47968 | 2.52% | 0.21%(+2.30)#5 | 0.38%(+2.13)#1,482 |
| 6. | 46304 | 2.39% | 0.21%(+2.17)#6 | 0.38%(+2.01)#1,567 |
| 7. | 47964 | 2.35% | 0.21%(+2.14)#7 | 0.38%(+1.97)#1,597 |
| 8. | 46371 | 2.27% | 0.21%(+2.05)#8 | 0.38%(+1.89)#1,656 |
| 9. | 46390 | 1.80% | 0.21%(+1.58)#9 | 0.38%(+1.41)#2,194 |
| 10. | 46366 | 1.72% | 0.21%(+1.51)#10 | 0.38%(+1.34)#2,299 |
| 11. | 47928 | 1.57% | 0.21%(+1.36)#11 | 0.38%(+1.19)#2,555 |
| 12. | 46038 | 1.56% | 0.21%(+1.34)#12 | 0.38%(+1.17)#2,587 |
| 13. | 46960 | 1.33% | 0.21%(+1.11)#13 | 0.38%(+0.946)#3,052 |
| 14. | 47160 | 1.30% | 0.21%(+1.08)#14 | 0.38%(+0.916)#3,133 |
| 15. | 46392 | 1.28% | 0.21%(+1.07)#15 | 0.38%(+0.899)#3,182 |
| 16. | 47355 | 1.23% | 0.21%(+1.02)#16 | 0.38%(+0.850)#3,307 |
| 17. | 46814 | 1.17% | 0.21%(+0.955)#17 | 0.38%(+0.787)#3,486 |
| 18. | 47876 | 1.16% | 0.21%(+0.945)#18 | 0.38%(+0.777)#3,508 |
| 19. | 46534 | 1.15% | 0.21%(+0.939)#19 | 0.38%(+0.771)#3,526 |
| 20. | 46341 | 1.15% | 0.21%(+0.937)#20 | 0.38%(+0.769)#3,531 |
| 21. | 46939 | 1.08% | 0.21%(+0.862)#21 | 0.38%(+0.694)#3,766 |
| 22. | 46307 | 1.05% | 0.21%(+0.836)#22 | 0.38%(+0.668)#3,848 |
| 23. | 46311 | 1.02% | 0.21%(+0.804)#23 | 0.38%(+0.636)#3,976 |
| 24. | 47993 | 1.01% | 0.21%(+0.796)#24 | 0.38%(+0.628)#4,007 |
| 25. | 46321 | 0.98% | 0.21%(+0.767)#25 | 0.38%(+0.599)#4,105 |
| 26. | 46635 | 0.98% | 0.21%(+0.765)#26 | 0.38%(+0.597)#4,115 |
| 27. | 46932 | 0.90% | 0.21%(+0.683)#27 | 0.38%(+0.515)#4,497 |
| 28. | 47720 | 0.85% | 0.21%(+0.640)#28 | 0.38%(+0.472)#4,713 |
| 29. | 47281 | 0.84% | 0.21%(+0.623)#29 | 0.38%(+0.455)#4,794 |
| 30. | 46743 | 0.84% | 0.21%(+0.622)#30 | 0.38%(+0.455)#4,801 |
| 31. | 46360 | 0.81% | 0.21%(+0.592)#31 | 0.38%(+0.424)#4,961 |
| 32. | 46738 | 0.79% | 0.21%(+0.577)#32 | 0.38%(+0.409)#5,048 |
| 33. | 46741 | 0.78% | 0.21%(+0.564)#33 | 0.38%(+0.396)#5,113 |
| 34. | 47405 | 0.76% | 0.21%(+0.547)#34 | 0.38%(+0.379)#5,224 |
| 35. | 46373 | 0.75% | 0.21%(+0.535)#35 | 0.38%(+0.367)#5,292 |
| 36. | 46530 | 0.73% | 0.21%(+0.517)#36 | 0.38%(+0.349)#5,385 |
| 37. | 47448 | 0.71% | 0.21%(+0.495)#37 | 0.38%(+0.327)#5,523 |
| 38. | 46374 | 0.70% | 0.21%(+0.488)#38 | 0.38%(+0.320)#5,586 |
| 39. | 46383 | 0.70% | 0.21%(+0.486)#39 | 0.38%(+0.318)#5,593 |
| 40. | 47906 | 0.70% | 0.21%(+0.485)#40 | 0.38%(+0.317)#5,605 |
| 41. | 47383 | 0.70% | 0.21%(+0.483)#41 | 0.38%(+0.316)#5,607 |
| 42. | 47515 | 0.70% | 0.21%(+0.481)#42 | 0.38%(+0.313)#5,623 |
| 43. | 47974 | 0.69% | 0.21%(+0.478)#43 | 0.38%(+0.310)#5,641 |
| 44. | 47610 | 0.68% | 0.21%(+0.460)#44 | 0.38%(+0.292)#5,762 |
| 45. | 46391 | 0.66% | 0.21%(+0.447)#45 | 0.38%(+0.279)#5,856 |
| 46. | 46580 | 0.65% | 0.21%(+0.437)#46 | 0.38%(+0.270)#5,928 |
| 47. | 46368 | 0.64% | 0.21%(+0.428)#47 | 0.38%(+0.261)#5,989 |
| 48. | 46319 | 0.64% | 0.21%(+0.421)#48 | 0.38%(+0.253)#6,043 |
| 49. | 46236 | 0.62% | 0.21%(+0.404)#49 | 0.38%(+0.236)#6,178 |
| 50. | 47403 | 0.60% | 0.21%(+0.388)#50 | 0.38%(+0.220)#6,310 |
| 51. | 46561 | 0.59% | 0.21%(+0.379)#51 | 0.38%(+0.211)#6,400 |
| 52. | 46405 | 0.58% | 0.21%(+0.365)#52 | 0.38%(+0.198)#6,522 |
| 53. | 46350 | 0.58% | 0.21%(+0.364)#53 | 0.38%(+0.196)#6,532 |
| 54. | 46322 | 0.57% | 0.21%(+0.357)#54 | 0.38%(+0.189)#6,591 |
| 55. | 46320 | 0.56% | 0.21%(+0.342)#55 | 0.38%(+0.174)#6,726 |
| 56. | 47385 | 0.55% | 0.21%(+0.336)#56 | 0.38%(+0.168)#6,776 |
| 57. | 47468 | 0.53% | 0.21%(+0.318)#57 | 0.38%(+0.150)#6,942 |
| 58. | 46545 | 0.53% | 0.21%(+0.311)#58 | 0.38%(+0.143)#6,995 |
| 59. | 47384 | 0.53% | 0.21%(+0.311)#59 | 0.38%(+0.143)#6,996 |
| 60. | 47837 | 0.52% | 0.21%(+0.307)#60 | 0.38%(+0.139)#7,033 |
| 61. | 46785 | 0.52% | 0.21%(+0.305)#61 | 0.38%(+0.137)#7,061 |
| 62. | 46394 | 0.50% | 0.21%(+0.289)#62 | 0.38%(+0.121)#7,204 |
| 63. | 46528 | 0.50% | 0.21%(+0.287)#63 | 0.38%(+0.119)#7,226 |
| 64. | 47368 | 0.50% | 0.21%(+0.283)#64 | 0.38%(+0.115)#7,273 |
| 65. | 47390 | 0.49% | 0.21%(+0.280)#65 | 0.38%(+0.112)#7,305 |
| 66. | 46385 | 0.49% | 0.21%(+0.277)#66 | 0.38%(+0.109)#7,343 |
| 67. | 46168 | 0.49% | 0.21%(+0.276)#67 | 0.38%(+0.108)#7,349 |
| 68. | 46303 | 0.49% | 0.21%(+0.272)#68 | 0.38%(+0.104)#7,412 |
| 69. | 46737 | 0.48% | 0.21%(+0.268)#69 | 0.38%(+0.100)#7,461 |
| 70. | 46926 | 0.48% | 0.21%(+0.265)#70 | 0.38%(+0.097)#7,492 |
| 71. | 46808 | 0.48% | 0.21%(+0.264)#71 | 0.38%(+0.096)#7,500 |
| 72. | 46077 | 0.48% | 0.21%(+0.261)#72 | 0.38%(+0.093)#7,536 |
| 73. | 46375 | 0.47% | 0.21%(+0.253)#73 | 0.38%(+0.085)#7,627 |
| 74. | 46538 | 0.47% | 0.21%(+0.252)#74 | 0.38%(+0.084)#7,634 |
| 75. | 47244 | 0.46% | 0.21%(+0.246)#75 | 0.38%(+0.078)#7,709 |
| 76. | 46268 | 0.46% | 0.21%(+0.243)#76 | 0.38%(+0.075)#7,741 |
| 77. | 46071 | 0.46% | 0.21%(+0.242)#77 | 0.38%(+0.074)#7,751 |
| 78. | 46615 | 0.45% | 0.21%(+0.239)#78 | 0.38%(+0.071)#7,787 |
| 79. | 47324 | 0.44% | 0.21%(+0.226)#79 | 0.38%(+0.058)#7,937 |
| 80. | 46278 | 0.44% | 0.21%(+0.224)#80 | 0.38%(+0.057)#7,948 |
| 81. | 47978 | 0.43% | 0.21%(+0.217)#81 | 0.38%(+0.049)#8,032 |
| 82. | 46115 | 0.43% | 0.21%(+0.216)#82 | 0.38%(+0.048)#8,045 |
| 83. | 47922 | 0.43% | 0.21%(+0.216)#83 | 0.38%(+0.048)#8,046 |
| 84. | 46804 | 0.42% | 0.21%(+0.209)#84 | 0.38%(+0.041)#8,148 |
| 85. | 46157 | 0.42% | 0.21%(+0.204)#85 | 0.38%(+0.036)#8,206 |
| 86. | 46074 | 0.41% | 0.21%(+0.198)#86 | 0.38%(+0.030)#8,292 |
| 87. | 47909 | 0.40% | 0.21%(+0.188)#87 | 0.38%(+0.020)#8,412 |
| 88. | 47161 | 0.39% | 0.21%(+0.171)#88 | 0.38%(+0.003)#8,660 |
| 89. | 47394 | 0.38% | 0.21%(+0.166)#89 | 0.38%(-0.002)#8,733 |
| 90. | 46590 | 0.37% | 0.21%(+0.159)#90 | 0.38%(-0.008)#8,846 |
| 91. | 46323 | 0.37% | 0.21%(+0.156)#91 | 0.38%(-0.012)#8,895 |
| 92. | 47136 | 0.36% | 0.21%(+0.148)#92 | 0.38%(-0.020)#9,020 |
| 93. | 46628 | 0.36% | 0.21%(+0.147)#93 | 0.38%(-0.021)#9,028 |
| 94. | 47441 | 0.36% | 0.21%(+0.147)#94 | 0.38%(-0.021)#9,043 |
| 95. | 46783 | 0.36% | 0.21%(+0.145)#95 | 0.38%(-0.023)#9,084 |
| 96. | 46552 | 0.36% | 0.21%(+0.144)#96 | 0.38%(-0.024)#9,096 |
| 97. | 47373 | 0.36% | 0.21%(+0.142)#97 | 0.38%(-0.026)#9,117 |
| 98. | 47396 | 0.35% | 0.21%(+0.138)#98 | 0.38%(-0.030)#9,179 |
| 99. | 46742 | 0.35% | 0.21%(+0.135)#99 | 0.38%(-0.033)#9,221 |
| 100. | 46802 | 0.35% | 0.21%(+0.135)#100 | 0.38%(-0.033)#9,232 |
Common Questions
What are the Top 10 Zip Codes with the Highest Percentage of Czech Population in Indiana?
Top 10 Zip Codes with the Highest Percentage of Czech Population in Indiana are:
What zip code has the Highest Percentage of Czech Population in Indiana?
46365 has the Highest Percentage of Czech Population in Indiana with 6.09%.
What is the Percentage of Czech Population in the State of Indiana?
Percentage of Czech Population in Indiana is 0.21%.
What is the Percentage of Czech Population in the United States?
Percentage of Czech Population in the United States is 0.38%.