Zip Codes with the Highest Percentage of Households Heated by Bottled Gas / Liquid Propane in Indiana
RELATED REPORTS & OPTIONS
Bottled Gas / LP Heating
Indiana
Compare Zip Codes
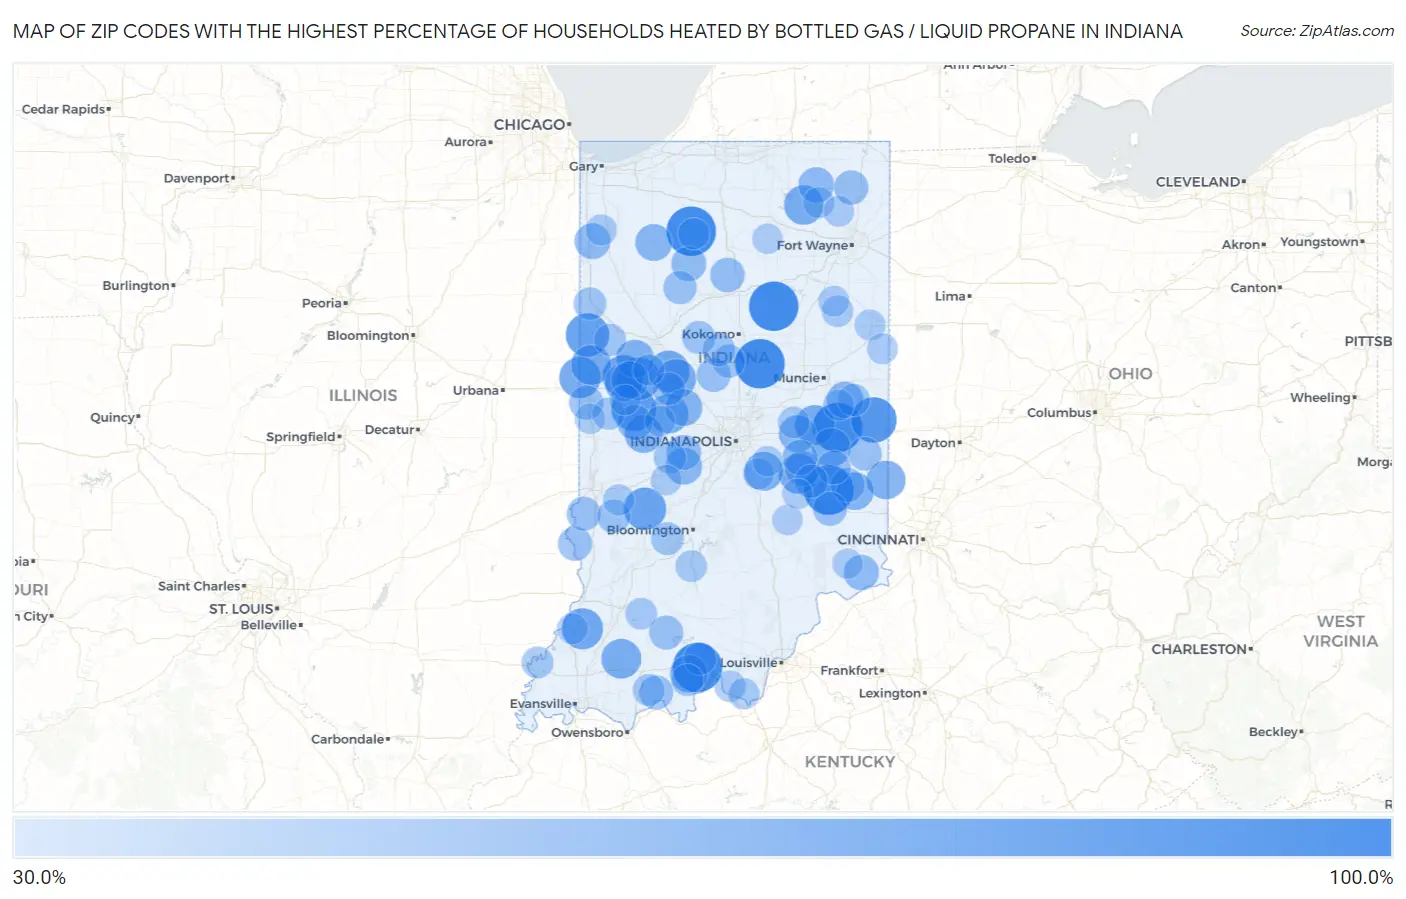
Map of Zip Codes with the Highest Percentage of Households Heated by Bottled Gas / Liquid Propane in Indiana
30.0%
100.0%
Zip Codes with the Highest Percentage of Households Heated by Bottled Gas / Liquid Propane in Indiana
| Zip Code | Bottled Gas / LP Heating | vs State | vs National | |
| 1. | 46968 | 100.0% | 7.3%(+92.7)#1 | 4.9%(+95.1)#13 |
| 2. | 46047 | 100.0% | 7.3%(+92.7)#2 | 4.9%(+95.1)#66 |
| 3. | 47174 | 100.0% | 7.3%(+92.7)#3 | 4.9%(+95.1)#67 |
| 4. | 47366 | 100.0% | 7.3%(+92.7)#4 | 4.9%(+95.1)#81 |
| 5. | 47225 | 100.0% | 7.3%(+92.7)#5 | 4.9%(+95.1)#110 |
| 6. | 46984 | 100.0% | 7.3%(+92.7)#6 | 4.9%(+95.1)#111 |
| 7. | 47392 | 87.2% | 7.3%(+79.9)#7 | 4.9%(+82.3)#225 |
| 8. | 47916 | 84.2% | 7.3%(+76.9)#8 | 4.9%(+79.3)#290 |
| 9. | 47917 | 80.0% | 7.3%(+72.7)#9 | 4.9%(+75.1)#387 |
| 10. | 47967 | 78.1% | 7.3%(+70.8)#10 | 4.9%(+73.2)#438 |
| 11. | 47969 | 76.7% | 7.3%(+69.4)#11 | 4.9%(+71.8)#481 |
| 12. | 47455 | 76.5% | 7.3%(+69.2)#12 | 4.9%(+71.6)#489 |
| 13. | 47982 | 73.4% | 7.3%(+66.1)#13 | 4.9%(+68.5)#603 |
| 14. | 47930 | 73.1% | 7.3%(+65.8)#14 | 4.9%(+68.2)#616 |
| 15. | 47640 | 72.5% | 7.3%(+65.2)#15 | 4.9%(+67.6)#642 |
| 16. | 47991 | 69.5% | 7.3%(+62.2)#16 | 4.9%(+64.6)#755 |
| 17. | 47344 | 68.6% | 7.3%(+61.3)#17 | 4.9%(+63.7)#795 |
| 18. | 46150 | 68.4% | 7.3%(+61.1)#18 | 4.9%(+63.5)#800 |
| 19. | 47585 | 68.0% | 7.3%(+60.7)#19 | 4.9%(+63.1)#827 |
| 20. | 46035 | 67.9% | 7.3%(+60.6)#20 | 4.9%(+63.0)#829 |
| 21. | 46760 | 67.5% | 7.3%(+60.2)#21 | 4.9%(+62.6)#853 |
| 22. | 47968 | 67.1% | 7.3%(+59.8)#22 | 4.9%(+62.2)#878 |
| 23. | 46110 | 65.9% | 7.3%(+58.6)#23 | 4.9%(+61.0)#965 |
| 24. | 46127 | 65.2% | 7.3%(+57.9)#24 | 4.9%(+60.3)#1,009 |
| 25. | 47010 | 64.6% | 7.3%(+57.3)#25 | 4.9%(+59.7)#1,042 |
| 26. | 46175 | 63.3% | 7.3%(+56.0)#26 | 4.9%(+58.4)#1,136 |
| 27. | 47958 | 62.7% | 7.3%(+55.4)#27 | 4.9%(+57.8)#1,177 |
| 28. | 47992 | 62.5% | 7.3%(+55.2)#28 | 4.9%(+57.6)#1,181 |
| 29. | 47030 | 61.3% | 7.3%(+54.0)#29 | 4.9%(+56.4)#1,269 |
| 30. | 47576 | 61.3% | 7.3%(+54.0)#30 | 4.9%(+56.4)#1,273 |
| 31. | 47994 | 60.9% | 7.3%(+53.6)#31 | 4.9%(+56.0)#1,303 |
| 32. | 46117 | 59.9% | 7.3%(+52.6)#32 | 4.9%(+55.0)#1,394 |
| 33. | 46102 | 59.8% | 7.3%(+52.5)#33 | 4.9%(+54.9)#1,396 |
| 34. | 47957 | 58.9% | 7.3%(+51.6)#34 | 4.9%(+54.0)#1,459 |
| 35. | 47354 | 58.7% | 7.3%(+51.4)#35 | 4.9%(+53.8)#1,487 |
| 36. | 46180 | 58.6% | 7.3%(+51.3)#36 | 4.9%(+53.7)#1,502 |
| 37. | 46349 | 55.7% | 7.3%(+48.4)#37 | 4.9%(+50.8)#1,737 |
| 38. | 46794 | 55.3% | 7.3%(+48.0)#38 | 4.9%(+50.4)#1,781 |
| 39. | 47989 | 54.0% | 7.3%(+46.7)#39 | 4.9%(+49.1)#1,898 |
| 40. | 46146 | 54.0% | 7.3%(+46.7)#40 | 4.9%(+49.1)#1,905 |
| 41. | 47011 | 53.8% | 7.3%(+46.5)#41 | 4.9%(+48.9)#1,919 |
| 42. | 46104 | 53.6% | 7.3%(+46.3)#42 | 4.9%(+48.7)#1,940 |
| 43. | 46985 | 53.0% | 7.3%(+45.7)#43 | 4.9%(+48.1)#1,999 |
| 44. | 46103 | 52.5% | 7.3%(+45.2)#44 | 4.9%(+47.6)#2,045 |
| 45. | 46988 | 51.5% | 7.3%(+44.2)#45 | 4.9%(+46.6)#2,135 |
| 46. | 46730 | 50.7% | 7.3%(+43.4)#46 | 4.9%(+45.8)#2,203 |
| 47. | 47974 | 50.3% | 7.3%(+43.0)#47 | 4.9%(+45.4)#2,250 |
| 48. | 47024 | 50.1% | 7.3%(+42.8)#48 | 4.9%(+45.2)#2,256 |
| 49. | 47527 | 50.0% | 7.3%(+42.7)#49 | 4.9%(+45.1)#2,263 |
| 50. | 47861 | 50.0% | 7.3%(+42.7)#50 | 4.9%(+45.1)#2,265 |
| 51. | 47263 | 50.0% | 7.3%(+42.7)#51 | 4.9%(+45.1)#2,278 |
| 52. | 47869 | 50.0% | 7.3%(+42.7)#52 | 4.9%(+45.1)#2,295 |
| 53. | 47531 | 49.9% | 7.3%(+42.6)#53 | 4.9%(+45.0)#2,303 |
| 54. | 46050 | 49.8% | 7.3%(+42.5)#54 | 4.9%(+44.9)#2,306 |
| 55. | 46133 | 49.8% | 7.3%(+42.5)#55 | 4.9%(+44.9)#2,309 |
| 56. | 47325 | 48.7% | 7.3%(+41.4)#56 | 4.9%(+43.8)#2,416 |
| 57. | 47950 | 47.9% | 7.3%(+40.6)#57 | 4.9%(+43.0)#2,495 |
| 58. | 46156 | 47.8% | 7.3%(+40.5)#58 | 4.9%(+42.9)#2,510 |
| 59. | 47858 | 47.6% | 7.3%(+40.3)#59 | 4.9%(+42.7)#2,542 |
| 60. | 46049 | 47.0% | 7.3%(+39.7)#60 | 4.9%(+42.1)#2,607 |
| 61. | 46920 | 46.9% | 7.3%(+39.6)#61 | 4.9%(+42.0)#2,618 |
| 62. | 46039 | 46.8% | 7.3%(+39.5)#62 | 4.9%(+41.9)#2,636 |
| 63. | 47459 | 46.3% | 7.3%(+39.0)#63 | 4.9%(+41.4)#2,680 |
| 64. | 47942 | 45.5% | 7.3%(+38.2)#64 | 4.9%(+40.6)#2,787 |
| 65. | 47123 | 45.5% | 7.3%(+38.2)#65 | 4.9%(+40.6)#2,793 |
| 66. | 47940 | 45.4% | 7.3%(+38.1)#66 | 4.9%(+40.5)#2,801 |
| 67. | 47358 | 44.9% | 7.3%(+37.6)#67 | 4.9%(+40.0)#2,860 |
| 68. | 46128 | 44.8% | 7.3%(+37.5)#68 | 4.9%(+39.9)#2,873 |
| 69. | 47975 | 44.6% | 7.3%(+37.3)#69 | 4.9%(+39.7)#2,903 |
| 70. | 47952 | 43.9% | 7.3%(+36.6)#70 | 4.9%(+39.0)#2,985 |
| 71. | 47551 | 43.8% | 7.3%(+36.5)#71 | 4.9%(+38.9)#3,009 |
| 72. | 47550 | 43.5% | 7.3%(+36.2)#72 | 4.9%(+38.6)#3,046 |
| 73. | 47616 | 42.9% | 7.3%(+35.6)#73 | 4.9%(+38.0)#3,119 |
| 74. | 47519 | 42.6% | 7.3%(+35.3)#74 | 4.9%(+37.7)#3,170 |
| 75. | 46186 | 42.0% | 7.3%(+34.7)#75 | 4.9%(+37.1)#3,260 |
| 76. | 47981 | 41.9% | 7.3%(+34.6)#76 | 4.9%(+37.0)#3,279 |
| 77. | 46781 | 41.9% | 7.3%(+34.6)#77 | 4.9%(+37.0)#3,280 |
| 78. | 47420 | 41.9% | 7.3%(+34.6)#78 | 4.9%(+37.0)#3,290 |
| 79. | 46960 | 41.6% | 7.3%(+34.3)#79 | 4.9%(+36.7)#3,323 |
| 80. | 47846 | 41.3% | 7.3%(+34.0)#80 | 4.9%(+36.4)#3,361 |
| 81. | 47110 | 40.9% | 7.3%(+33.6)#81 | 4.9%(+36.0)#3,424 |
| 82. | 46701 | 40.8% | 7.3%(+33.5)#82 | 4.9%(+35.9)#3,435 |
| 83. | 47135 | 40.8% | 7.3%(+33.5)#83 | 4.9%(+35.9)#3,445 |
| 84. | 46381 | 40.7% | 7.3%(+33.4)#84 | 4.9%(+35.8)#3,462 |
| 85. | 47360 | 40.6% | 7.3%(+33.3)#85 | 4.9%(+35.7)#3,475 |
| 86. | 46162 | 40.4% | 7.3%(+33.1)#86 | 4.9%(+35.5)#3,524 |
| 87. | 46763 | 40.0% | 7.3%(+32.7)#87 | 4.9%(+35.1)#3,569 |
| 88. | 47326 | 39.9% | 7.3%(+32.6)#88 | 4.9%(+35.0)#3,592 |
| 89. | 47524 | 39.8% | 7.3%(+32.5)#89 | 4.9%(+34.9)#3,614 |
| 90. | 47949 | 39.5% | 7.3%(+32.2)#90 | 4.9%(+34.6)#3,649 |
| 91. | 47381 | 39.4% | 7.3%(+32.1)#91 | 4.9%(+34.5)#3,676 |
| 92. | 46766 | 39.3% | 7.3%(+32.0)#92 | 4.9%(+34.4)#3,693 |
| 93. | 46120 | 39.0% | 7.3%(+31.7)#93 | 4.9%(+34.1)#3,726 |
| 94. | 47954 | 38.9% | 7.3%(+31.6)#94 | 4.9%(+34.0)#3,737 |
| 95. | 47928 | 38.8% | 7.3%(+31.5)#95 | 4.9%(+33.9)#3,749 |
| 96. | 47244 | 38.8% | 7.3%(+31.5)#96 | 4.9%(+33.9)#3,755 |
| 97. | 46510 | 38.7% | 7.3%(+31.4)#97 | 4.9%(+33.8)#3,765 |
| 98. | 46126 | 38.6% | 7.3%(+31.3)#98 | 4.9%(+33.7)#3,777 |
| 99. | 47017 | 38.4% | 7.3%(+31.1)#99 | 4.9%(+33.5)#3,813 |
| 100. | 47272 | 38.3% | 7.3%(+31.0)#100 | 4.9%(+33.4)#3,822 |
Common Questions
What are the Top 10 Zip Codes with the Highest Percentage of Households Heated by Bottled Gas / Liquid Propane in Indiana?
Top 10 Zip Codes with the Highest Percentage of Households Heated by Bottled Gas / Liquid Propane in Indiana are:
What zip code has the Highest Percentage of Households Heated by Bottled Gas / Liquid Propane in Indiana?
46968 has the Highest Percentage of Households Heated by Bottled Gas / Liquid Propane in Indiana with 100.0%.
What is the Percentage of Households Heated by Bottled Gas / Liquid Propane in the State of Indiana?
Percentage of Households Heated by Bottled Gas / Liquid Propane in Indiana is 7.3%.
What is the Percentage of Households Heated by Bottled Gas / Liquid Propane in the United States?
Percentage of Households Heated by Bottled Gas / Liquid Propane in the United States is 4.9%.