Zip Codes with the Highest Percentage of Population Employed in Installation, Maintenance & Repair in Indiana
RELATED REPORTS & OPTIONS
Installation, Maintenance & Repair
Indiana
Compare Zip Codes
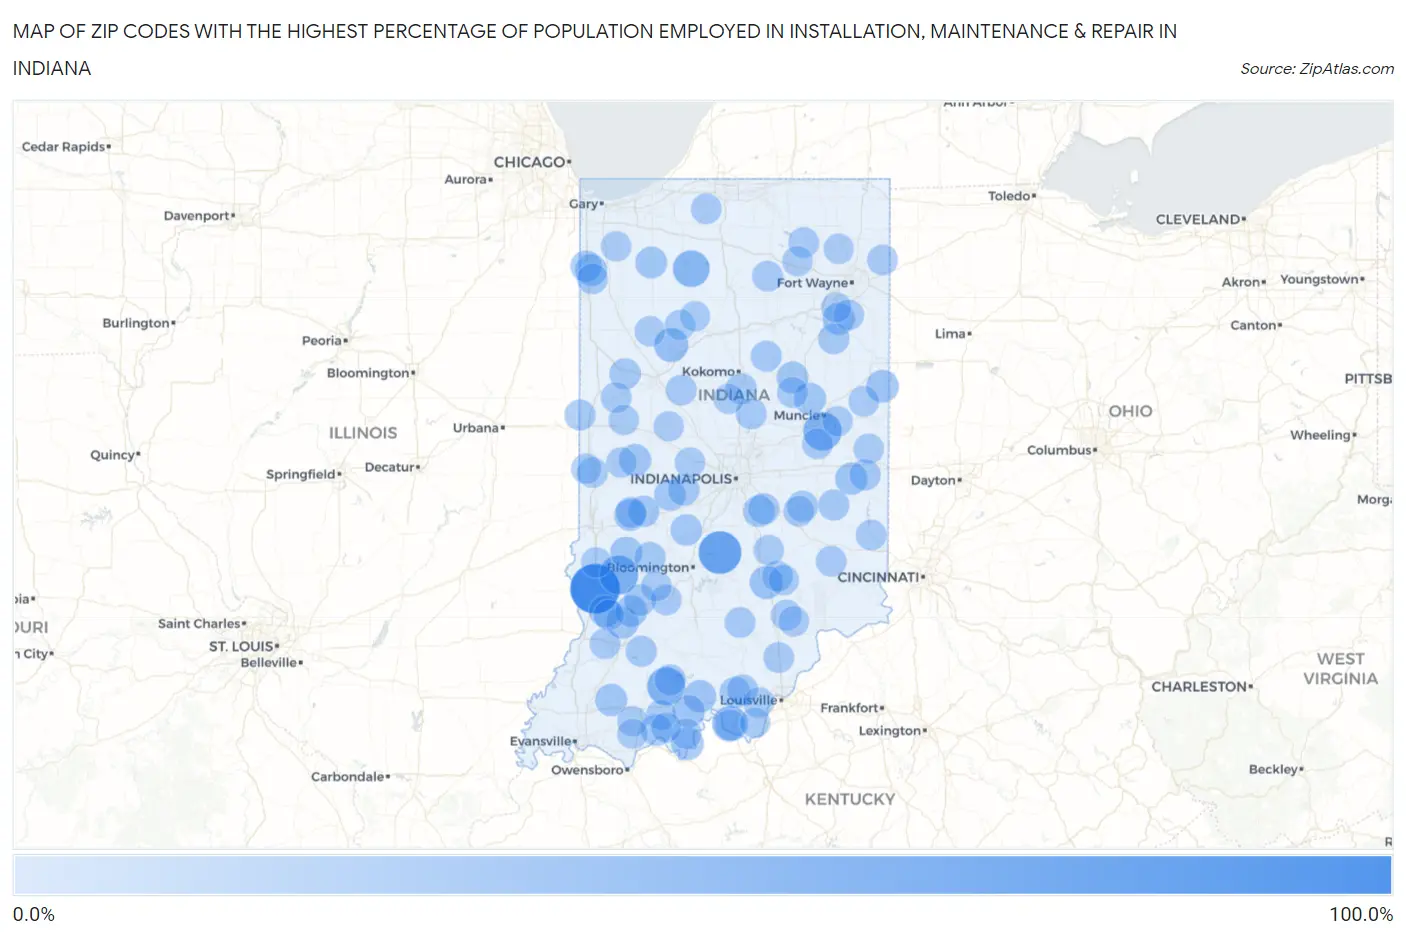
Map of Zip Codes with the Highest Percentage of Population Employed in Installation, Maintenance & Repair in Indiana
0.0%
100.0%
Zip Codes with the Highest Percentage of Population Employed in Installation, Maintenance & Repair in Indiana
| Zip Code | % Employed | vs State | vs National | |
| 1. | 47865 | 100.0% | 3.5%(+96.5)#1 | 3.1%(+96.9)#14 |
| 2. | 47435 | 66.7% | 3.5%(+63.1)#2 | 3.1%(+63.6)#23 |
| 3. | 47445 | 47.9% | 3.5%(+44.4)#3 | 3.1%(+44.9)#56 |
| 4. | 47367 | 45.0% | 3.5%(+41.5)#4 | 3.1%(+41.9)#69 |
| 5. | 47580 | 43.9% | 3.5%(+40.4)#5 | 3.1%(+40.9)#74 |
| 6. | 46968 | 37.5% | 3.5%(+34.0)#6 | 3.1%(+34.4)#110 |
| 7. | 47110 | 32.4% | 3.5%(+28.8)#7 | 3.1%(+29.3)#146 |
| 8. | 47997 | 25.0% | 3.5%(+21.5)#8 | 3.1%(+21.9)#244 |
| 9. | 47247 | 20.4% | 3.5%(+16.9)#9 | 3.1%(+17.3)#368 |
| 10. | 47381 | 18.1% | 3.5%(+14.5)#10 | 3.1%(+15.0)#510 |
| 11. | 47574 | 17.6% | 3.5%(+14.0)#11 | 3.1%(+14.5)#550 |
| 12. | 47568 | 17.5% | 3.5%(+13.9)#12 | 3.1%(+14.4)#558 |
| 13. | 47123 | 17.3% | 3.5%(+13.8)#13 | 3.1%(+14.2)#568 |
| 14. | 47576 | 17.0% | 3.5%(+13.5)#14 | 3.1%(+13.9)#585 |
| 15. | 46791 | 16.7% | 3.5%(+13.1)#15 | 3.1%(+13.6)#607 |
| 16. | 47357 | 16.4% | 3.5%(+12.8)#16 | 3.1%(+13.3)#646 |
| 17. | 47989 | 16.4% | 3.5%(+12.8)#17 | 3.1%(+13.3)#647 |
| 18. | 47584 | 16.2% | 3.5%(+12.7)#18 | 3.1%(+13.1)#657 |
| 19. | 47841 | 15.6% | 3.5%(+12.1)#19 | 3.1%(+12.6)#720 |
| 20. | 47342 | 15.6% | 3.5%(+12.1)#20 | 3.1%(+12.5)#725 |
| 21. | 47535 | 14.9% | 3.5%(+11.3)#21 | 3.1%(+11.8)#797 |
| 22. | 46938 | 14.6% | 3.5%(+11.1)#22 | 3.1%(+11.5)#829 |
| 23. | 46374 | 14.5% | 3.5%(+10.9)#23 | 3.1%(+11.4)#851 |
| 24. | 46379 | 14.3% | 3.5%(+10.7)#24 | 3.1%(+11.2)#883 |
| 25. | 47529 | 14.3% | 3.5%(+10.7)#25 | 3.1%(+11.2)#891 |
| 26. | 47531 | 14.3% | 3.5%(+10.7)#26 | 3.1%(+11.2)#892 |
| 27. | 47857 | 14.2% | 3.5%(+10.6)#27 | 3.1%(+11.1)#904 |
| 28. | 47449 | 13.7% | 3.5%(+10.1)#28 | 3.1%(+10.6)#982 |
| 29. | 46162 | 13.3% | 3.5%(+9.75)#29 | 3.1%(+10.2)#1,040 |
| 30. | 46376 | 13.0% | 3.5%(+9.42)#30 | 3.1%(+9.90)#1,106 |
| 31. | 46166 | 12.9% | 3.5%(+9.35)#31 | 3.1%(+9.83)#1,122 |
| 32. | 46128 | 12.8% | 3.5%(+9.28)#32 | 3.1%(+9.75)#1,132 |
| 33. | 46103 | 12.6% | 3.5%(+9.10)#33 | 3.1%(+9.57)#1,172 |
| 34. | 46171 | 12.3% | 3.5%(+8.72)#34 | 3.1%(+9.20)#1,249 |
| 35. | 46110 | 11.9% | 3.5%(+8.35)#35 | 3.1%(+8.82)#1,352 |
| 36. | 47521 | 11.7% | 3.5%(+8.13)#36 | 3.1%(+8.61)#1,408 |
| 37. | 47431 | 11.7% | 3.5%(+8.11)#37 | 3.1%(+8.59)#1,421 |
| 38. | 47519 | 11.4% | 3.5%(+7.83)#38 | 3.1%(+8.30)#1,494 |
| 39. | 47330 | 11.4% | 3.5%(+7.82)#39 | 3.1%(+8.30)#1,496 |
| 40. | 47166 | 11.1% | 3.5%(+7.55)#40 | 3.1%(+8.03)#1,597 |
| 41. | 46068 | 10.9% | 3.5%(+7.34)#41 | 3.1%(+7.82)#1,661 |
| 42. | 46133 | 10.8% | 3.5%(+7.23)#42 | 3.1%(+7.71)#1,694 |
| 43. | 46031 | 10.7% | 3.5%(+7.20)#43 | 3.1%(+7.68)#1,703 |
| 44. | 46146 | 10.7% | 3.5%(+7.20)#44 | 3.1%(+7.67)#1,706 |
| 45. | 46919 | 10.7% | 3.5%(+7.19)#45 | 3.1%(+7.66)#1,708 |
| 46. | 46766 | 10.7% | 3.5%(+7.16)#46 | 3.1%(+7.63)#1,720 |
| 47. | 47970 | 10.5% | 3.5%(+6.97)#47 | 3.1%(+7.45)#1,799 |
| 48. | 47161 | 10.5% | 3.5%(+6.95)#48 | 3.1%(+7.43)#1,810 |
| 49. | 46349 | 10.4% | 3.5%(+6.85)#49 | 3.1%(+7.33)#1,846 |
| 50. | 47982 | 10.4% | 3.5%(+6.85)#50 | 3.1%(+7.32)#1,849 |
| 51. | 47853 | 10.3% | 3.5%(+6.75)#51 | 3.1%(+7.23)#1,890 |
| 52. | 46070 | 10.1% | 3.5%(+6.57)#52 | 3.1%(+7.04)#1,969 |
| 53. | 46510 | 10.1% | 3.5%(+6.51)#53 | 3.1%(+6.98)#1,992 |
| 54. | 47142 | 10.0% | 3.5%(+6.48)#54 | 3.1%(+6.96)#2,004 |
| 55. | 47388 | 9.9% | 3.5%(+6.34)#55 | 3.1%(+6.82)#2,079 |
| 56. | 46150 | 9.6% | 3.5%(+6.02)#56 | 3.1%(+6.49)#2,228 |
| 57. | 46058 | 9.5% | 3.5%(+6.00)#57 | 3.1%(+6.47)#2,234 |
| 58. | 47270 | 9.5% | 3.5%(+5.96)#58 | 3.1%(+6.43)#2,265 |
| 59. | 47281 | 9.5% | 3.5%(+5.92)#59 | 3.1%(+6.40)#2,288 |
| 60. | 46760 | 9.5% | 3.5%(+5.92)#60 | 3.1%(+6.40)#2,289 |
| 61. | 46554 | 9.5% | 3.5%(+5.92)#61 | 3.1%(+6.39)#2,291 |
| 62. | 47034 | 9.5% | 3.5%(+5.92)#62 | 3.1%(+6.39)#2,292 |
| 63. | 47232 | 9.4% | 3.5%(+5.86)#63 | 3.1%(+6.33)#2,321 |
| 64. | 47918 | 9.3% | 3.5%(+5.80)#64 | 3.1%(+6.28)#2,345 |
| 65. | 47012 | 9.3% | 3.5%(+5.73)#65 | 3.1%(+6.20)#2,385 |
| 66. | 47597 | 9.2% | 3.5%(+5.68)#66 | 3.1%(+6.16)#2,419 |
| 67. | 47126 | 9.2% | 3.5%(+5.66)#67 | 3.1%(+6.13)#2,436 |
| 68. | 47854 | 9.1% | 3.5%(+5.55)#68 | 3.1%(+6.02)#2,495 |
| 69. | 46743 | 9.1% | 3.5%(+5.53)#69 | 3.1%(+6.01)#2,516 |
| 70. | 47380 | 8.9% | 3.5%(+5.34)#70 | 3.1%(+5.81)#2,641 |
| 71. | 47879 | 8.8% | 3.5%(+5.22)#71 | 3.1%(+5.69)#2,720 |
| 72. | 47528 | 8.7% | 3.5%(+5.20)#72 | 3.1%(+5.68)#2,729 |
| 73. | 47453 | 8.7% | 3.5%(+5.19)#73 | 3.1%(+5.66)#2,739 |
| 74. | 46777 | 8.7% | 3.5%(+5.18)#74 | 3.1%(+5.65)#2,746 |
| 75. | 47424 | 8.6% | 3.5%(+5.03)#75 | 3.1%(+5.50)#2,837 |
| 76. | 47980 | 8.5% | 3.5%(+4.91)#76 | 3.1%(+5.39)#2,916 |
| 77. | 47393 | 8.4% | 3.5%(+4.90)#77 | 3.1%(+5.37)#2,929 |
| 78. | 47230 | 8.4% | 3.5%(+4.88)#78 | 3.1%(+5.36)#2,943 |
| 79. | 47577 | 8.4% | 3.5%(+4.88)#79 | 3.1%(+5.36)#2,944 |
| 80. | 47136 | 8.4% | 3.5%(+4.83)#80 | 3.1%(+5.31)#2,969 |
| 81. | 47226 | 8.3% | 3.5%(+4.79)#81 | 3.1%(+5.27)#3,014 |
| 82. | 47859 | 8.3% | 3.5%(+4.76)#82 | 3.1%(+5.23)#3,032 |
| 83. | 47958 | 8.2% | 3.5%(+4.65)#83 | 3.1%(+5.13)#3,122 |
| 84. | 47520 | 8.1% | 3.5%(+4.58)#84 | 3.1%(+5.05)#3,192 |
| 85. | 46764 | 8.1% | 3.5%(+4.54)#85 | 3.1%(+5.01)#3,237 |
| 86. | 47537 | 8.1% | 3.5%(+4.51)#86 | 3.1%(+4.99)#3,260 |
| 87. | 46049 | 8.1% | 3.5%(+4.51)#87 | 3.1%(+4.98)#3,264 |
| 88. | 46341 | 8.0% | 3.5%(+4.45)#88 | 3.1%(+4.92)#3,324 |
| 89. | 47950 | 7.9% | 3.5%(+4.39)#89 | 3.1%(+4.86)#3,384 |
| 90. | 47273 | 7.9% | 3.5%(+4.33)#90 | 3.1%(+4.80)#3,440 |
| 91. | 47117 | 7.8% | 3.5%(+4.28)#91 | 3.1%(+4.76)#3,482 |
| 92. | 47940 | 7.8% | 3.5%(+4.26)#92 | 3.1%(+4.73)#3,517 |
| 93. | 46799 | 7.7% | 3.5%(+4.19)#93 | 3.1%(+4.66)#3,591 |
| 94. | 47383 | 7.7% | 3.5%(+4.15)#94 | 3.1%(+4.62)#3,624 |
| 95. | 47611 | 7.7% | 3.5%(+4.13)#95 | 3.1%(+4.61)#3,654 |
| 96. | 46763 | 7.7% | 3.5%(+4.11)#96 | 3.1%(+4.59)#3,671 |
| 97. | 47588 | 7.6% | 3.5%(+4.09)#97 | 3.1%(+4.57)#3,693 |
| 98. | 47847 | 7.6% | 3.5%(+4.07)#98 | 3.1%(+4.54)#3,718 |
| 99. | 46149 | 7.6% | 3.5%(+4.04)#99 | 3.1%(+4.52)#3,740 |
| 100. | 46978 | 7.6% | 3.5%(+4.04)#100 | 3.1%(+4.51)#3,748 |
Common Questions
What are the Top 10 Zip Codes with the Highest Percentage of Population Employed in Installation, Maintenance & Repair in Indiana?
Top 10 Zip Codes with the Highest Percentage of Population Employed in Installation, Maintenance & Repair in Indiana are:
What zip code has the Highest Percentage of Population Employed in Installation, Maintenance & Repair in Indiana?
47865 has the Highest Percentage of Population Employed in Installation, Maintenance & Repair in Indiana with 100.0%.
What is the Percentage of Population Employed in Installation, Maintenance & Repair in the State of Indiana?
Percentage of Population Employed in Installation, Maintenance & Repair in Indiana is 3.5%.
What is the Percentage of Population Employed in Installation, Maintenance & Repair in the United States?
Percentage of Population Employed in Installation, Maintenance & Repair in the United States is 3.1%.