Zip Codes with the Highest Percentage of Population Employed in Arts, Entertainment & Recreation in Indiana
RELATED REPORTS & OPTIONS
Arts, Entertainment & Recreation
Indiana
Compare Zip Codes
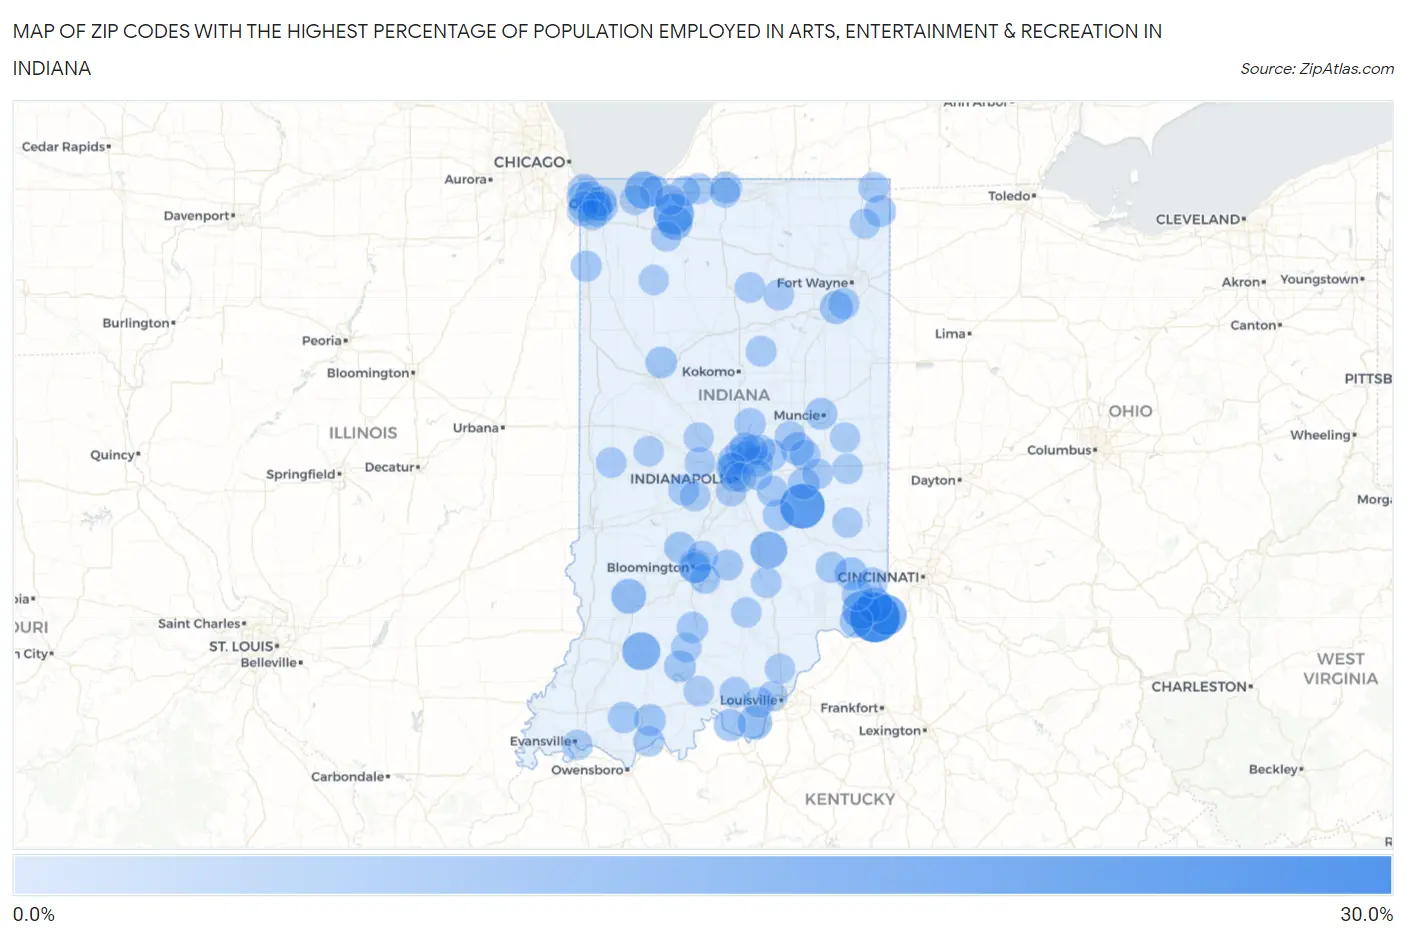
Map of Zip Codes with the Highest Percentage of Population Employed in Arts, Entertainment & Recreation in Indiana
0.0%
30.0%
Zip Codes with the Highest Percentage of Population Employed in Arts, Entertainment & Recreation in Indiana
| Zip Code | % Employed | vs State | vs National | |
| 1. | 47020 | 29.8% | 1.6%(+28.1)#1 | 2.1%(+27.7)#77 |
| 2. | 46146 | 22.8% | 1.6%(+21.2)#2 | 2.1%(+20.7)#135 |
| 3. | 47038 | 17.1% | 1.6%(+15.5)#3 | 2.1%(+15.0)#253 |
| 4. | 46345 | 16.7% | 1.6%(+15.0)#4 | 2.1%(+14.6)#266 |
| 5. | 47519 | 13.4% | 1.6%(+11.7)#5 | 2.1%(+11.3)#425 |
| 6. | 47011 | 13.2% | 1.6%(+11.6)#6 | 2.1%(+11.2)#436 |
| 7. | 46301 | 12.5% | 1.6%(+10.9)#7 | 2.1%(+10.4)#480 |
| 8. | 47226 | 11.8% | 1.6%(+10.2)#8 | 2.1%(+9.72)#526 |
| 9. | 46346 | 9.2% | 1.6%(+7.54)#9 | 2.1%(+7.10)#824 |
| 10. | 47040 | 8.8% | 1.6%(+7.19)#10 | 2.1%(+6.75)#882 |
| 11. | 47443 | 8.8% | 1.6%(+7.17)#11 | 2.1%(+6.73)#886 |
| 12. | 47117 | 8.1% | 1.6%(+6.43)#12 | 2.1%(+5.99)#1,040 |
| 13. | 47406 | 7.0% | 1.6%(+5.40)#13 | 2.1%(+4.96)#1,317 |
| 14. | 47043 | 6.5% | 1.6%(+4.82)#14 | 2.1%(+4.38)#1,516 |
| 15. | 46056 | 6.4% | 1.6%(+4.74)#15 | 2.1%(+4.29)#1,548 |
| 16. | 46799 | 6.3% | 1.6%(+4.64)#16 | 2.1%(+4.20)#1,596 |
| 17. | 47031 | 6.2% | 1.6%(+4.56)#17 | 2.1%(+4.12)#1,626 |
| 18. | 47142 | 5.4% | 1.6%(+3.76)#18 | 2.1%(+3.32)#2,019 |
| 19. | 46394 | 4.9% | 1.6%(+3.25)#19 | 2.1%(+2.81)#2,365 |
| 20. | 47579 | 4.8% | 1.6%(+3.17)#20 | 2.1%(+2.73)#2,424 |
| 21. | 46742 | 4.8% | 1.6%(+3.15)#21 | 2.1%(+2.70)#2,453 |
| 22. | 47306 | 4.8% | 1.6%(+3.13)#22 | 2.1%(+2.69)#2,464 |
| 23. | 47432 | 4.7% | 1.6%(+3.06)#23 | 2.1%(+2.62)#2,535 |
| 24. | 46115 | 4.7% | 1.6%(+3.03)#24 | 2.1%(+2.59)#2,558 |
| 25. | 47920 | 4.7% | 1.6%(+3.01)#25 | 2.1%(+2.57)#2,576 |
| 26. | 47464 | 4.6% | 1.6%(+2.93)#26 | 2.1%(+2.49)#2,662 |
| 27. | 46176 | 4.5% | 1.6%(+2.89)#27 | 2.1%(+2.44)#2,713 |
| 28. | 47637 | 4.4% | 1.6%(+2.80)#28 | 2.1%(+2.36)#2,810 |
| 29. | 46250 | 4.3% | 1.6%(+2.68)#29 | 2.1%(+2.24)#2,937 |
| 30. | 46034 | 4.3% | 1.6%(+2.67)#30 | 2.1%(+2.23)#2,948 |
| 31. | 46556 | 4.3% | 1.6%(+2.63)#31 | 2.1%(+2.19)#2,995 |
| 32. | 47018 | 4.2% | 1.6%(+2.55)#32 | 2.1%(+2.11)#3,092 |
| 33. | 46040 | 4.2% | 1.6%(+2.53)#33 | 2.1%(+2.09)#3,117 |
| 34. | 46327 | 4.1% | 1.6%(+2.50)#34 | 2.1%(+2.06)#3,159 |
| 35. | 47446 | 4.1% | 1.6%(+2.49)#35 | 2.1%(+2.04)#3,174 |
| 36. | 46798 | 4.0% | 1.6%(+2.39)#36 | 2.1%(+1.94)#3,301 |
| 37. | 46406 | 4.0% | 1.6%(+2.35)#37 | 2.1%(+1.91)#3,356 |
| 38. | 46280 | 3.9% | 1.6%(+2.27)#38 | 2.1%(+1.83)#3,462 |
| 39. | 46103 | 3.8% | 1.6%(+2.21)#39 | 2.1%(+1.76)#3,559 |
| 40. | 46236 | 3.8% | 1.6%(+2.20)#40 | 2.1%(+1.75)#3,574 |
| 41. | 46408 | 3.8% | 1.6%(+2.17)#41 | 2.1%(+1.73)#3,615 |
| 42. | 47615 | 3.7% | 1.6%(+2.09)#42 | 2.1%(+1.65)#3,728 |
| 43. | 46376 | 3.7% | 1.6%(+2.06)#43 | 2.1%(+1.62)#3,773 |
| 44. | 47384 | 3.7% | 1.6%(+2.06)#44 | 2.1%(+1.61)#3,781 |
| 45. | 46208 | 3.7% | 1.6%(+2.05)#45 | 2.1%(+1.61)#3,792 |
| 46. | 46130 | 3.6% | 1.6%(+2.00)#46 | 2.1%(+1.56)#3,863 |
| 47. | 47037 | 3.6% | 1.6%(+1.98)#47 | 2.1%(+1.54)#3,915 |
| 48. | 47408 | 3.6% | 1.6%(+1.93)#48 | 2.1%(+1.49)#4,007 |
| 49. | 47448 | 3.6% | 1.6%(+1.93)#49 | 2.1%(+1.48)#4,011 |
| 50. | 46360 | 3.6% | 1.6%(+1.91)#50 | 2.1%(+1.47)#4,027 |
| 51. | 46260 | 3.6% | 1.6%(+1.91)#51 | 2.1%(+1.47)#4,028 |
| 52. | 47166 | 3.5% | 1.6%(+1.90)#52 | 2.1%(+1.46)#4,043 |
| 53. | 47405 | 3.5% | 1.6%(+1.89)#53 | 2.1%(+1.44)#4,070 |
| 54. | 46202 | 3.5% | 1.6%(+1.82)#54 | 2.1%(+1.37)#4,229 |
| 55. | 46962 | 3.5% | 1.6%(+1.81)#55 | 2.1%(+1.37)#4,231 |
| 56. | 46911 | 3.4% | 1.6%(+1.78)#56 | 2.1%(+1.33)#4,323 |
| 57. | 47337 | 3.4% | 1.6%(+1.77)#57 | 2.1%(+1.33)#4,336 |
| 58. | 47136 | 3.4% | 1.6%(+1.75)#58 | 2.1%(+1.31)#4,370 |
| 59. | 46037 | 3.3% | 1.6%(+1.71)#59 | 2.1%(+1.27)#4,468 |
| 60. | 46407 | 3.3% | 1.6%(+1.71)#60 | 2.1%(+1.27)#4,469 |
| 61. | 46038 | 3.3% | 1.6%(+1.68)#61 | 2.1%(+1.24)#4,528 |
| 62. | 46312 | 3.3% | 1.6%(+1.67)#62 | 2.1%(+1.23)#4,548 |
| 63. | 46167 | 3.3% | 1.6%(+1.66)#63 | 2.1%(+1.22)#4,570 |
| 64. | 46552 | 3.3% | 1.6%(+1.64)#64 | 2.1%(+1.19)#4,623 |
| 65. | 46340 | 3.3% | 1.6%(+1.64)#65 | 2.1%(+1.19)#4,625 |
| 66. | 46033 | 3.2% | 1.6%(+1.58)#66 | 2.1%(+1.14)#4,751 |
| 67. | 46737 | 3.2% | 1.6%(+1.56)#67 | 2.1%(+1.11)#4,819 |
| 68. | 46371 | 3.2% | 1.6%(+1.53)#68 | 2.1%(+1.09)#4,884 |
| 69. | 47832 | 3.2% | 1.6%(+1.52)#69 | 2.1%(+1.08)#4,909 |
| 70. | 46228 | 3.1% | 1.6%(+1.50)#70 | 2.1%(+1.06)#4,960 |
| 71. | 46321 | 3.1% | 1.6%(+1.44)#71 | 2.1%(+0.995)#5,135 |
| 72. | 46402 | 3.1% | 1.6%(+1.43)#72 | 2.1%(+0.991)#5,151 |
| 73. | 47247 | 3.1% | 1.6%(+1.42)#73 | 2.1%(+0.979)#5,188 |
| 74. | 46217 | 3.1% | 1.6%(+1.41)#74 | 2.1%(+0.972)#5,203 |
| 75. | 46013 | 3.0% | 1.6%(+1.38)#75 | 2.1%(+0.936)#5,309 |
| 76. | 47327 | 3.0% | 1.6%(+1.36)#76 | 2.1%(+0.918)#5,354 |
| 77. | 47220 | 3.0% | 1.6%(+1.35)#77 | 2.1%(+0.904)#5,390 |
| 78. | 46324 | 3.0% | 1.6%(+1.33)#78 | 2.1%(+0.887)#5,449 |
| 79. | 46350 | 2.9% | 1.6%(+1.31)#79 | 2.1%(+0.866)#5,510 |
| 80. | 46910 | 2.9% | 1.6%(+1.30)#80 | 2.1%(+0.859)#5,529 |
| 81. | 47118 | 2.9% | 1.6%(+1.26)#81 | 2.1%(+0.822)#5,635 |
| 82. | 47713 | 2.9% | 1.6%(+1.24)#82 | 2.1%(+0.799)#5,705 |
| 83. | 46404 | 2.9% | 1.6%(+1.24)#83 | 2.1%(+0.798)#5,711 |
| 84. | 46304 | 2.9% | 1.6%(+1.23)#84 | 2.1%(+0.791)#5,736 |
| 85. | 47001 | 2.9% | 1.6%(+1.22)#85 | 2.1%(+0.776)#5,776 |
| 86. | 47965 | 2.9% | 1.6%(+1.22)#86 | 2.1%(+0.775)#5,788 |
| 87. | 47469 | 2.8% | 1.6%(+1.21)#87 | 2.1%(+0.763)#5,834 |
| 88. | 46601 | 2.8% | 1.6%(+1.19)#88 | 2.1%(+0.745)#5,895 |
| 89. | 47957 | 2.8% | 1.6%(+1.17)#89 | 2.1%(+0.724)#5,964 |
| 90. | 46201 | 2.8% | 1.6%(+1.14)#90 | 2.1%(+0.698)#6,062 |
| 91. | 46793 | 2.8% | 1.6%(+1.11)#91 | 2.1%(+0.671)#6,171 |
| 92. | 46319 | 2.7% | 1.6%(+1.11)#92 | 2.1%(+0.664)#6,200 |
| 93. | 46118 | 2.7% | 1.6%(+1.11)#93 | 2.1%(+0.664)#6,206 |
| 94. | 47150 | 2.7% | 1.6%(+1.11)#94 | 2.1%(+0.663)#6,207 |
| 95. | 47354 | 2.7% | 1.6%(+1.09)#95 | 2.1%(+0.649)#6,248 |
| 96. | 47024 | 2.7% | 1.6%(+1.09)#96 | 2.1%(+0.642)#6,272 |
| 97. | 46229 | 2.7% | 1.6%(+1.05)#97 | 2.1%(+0.606)#6,402 |
| 98. | 46052 | 2.7% | 1.6%(+1.04)#98 | 2.1%(+0.602)#6,415 |
| 99. | 47401 | 2.7% | 1.6%(+1.04)#99 | 2.1%(+0.602)#6,416 |
| 100. | 47143 | 2.7% | 1.6%(+1.01)#100 | 2.1%(+0.571)#6,547 |
Common Questions
What are the Top 10 Zip Codes with the Highest Percentage of Population Employed in Arts, Entertainment & Recreation in Indiana?
Top 10 Zip Codes with the Highest Percentage of Population Employed in Arts, Entertainment & Recreation in Indiana are:
What zip code has the Highest Percentage of Population Employed in Arts, Entertainment & Recreation in Indiana?
47020 has the Highest Percentage of Population Employed in Arts, Entertainment & Recreation in Indiana with 29.8%.
What is the Percentage of Population Employed in Arts, Entertainment & Recreation in the State of Indiana?
Percentage of Population Employed in Arts, Entertainment & Recreation in Indiana is 1.6%.
What is the Percentage of Population Employed in Arts, Entertainment & Recreation in the United States?
Percentage of Population Employed in Arts, Entertainment & Recreation in the United States is 2.1%.