Zip Codes with the Highest Percentage of Population Employed in Community & Social Service in Indiana
RELATED REPORTS & OPTIONS
Community & Social Service
Indiana
Compare Zip Codes
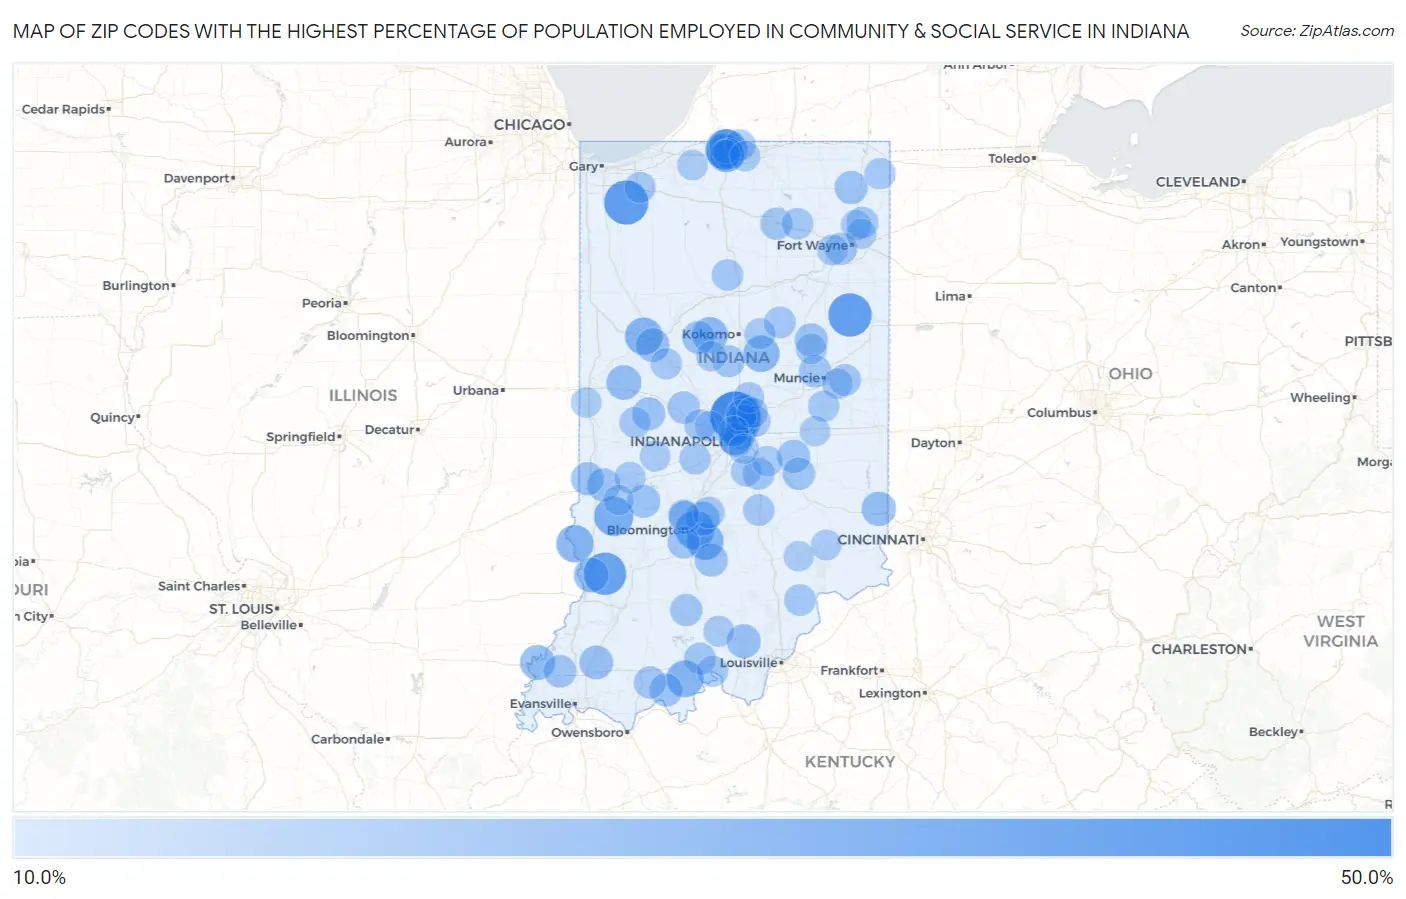
Map of Zip Codes with the Highest Percentage of Population Employed in Community & Social Service in Indiana
10.0%
50.0%
Zip Codes with the Highest Percentage of Population Employed in Community & Social Service in Indiana
| Zip Code | % Employed | vs State | vs National | |
| 1. | 46290 | 44.8% | 9.7%(+35.1)#1 | 11.2%(+33.6)#225 |
| 2. | 46302 | 35.7% | 9.7%(+26.0)#2 | 11.2%(+24.5)#376 |
| 3. | 46778 | 34.4% | 9.7%(+24.7)#3 | 11.2%(+23.2)#409 |
| 4. | 47535 | 32.6% | 9.7%(+22.9)#4 | 11.2%(+21.4)#461 |
| 5. | 46556 | 31.3% | 9.7%(+21.6)#5 | 11.2%(+20.1)#520 |
| 6. | 47858 | 27.5% | 9.7%(+17.8)#6 | 11.2%(+16.3)#730 |
| 7. | 47405 | 26.6% | 9.7%(+16.9)#7 | 11.2%(+15.4)#815 |
| 8. | 47906 | 24.4% | 9.7%(+14.7)#8 | 11.2%(+13.2)#1,050 |
| 9. | 47861 | 24.1% | 9.7%(+14.4)#9 | 11.2%(+12.9)#1,092 |
| 10. | 47401 | 23.9% | 9.7%(+14.1)#10 | 11.2%(+12.7)#1,129 |
| 11. | 47514 | 23.5% | 9.7%(+13.8)#11 | 11.2%(+12.3)#1,183 |
| 12. | 46617 | 23.5% | 9.7%(+13.8)#12 | 11.2%(+12.3)#1,196 |
| 13. | 46076 | 22.7% | 9.7%(+13.0)#13 | 11.2%(+11.5)#1,322 |
| 14. | 46915 | 21.8% | 9.7%(+12.1)#14 | 11.2%(+10.6)#1,521 |
| 15. | 46616 | 21.5% | 9.7%(+11.8)#15 | 11.2%(+10.3)#1,593 |
| 16. | 47616 | 20.3% | 9.7%(+10.6)#16 | 11.2%(+9.08)#1,930 |
| 17. | 47561 | 19.8% | 9.7%(+10.1)#17 | 11.2%(+8.63)#2,069 |
| 18. | 47958 | 19.7% | 9.7%(+9.95)#18 | 11.2%(+8.46)#2,138 |
| 19. | 46205 | 19.4% | 9.7%(+9.69)#19 | 11.2%(+8.20)#2,231 |
| 20. | 47408 | 19.1% | 9.7%(+9.34)#20 | 11.2%(+7.85)#2,370 |
| 21. | 47035 | 19.0% | 9.7%(+9.32)#21 | 11.2%(+7.83)#2,381 |
| 22. | 47164 | 18.6% | 9.7%(+8.86)#22 | 11.2%(+7.37)#2,562 |
| 23. | 46637 | 18.6% | 9.7%(+8.85)#23 | 11.2%(+7.36)#2,565 |
| 24. | 47654 | 18.2% | 9.7%(+8.46)#24 | 11.2%(+6.97)#2,733 |
| 25. | 47901 | 18.1% | 9.7%(+8.42)#25 | 11.2%(+6.93)#2,750 |
| 26. | 46220 | 17.7% | 9.7%(+8.02)#26 | 11.2%(+6.53)#2,950 |
| 27. | 46204 | 17.5% | 9.7%(+7.76)#27 | 11.2%(+6.27)#3,069 |
| 28. | 47436 | 17.4% | 9.7%(+7.67)#28 | 11.2%(+6.18)#3,119 |
| 29. | 47803 | 17.4% | 9.7%(+7.67)#29 | 11.2%(+6.18)#3,129 |
| 30. | 46730 | 17.3% | 9.7%(+7.57)#30 | 11.2%(+6.08)#3,190 |
| 31. | 47833 | 17.3% | 9.7%(+7.55)#31 | 11.2%(+6.06)#3,201 |
| 32. | 47965 | 17.1% | 9.7%(+7.42)#32 | 11.2%(+5.93)#3,286 |
| 33. | 47876 | 17.1% | 9.7%(+7.42)#33 | 11.2%(+5.93)#3,288 |
| 34. | 46989 | 17.1% | 9.7%(+7.41)#34 | 11.2%(+5.92)#3,300 |
| 35. | 47588 | 17.0% | 9.7%(+7.32)#35 | 11.2%(+5.83)#3,347 |
| 36. | 46202 | 17.0% | 9.7%(+7.31)#36 | 11.2%(+5.82)#3,358 |
| 37. | 46144 | 16.9% | 9.7%(+7.22)#37 | 11.2%(+5.73)#3,413 |
| 38. | 46920 | 16.8% | 9.7%(+7.11)#38 | 11.2%(+5.62)#3,486 |
| 39. | 47404 | 16.5% | 9.7%(+6.74)#39 | 11.2%(+5.25)#3,723 |
| 40. | 47612 | 16.2% | 9.7%(+6.47)#40 | 11.2%(+4.99)#3,918 |
| 41. | 46102 | 16.2% | 9.7%(+6.43)#41 | 11.2%(+4.94)#3,946 |
| 42. | 46150 | 16.1% | 9.7%(+6.36)#42 | 11.2%(+4.87)#4,011 |
| 43. | 47579 | 16.0% | 9.7%(+6.30)#43 | 11.2%(+4.81)#4,058 |
| 44. | 47304 | 16.0% | 9.7%(+6.28)#44 | 11.2%(+4.79)#4,064 |
| 45. | 47403 | 15.8% | 9.7%(+6.07)#45 | 11.2%(+4.58)#4,242 |
| 46. | 47469 | 15.7% | 9.7%(+5.93)#46 | 11.2%(+4.44)#4,378 |
| 47. | 46590 | 15.4% | 9.7%(+5.68)#47 | 11.2%(+4.19)#4,598 |
| 48. | 47123 | 15.4% | 9.7%(+5.66)#48 | 11.2%(+4.17)#4,622 |
| 49. | 46049 | 15.4% | 9.7%(+5.63)#49 | 11.2%(+4.14)#4,658 |
| 50. | 46804 | 15.3% | 9.7%(+5.53)#50 | 11.2%(+4.04)#4,750 |
| 51. | 46162 | 15.0% | 9.7%(+5.30)#51 | 11.2%(+3.81)#4,940 |
| 52. | 47368 | 14.9% | 9.7%(+5.20)#52 | 11.2%(+3.71)#5,039 |
| 53. | 46987 | 14.9% | 9.7%(+5.13)#53 | 11.2%(+3.65)#5,104 |
| 54. | 47468 | 14.8% | 9.7%(+5.06)#54 | 11.2%(+3.57)#5,175 |
| 55. | 46765 | 14.7% | 9.7%(+4.99)#55 | 11.2%(+3.50)#5,247 |
| 56. | 47138 | 14.7% | 9.7%(+4.98)#56 | 11.2%(+3.49)#5,253 |
| 57. | 46988 | 14.7% | 9.7%(+4.93)#57 | 11.2%(+3.44)#5,305 |
| 58. | 46118 | 14.6% | 9.7%(+4.83)#58 | 11.2%(+3.34)#5,427 |
| 59. | 46764 | 14.5% | 9.7%(+4.81)#59 | 11.2%(+3.33)#5,440 |
| 60. | 47280 | 14.5% | 9.7%(+4.74)#60 | 11.2%(+3.25)#5,506 |
| 61. | 46167 | 14.4% | 9.7%(+4.65)#61 | 11.2%(+3.16)#5,619 |
| 62. | 46033 | 14.4% | 9.7%(+4.64)#62 | 11.2%(+3.15)#5,628 |
| 63. | 47857 | 14.2% | 9.7%(+4.46)#63 | 11.2%(+2.97)#5,852 |
| 64. | 46742 | 14.2% | 9.7%(+4.44)#64 | 11.2%(+2.95)#5,876 |
| 65. | 47989 | 14.2% | 9.7%(+4.43)#65 | 11.2%(+2.95)#5,879 |
| 66. | 46250 | 14.1% | 9.7%(+4.42)#66 | 11.2%(+2.93)#5,900 |
| 67. | 47983 | 14.1% | 9.7%(+4.41)#67 | 11.2%(+2.92)#5,926 |
| 68. | 47361 | 14.1% | 9.7%(+4.36)#68 | 11.2%(+2.87)#5,990 |
| 69. | 47137 | 14.0% | 9.7%(+4.25)#69 | 11.2%(+2.76)#6,113 |
| 70. | 46936 | 13.9% | 9.7%(+4.20)#70 | 11.2%(+2.71)#6,189 |
| 71. | 46383 | 13.8% | 9.7%(+4.05)#71 | 11.2%(+2.56)#6,381 |
| 72. | 46256 | 13.8% | 9.7%(+4.03)#72 | 11.2%(+2.54)#6,416 |
| 73. | 46530 | 13.7% | 9.7%(+4.01)#73 | 11.2%(+2.52)#6,439 |
| 74. | 46615 | 13.6% | 9.7%(+3.91)#74 | 11.2%(+2.42)#6,564 |
| 75. | 46240 | 13.6% | 9.7%(+3.89)#75 | 11.2%(+2.40)#6,595 |
| 76. | 46814 | 13.6% | 9.7%(+3.84)#76 | 11.2%(+2.36)#6,655 |
| 77. | 46957 | 13.5% | 9.7%(+3.78)#77 | 11.2%(+2.29)#6,748 |
| 78. | 47125 | 13.4% | 9.7%(+3.71)#78 | 11.2%(+2.22)#6,848 |
| 79. | 46184 | 13.4% | 9.7%(+3.64)#79 | 11.2%(+2.15)#6,959 |
| 80. | 46280 | 13.3% | 9.7%(+3.61)#80 | 11.2%(+2.12)#7,018 |
| 81. | 46135 | 13.3% | 9.7%(+3.54)#81 | 11.2%(+2.05)#7,139 |
| 82. | 47383 | 13.2% | 9.7%(+3.52)#82 | 11.2%(+2.03)#7,163 |
| 83. | 46062 | 13.2% | 9.7%(+3.51)#83 | 11.2%(+2.02)#7,172 |
| 84. | 46112 | 13.2% | 9.7%(+3.45)#84 | 11.2%(+1.96)#7,283 |
| 85. | 46038 | 13.2% | 9.7%(+3.44)#85 | 11.2%(+1.95)#7,293 |
| 86. | 46365 | 13.1% | 9.7%(+3.42)#86 | 11.2%(+1.93)#7,324 |
| 87. | 46126 | 13.0% | 9.7%(+3.32)#87 | 11.2%(+1.83)#7,490 |
| 88. | 46208 | 13.0% | 9.7%(+3.28)#88 | 11.2%(+1.79)#7,543 |
| 89. | 47429 | 13.0% | 9.7%(+3.26)#89 | 11.2%(+1.78)#7,574 |
| 90. | 47023 | 13.0% | 9.7%(+3.25)#90 | 11.2%(+1.76)#7,601 |
| 91. | 47974 | 12.9% | 9.7%(+3.21)#91 | 11.2%(+1.72)#7,659 |
| 92. | 47846 | 12.9% | 9.7%(+3.19)#92 | 11.2%(+1.70)#7,709 |
| 93. | 46601 | 12.9% | 9.7%(+3.14)#93 | 11.2%(+1.65)#7,783 |
| 94. | 46845 | 12.9% | 9.7%(+3.14)#94 | 11.2%(+1.65)#7,792 |
| 95. | 47385 | 12.8% | 9.7%(+3.07)#95 | 11.2%(+1.58)#7,890 |
| 96. | 46835 | 12.8% | 9.7%(+3.07)#96 | 11.2%(+1.58)#7,899 |
| 97. | 47282 | 12.8% | 9.7%(+3.06)#97 | 11.2%(+1.57)#7,922 |
| 98. | 46057 | 12.7% | 9.7%(+2.99)#98 | 11.2%(+1.50)#8,042 |
| 99. | 46107 | 12.7% | 9.7%(+2.93)#99 | 11.2%(+1.44)#8,156 |
| 100. | 46561 | 12.6% | 9.7%(+2.92)#100 | 11.2%(+1.43)#8,178 |
Common Questions
What are the Top 10 Zip Codes with the Highest Percentage of Population Employed in Community & Social Service in Indiana?
Top 10 Zip Codes with the Highest Percentage of Population Employed in Community & Social Service in Indiana are:
What zip code has the Highest Percentage of Population Employed in Community & Social Service in Indiana?
46290 has the Highest Percentage of Population Employed in Community & Social Service in Indiana with 44.8%.
What is the Percentage of Population Employed in Community & Social Service in the State of Indiana?
Percentage of Population Employed in Community & Social Service in Indiana is 9.7%.
What is the Percentage of Population Employed in Community & Social Service in the United States?
Percentage of Population Employed in Community & Social Service in the United States is 11.2%.